College Park neighborhood in San Jose, California (CA), 95126 detailed profile
Settings
X

Business Search - 14 Million verified businesses
Area: 0.136 square miles
Population: 968
Population density:
| College Park: | 7,122 people per square mile |
| San Jose: | 5,554 people per square mile |

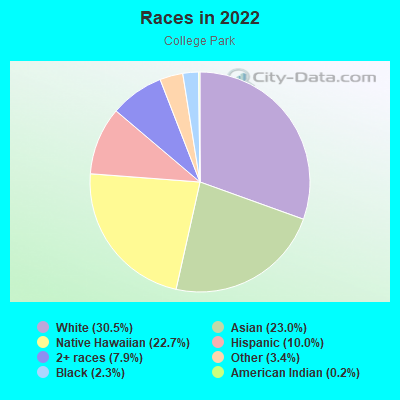
- 37238.4%Hispanic or Latino
- 29630.6%White
- 12512.9%Asian
- 929.5%Two or more races
- 778.0%Black
- 30.3%Some other race
- 20.2%Native Hawaiian and Other
Pacific Islander - 10.1%American Indian
Median household income in 2022:
| College Park: | $196,989 |
| San Jose: | $133,835 |
Distribution of median household income
![Distribution of median household income]()
- 4Less than $10,000
- 7$10,000 to $19,999
- 8$20,000 to $29,999
- 17$30,000 to $39,999
- 12$40,000 to $49,999
- 10$50,000 to $59,999
- 22$60,000 to $74,999
- 24$75,000 to $99,999
- 47$100,000 to $124,999
- 57$125,000 to $149,999
- 49$150,000 to $199,999
- 115$200,000 or more

Distribution of owner-occupied house/condo value
![Distribution of owner-occupied house/condo value]()
- 9Less than $50,000
- 2$50,000 to $99,999
- 7$250,000 to $299,999
- 2$300,000 to $399,999
- 4$400,000 to $499,999
- 13$500,000 to $749,999
- 37$750,000 to $999,999
- 100$1,000,000 or more

Distribution of rent paid by renters
![Distribution of rent paid by renters]()
- 4Less than $100
- 2$200 to $299
- 28$300 to $399
- 2$400 to $499
- 7$500 to $599
- 2$600 to $699
- 8$700 to $799
- 8$800 to $899
- 2$900 to $999
- 6$1,000 to $1,249
- 5$1,250 to $1,499
- 52$1,500 to $1,999
- 157$2,000 or more

Median rent in 2022:
| College Park: | $2,326 |
| San Jose: | $2,001 |
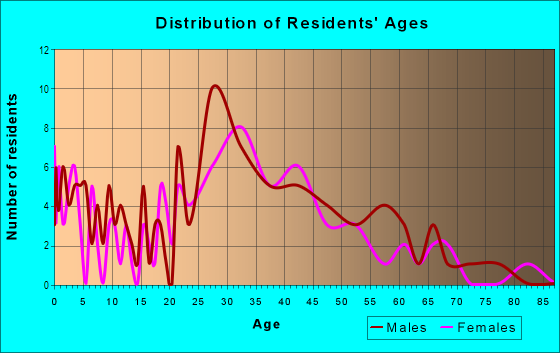
| Males: | 560 |
| Females: | 407 |
Males:
| This neighborhood: | 35.3 years |
| Whole city: | 37.6 years |
| This neighborhood: | 40.1 years |
| Whole city: | 39.1 years |
Average household size:
| College Park: | 3.9 people |
| San Jose: | 2.9 people |
Percentage of family households:
| College Park: | 54.3% |
| San Jose: | 49.9% |
| Here: | 41.9% |
| San Jose: | 53.0% |
Percentage of married-couple families with children (among all households):
| College Park: | 24.2% |
| San Jose: | 25.8% |
Percentage of single-mother households (among all households):
| College Park: | 11.6% |
| San Jose: | 5.2% |
Percentage of never married males 15 years old and over:
Percentage of never married females 15 years old and over:
| College Park: | 26.4% |
| San Jose: | 20.9% |
Percentage of never married females 15 years old and over:
| College Park: | 14.0% |
| city: | 16.7% |
Percentage of people that speak English not well or not at all:
| College Park: | 4.4% |
| San Jose: | 11.4% |
Percentage of people born in this state:
Percentage of people born in another U.S. state:
Percentage of native residents but born outside the U.S.:
Percentage of foreign born residents:
| Here: | 53.7% |
| San Jose: | 46.1% |
Percentage of people born in another U.S. state:
| College Park: | 17.5% |
| San Jose: | 10.4% |
Percentage of native residents but born outside the U.S.:
| Here: | 1.3% |
| city: | 1.7% |
Percentage of foreign born residents:
| Here: | 28.8% |
| San Jose: | 41.8% |
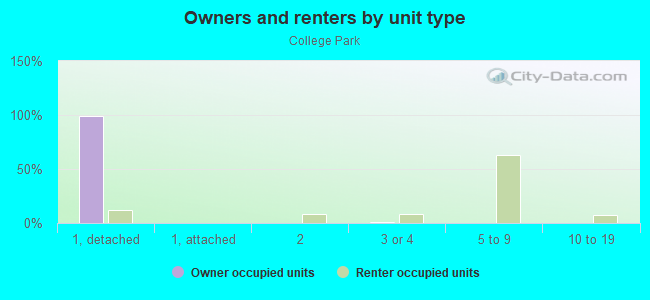
Owner-occupied
Renter-occupied

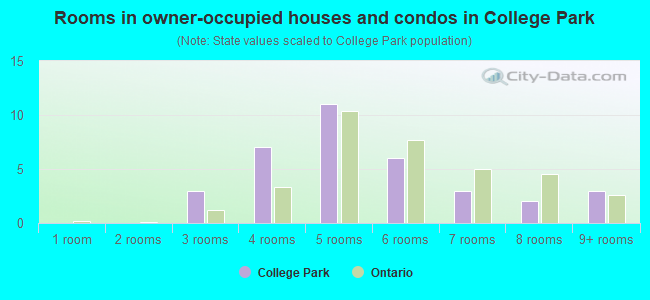
- Rooms in owner-occupied houses and condos in College Park
- 21 room
- 12 rooms
- 43 rooms
- 74 rooms
- 405 rooms
- 516 rooms
- 97 rooms
- 118 rooms
- 159+ rooms
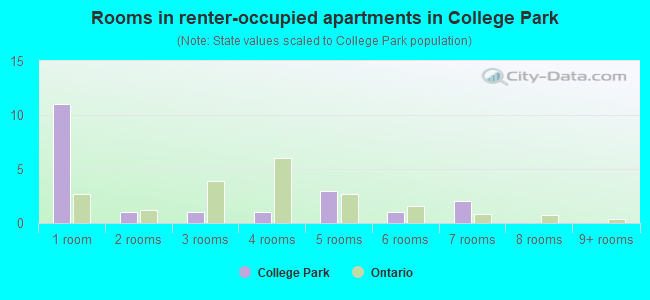
- Rooms in renter-occupied apartments in College Park
- 41 room
- 572 rooms
- 543 rooms
- 424 rooms
- 215 rooms
- 296 rooms
- 77 rooms
- 48 rooms
- 19+ rooms
Owner-occupied
Renter-occupied
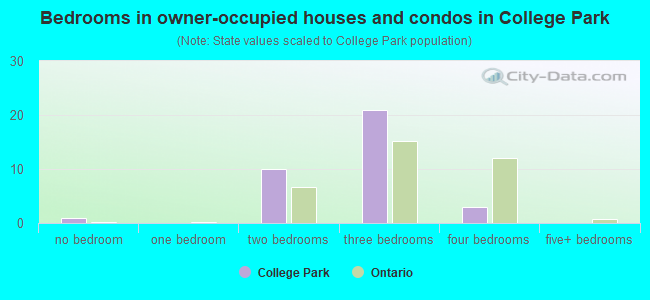
- Bedrooms in owner-occupied houses and condos in College Park
- 2no bedroom
- 41 bedroom
- 492 bedrooms
- 573 bedrooms
- 254 bedrooms
- 45+ bedrooms
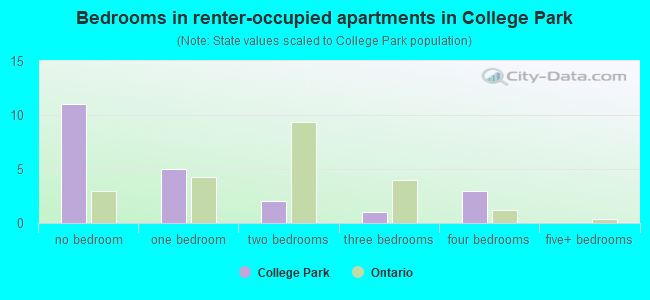
- Bedrooms in renter-occupied apartments in College Park
- 20no bedroom
- 781 bedroom
- 942 bedrooms
- 183 bedrooms
- 84 bedrooms
- 55+ bedrooms
Average number of cars or other vehicles available in houses/condos:
Average number of cars or other vehicles available in apartments:
| This neighborhood: | 2.6 |
| San Jose: | 2.3 |
Average number of cars or other vehicles available in apartments:
| Here: | 1.8 |
| city: | 1.6 |
Percentage of units with a mortgage:
| College Park: | 75.4% |
| San Jose: | 66.9% |
Average estimated value of detached houses in 2022 (51.2% of all units):
| College Park: | $1,236,868 |
| San Jose: | $1,532,815 |
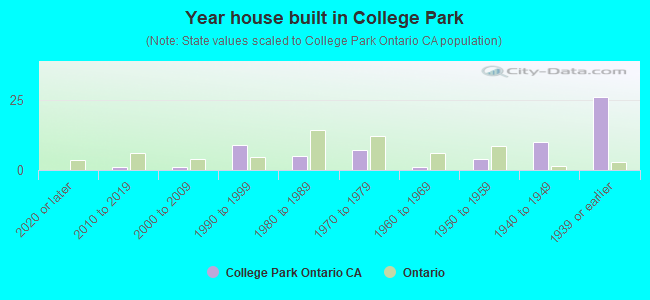
- Year house built in College Park
- 72020 or later
- 32010 to 2019
- 62000 to 2009
- 51990 to 1999
- 431980 to 1989
- 521970 to 1979
- 651960 to 1969
- 31950 to 1959
- 231940 to 1949
- 1631939 or earlier
City-data.com crime index for city in 2020 (higher means more crime):
| City: | 268.4 |
| U.S. average: | 219.5 |
Travel time to work (commute)
![Travel time to work (commute)]()
- 9Less than 5 minutes
- 405 to 9 minutes
- 7110 to 14 minutes
- 5015 to 19 minutes
- 3320 to 24 minutes
- 2025 to 29 minutes
- 4530 to 34 minutes
- 2335 to 39 minutes
- 640 to 44 minutes
- 6445 to 59 minutes
- 2460 to 89 minutes
- 2090 or more minutes

Means of transportation to work
![Means of transportation to work]()
- 65.1%391Drove a car alone
- 6.5%39Carpooled
- 5.8%35Bus
- 0.2%1Subway or elevated rail
- 3.3%20Long-distance train or commuter rail
- 1.2%7Light rail, streetcar or trolley
- 0.2%1Bicycle
- 2.3%14Walked
- 1.3%8Other means
- 15.2%91Worked at home

Time leaving home to go to work
![Time leaving home to go to work]()
- 1712:00 a.m. to 4:59 a.m.
- 115:00 a.m. to 5:29 a.m.
- 15:30 a.m. to 5:59 a.m.
- 146:00 a.m. to 6:29 a.m.
- 346:30 a.m. to 6:59 a.m.
- 587:00 a.m. to 7:29 a.m.
- 587:30 a.m. to 7:59 a.m.
- 868:00 a.m. to 8:29 a.m.
- 488:30 a.m. to 8:59 a.m.
- 239:00 a.m. to 9:59 a.m.
- 510:00 a.m. to 10:59 a.m.
- 711:00 a.m. to 11:59 a.m.
- 1812:00 p.m. to 3:59 p.m.
- 174:00 p.m. to 11:59 p.m.

Occupations of males:
- Percentage of males in management occupations (except farmers):
Here: 11.8% city: 13.0%
- Percentage of males in business and financial operations occupations:
Here: 8.2% city: 4.6%
- Percentage of males in computer and mathematical occupations:
Here: 4.0% city: 13.6%
- Percentage of males in architecture and engineering occupations:
Here: 7.7% city: 10.2%
- Percentage of males in life, physical, and social science occupations:
Here: 12.7% city: 1.1%
- Percentage of males in community and social services occupations:
Here: 4.6% city: 0.8%
- Percentage of males in legal occupations:
Here: 2.9% city: 0.8%
- Percentage of males in education, training, and library occupations:
Here: 4.9% city: 2.8%
- Percentage of males in arts, design, entertainment, sports, and media occupations:
Here: 4.0% city: 1.8%
- Percentage of males in healthcare practitioners and technical occupations:
Here: 2.9% city: 2.0%
- Percentage of males in service occupations:
Here: 8.8% city: 12.7%
- Percentage of males in sales and office occupations:
Here: 7.9% city: 12.8%
- Percentage of males in construction, extraction, and maintenance occupations:
Here: 10.8% city: 7.8%
- Percentage of males in transportation occupations:
Here: 6.2% city: 3.6%
- Percentage of males in material moving occupations:
Here: 1.7% city: 3.1%
Occupations of females:
- Percentage of females in management occupations (except farmers):
Here: 16.3% city: 11.0%
- Percentage of females in business and financial operations occupations:
Here: 3.4% city: 8.6%
- Percentage of females in computer and mathematical occupations:
Here: 2.8% city: 5.4%
- Percentage of females in architecture and engineering occupations:
Here: 1.1% city: 2.8%
- Percentage of females in life, physical, and social science occupations:
Here: 4.2% city: 1.7%
- Percentage of females in education, training, and library occupations:
Here: 19.4% city: 8.1%
- Percentage of females in arts, design, entertainment, sports, and media occupations:
Here: 1.6% city: 2.0%
- Percentage of females in healthcare practitioners and technical occupations:
Here: 8.5% city: 6.8%
- Percentage of females in service occupations:
Here: 12.6% city: 21.7%
- Percentage of females in sales and office occupations:
Here: 30.5% city: 22.0%
Percentage of people 16-64 in Armed Forces:
| College Park: | 0.8% |
| San Jose: | 0.0% |
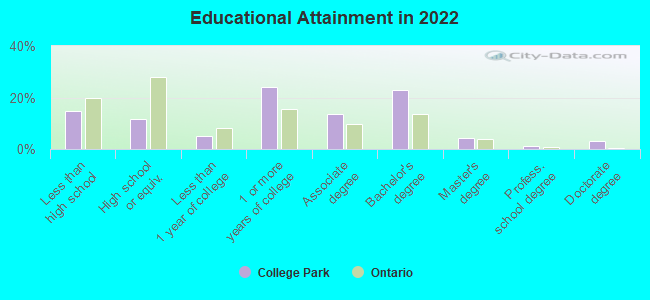
Education in this neighborhood (subdivision or community):
- Percentage of people 3 years and older in K-12 schools:
College Park: 14.1% San Jose: 16.1%
- Percentage of people 3 years and older in undergraduate colleges:
College Park: 3.8% San Jose: 6.5%
- Percentage of people 3 years and older in grad. or professional schools:
College Park: 5.5% San Jose: 2.0%
- Percentage of students K-12 enrolled in private schools:
College Park: 36.6% San Jose: 14.9%
Percentage of population below poverty level:
| College Park: | 5.3% |
| San Jose: | 9.0% |
Median year owner moved in (as recorded in 2022):
Median year renter moved in (as recorded in 2022):
| College Park: | 2007 |
| San Jose: | 2008 |
Median year renter moved in (as recorded in 2022):
| College Park: | 2018 |
| San Jose: | 2020 |
Percentage of married-couple families with both working:
| College Park: | 106.7% |
| San Jose: | 72.5% |
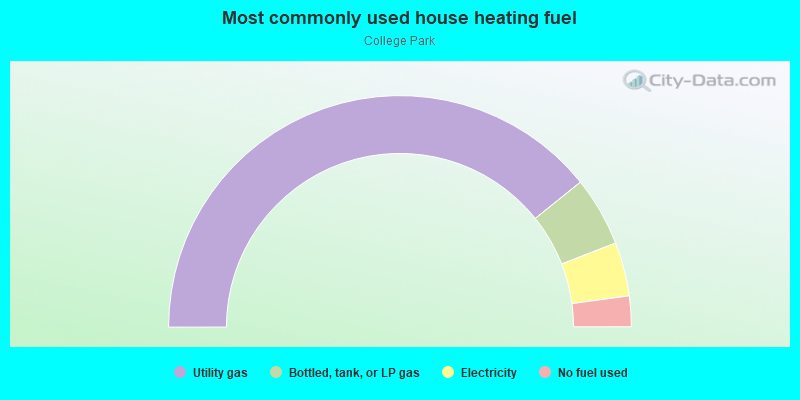
- 63.1%Utility gas
- 27.2%Electricity
- 4.6%Solar energy
- 3.1%No fuel used
- 2.0%Bottled, tank, or LP gas
Roads and streets:
W Taylor St
Length: 0.36 miles
Directions: E-W, SW-NE
Address range: 700 to 1049
Directions: E-W, SW-NE
Address range: 700 to 1049
Emory St
Length: 0.32 miles
Direction: SW-NE
Address range: 700 to 999
Direction: SW-NE
Address range: 700 to 999
Asbury St
Length: 0.32 miles
Direction: SW-NE
Address range: 700 to 999
Direction: SW-NE
Address range: 700 to 999
Myrtle St
Length: 0.30 miles
Direction: SE-NW
Address range: 700 to 849
Direction: SE-NW
Address range: 700 to 849
Elm St
Length: 0.30 miles
Directions: E-W, SE-NW
Address range: 700 to 849
Directions: E-W, SE-NW
Address range: 700 to 849
Stockton Ave
Length: 0.28 miles
Direction: SE-NW
Address range: 700 to 899
Direction: SE-NW
Address range: 700 to 899
Laurel St
Length: 0.20 miles
Direction: SE-NW
Address range: 700 to 799
Direction: SE-NW
Address range: 700 to 799
University Ave
Length: 0.10 miles
Directions: E-W, SW-NE
Address range: 900 to 999
Directions: E-W, SW-NE
Address range: 900 to 999