Como neighborhood in Minneapolis, Minnesota (MN), 55414 detailed profile
Settings
X

Business Search - 14 Million verified businesses
Area: 1.123 square miles
Population: 3,909
Population density:
| Como: | 3,482 people per square mile |
| Minneapolis: | 7,744 people per square mile |

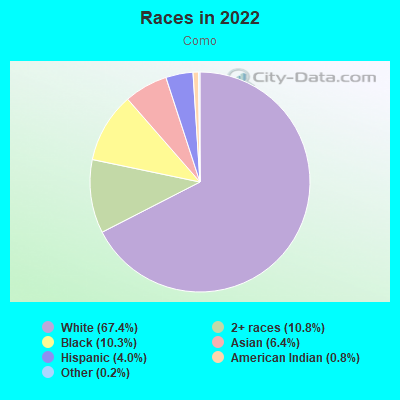
- 2,70767.4%White
- 43210.8%Two or more races
- 41510.3%Black
- 2596.4%Asian
- 1614.0%Hispanic or Latino
- 340.8%American Indian
- 100.2%Some other race
Median household income in 2022:
| Como: | $80,735 |
| Minneapolis: | $74,473 |
Distribution of median household income
![Distribution of median household income]()
- 76Less than $10,000
- 69$10,000 to $19,999
- 85$20,000 to $29,999
- 128$30,000 to $39,999
- 213$40,000 to $49,999
- 128$50,000 to $59,999
- 156$60,000 to $74,999
- 231$75,000 to $99,999
- 123$100,000 to $124,999
- 160$125,000 to $149,999
- 171$150,000 to $199,999
- 127$200,000 or more

Distribution of owner-occupied house/condo value
![Distribution of owner-occupied house/condo value]()
- 84Less than $50,000
- 162$50,000 to $99,999
- 381$100,000 to $149,999
- 328$150,000 to $199,999
- 109$200,000 to $249,999
- 261$250,000 to $299,999
- 236$300,000 to $399,999
- 103$400,000 to $499,999
- 124$500,000 to $749,999
- 95$750,000 to $999,999
- 48$1,000,000 or more

Distribution of rent paid by renters
![Distribution of rent paid by renters]()
- 9Less than $100
- 8$100 to $199
- 11$200 to $299
- 33$400 to $499
- 40$500 to $599
- 27$600 to $699
- 155$700 to $799
- 62$800 to $899
- 70$900 to $999
- 157$1,000 to $1,249
- 65$1,250 to $1,499
- 169$1,500 to $1,999
- 164$2,000 or more

Median rent in 2022:
| Como: | $1,198 |
| Minneapolis: | $1,159 |
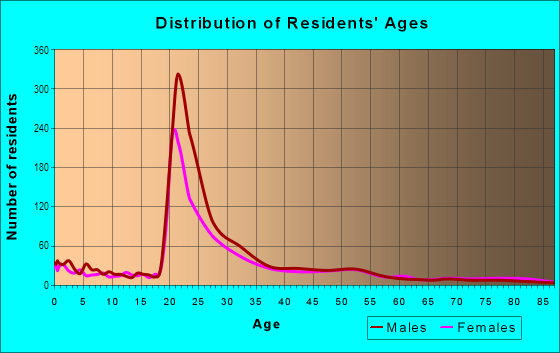
| Males: | 2,007 |
| Females: | 1,902 |
Males:
| This neighborhood: | 33.7 years |
| Whole city: | 33.3 years |
| This neighborhood: | 34.4 years |
| Whole city: | 33.2 years |
Average household size:
| Como: | 2.5 people |
| Minneapolis: | 2.1 people |
Percentage of family households:
| Como: | 34.5% |
| Minneapolis: | 34.1% |
| Here: | 32.3% |
| Minneapolis: | 29.8% |
Percentage of married-couple families with children (among all households):
| Como: | 25.1% |
| Minneapolis: | 31.8% |
Percentage of single-mother households (among all households):
| Como: | 9.6% |
| Minneapolis: | 10.5% |
Percentage of never married males 15 years old and over:
Percentage of never married females 15 years old and over:
| Como: | 28.0% |
| Minneapolis: | 27.0% |
Percentage of never married females 15 years old and over:
| Como: | 25.3% |
| city: | 25.4% |
Percentage of people that speak English not well or not at all:
| Como: | 0.0% |
| Minneapolis: | 3.8% |
Percentage of people born in this state:
Percentage of people born in another U.S. state:
Percentage of native residents but born outside the U.S.:
Percentage of foreign born residents:
| Here: | 54.1% |
| Minneapolis: | 51.9% |
Percentage of people born in another U.S. state:
| Como: | 31.8% |
| Minneapolis: | 31.8% |
Percentage of native residents but born outside the U.S.:
| Here: | 1.1% |
| city: | 1.5% |
Percentage of foreign born residents:
| Here: | 13.0% |
| Minneapolis: | 14.7% |
Owner-occupied
Renter-occupied

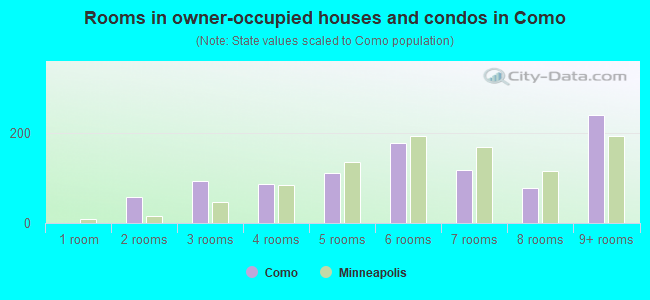
- Rooms in owner-occupied houses and condos in Como
- 01 room
- 582 rooms
- 933 rooms
- 884 rooms
- 1125 rooms
- 1796 rooms
- 1197 rooms
- 778 rooms
- 2419+ rooms
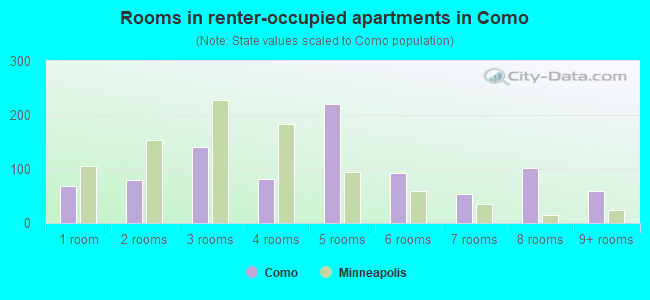
- Rooms in renter-occupied apartments in Como
- 691 room
- 792 rooms
- 1413 rooms
- 814 rooms
- 2205 rooms
- 936 rooms
- 537 rooms
- 1018 rooms
- 609+ rooms
Owner-occupied
Renter-occupied
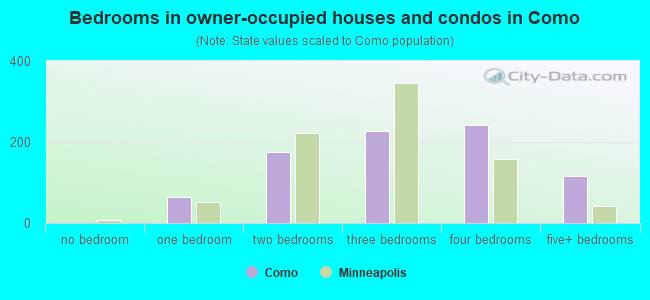
- Bedrooms in owner-occupied houses and condos in Como
- 0no bedroom
- 651 bedroom
- 1762 bedrooms
- 2263 bedrooms
- 2424 bedrooms
- 1175+ bedrooms
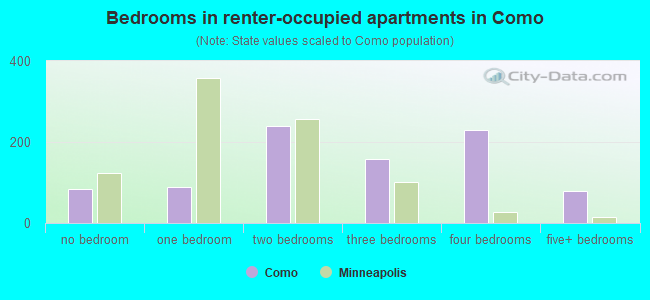
- Bedrooms in renter-occupied apartments in Como
- 84no bedroom
- 891 bedroom
- 2392 bedrooms
- 1593 bedrooms
- 2304 bedrooms
- 805+ bedrooms
Average number of cars or other vehicles available in houses/condos:
Average number of cars or other vehicles available in apartments:
| This neighborhood: | 1.9 |
| Minneapolis: | 1.6 |
Average number of cars or other vehicles available in apartments:
| Here: | 1.4 |
| city: | 1.1 |
Percentage of units with a mortgage:
| Como: | 65.3% |
| Minneapolis: | 71.8% |
Housing prices:
- Average estimated value of detached houses in 2022 (53.3% of all units):
Como: $304,456 Minnesota: $374,552
- Average estimated value of housing units in 2-unit structures in 2022 (13.8% of all units):
This neighborhood: $321,100 Minnesota: $323,045
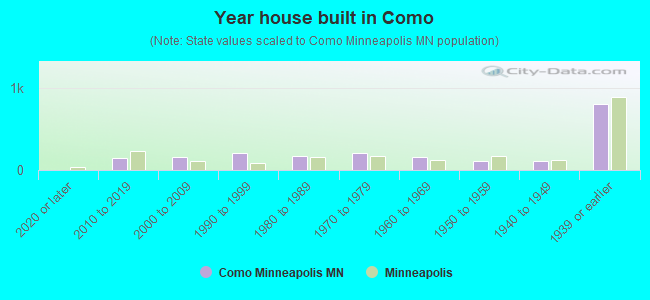
- Year house built in Como
- 02020 or later
- 1442010 to 2019
- 1642000 to 2009
- 2111990 to 1999
- 1761980 to 1989
- 2021970 to 1979
- 1571960 to 1969
- 1061950 to 1959
- 1061940 to 1949
- 8061939 or earlier
City-data.com crime index for city in 2020 (higher means more crime):
| City: | 600.2 |
| U.S. average: | 219.5 |
Travel time to work (commute)
![Travel time to work (commute)]()
- 82Less than 5 minutes
- 1905 to 9 minutes
- 42610 to 14 minutes
- 43215 to 19 minutes
- 51420 to 24 minutes
- 16025 to 29 minutes
- 29530 to 34 minutes
- 3435 to 39 minutes
- 1540 to 44 minutes
- 16845 to 59 minutes
- 4760 to 89 minutes
- 1690 or more minutes

Means of transportation to work
![Means of transportation to work]()
- 66.5%1,496Drove a car alone
- 4.8%108Carpooled
- 5.4%122Bus
- 0.7%16Subway or elevated rail
- 1.5%34Long-distance train or commuter rail
- 7.6%170Light rail, streetcar or trolley
- 2.2%50Taxi
- 3.9%88Motorcycle
- 1.2%28Bicycle
- 5.0%112Walked
- 1.7%38Other means
- 14.6%329Worked at home

Time leaving home to go to work
![Time leaving home to go to work]()
- 3312:00 a.m. to 4:59 a.m.
- 325:00 a.m. to 5:29 a.m.
- 895:30 a.m. to 5:59 a.m.
- 586:00 a.m. to 6:29 a.m.
- 1646:30 a.m. to 6:59 a.m.
- 2947:00 a.m. to 7:29 a.m.
- 4337:30 a.m. to 7:59 a.m.
- 2548:00 a.m. to 8:29 a.m.
- 2168:30 a.m. to 8:59 a.m.
- 2289:00 a.m. to 9:59 a.m.
- 10210:00 a.m. to 10:59 a.m.
- 5011:00 a.m. to 11:59 a.m.
- 18912:00 p.m. to 3:59 p.m.
- 1404:00 p.m. to 11:59 p.m.

Occupations of males:
- Percentage of males in management occupations (except farmers):
Here: 9.5% city: 12.1%
- Percentage of males in business and financial operations occupations:
Here: 7.6% city: 9.1%
- Percentage of males in computer and mathematical occupations:
Here: 5.6% city: 8.4%
- Percentage of males in architecture and engineering occupations:
Here: 2.6% city: 4.6%
- Percentage of males in life, physical, and social science occupations:
Here: 7.4% city: 2.0%
- Percentage of males in legal occupations:
Here: 3.9% city: 2.0%
- Percentage of males in education, training, and library occupations:
Here: 8.7% city: 5.2%
- Percentage of males in arts, design, entertainment, sports, and media occupations:
Here: 5.3% city: 4.0%
- Percentage of males in healthcare practitioners and technical occupations:
Here: 3.3% city: 3.6%
- Percentage of males in service occupations:
Here: 13.0% city: 12.6%
- Percentage of males in sales and office occupations:
Here: 15.5% city: 15.3%
- Percentage of males in construction, extraction, and maintenance occupations:
Here: 5.0% city: 3.3%
- Percentage of males in production occupations:
Here: 4.1% city: 5.8%
- Percentage of males in transportation occupations:
Here: 1.8% city: 4.1%
- Percentage of males in material moving occupations:
Here: 3.6% city: 3.6%
Occupations of females:
- Percentage of females in management occupations (except farmers):
Here: 7.1% city: 11.4%
- Percentage of females in business and financial operations occupations:
Here: 2.2% city: 9.8%
- Percentage of females in architecture and engineering occupations:
Here: 2.6% city: 1.2%
- Percentage of females in life, physical, and social science occupations:
Here: 1.4% city: 2.3%
- Percentage of females in community and social services occupations:
Here: 4.0% city: 3.8%
- Percentage of females in legal occupations:
Here: 2.7% city: 2.3%
- Percentage of females in education, training, and library occupations:
Here: 14.0% city: 10.6%
- Percentage of females in arts, design, entertainment, sports, and media occupations:
Here: 2.4% city: 5.6%
- Percentage of females in healthcare practitioners and technical occupations:
Here: 19.5% city: 8.3%
- Percentage of females in service occupations:
Here: 22.5% city: 17.8%
- Percentage of females in sales and office occupations:
Here: 21.5% city: 18.7%
- Percentage of females in material moving occupations:
Here: 1.4% city: 1.5%
Percentage of people 16-64 in Armed Forces:
| Como: | 0.1% |
| Minneapolis: | 0.1% |
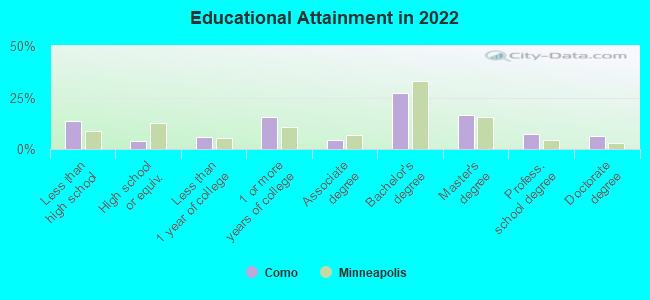
Education in this neighborhood (subdivision or community):
- Percentage of people 3 years and older in K-12 schools:
Como: 22.6% Minneapolis: 14.0%
- Percentage of people 3 years and older in undergraduate colleges:
Como: 12.6% Minneapolis: 8.6%
- Percentage of people 3 years and older in grad. or professional schools:
Como: 6.3% Minneapolis: 2.9%
- Percentage of students K-12 enrolled in private schools:
Como: 20.2% Minneapolis: 14.1%
Percentage of population below poverty level:
| Como: | 10.4% |
| Minneapolis: | 17.2% |
Median year owner moved in (as recorded in 2022):
Median year renter moved in (as recorded in 2022):
| Como: | 2003 |
| Minneapolis: | 2012 |
Median year renter moved in (as recorded in 2022):
| Como: | 2015 |
| Minneapolis: | 2021 |
Percentage of married-couple families with both working:
| Como: | 117.2% |
| Minneapolis: | 73.9% |

- 75.2%Utility gas
- 11.2%Electricity
- 4.2%Other fuel
- 3.7%Solar energy
- 2.1%Fuel oil, kerosene, etc.
- 1.8%Bottled, tank, or LP gas
- 1.6%No fuel used
Limited-access highways (interstate or state) in this neighborhood:
I- 35
Length: 0.31 miles
Directions: N-S, SE-NW, SW-NE
Directions: N-S, SE-NW, SW-NE
Roads and streets:
Como Ave SE
Length: 1.94 miles
Direction: E-W
Address range: 1100 to 3399
Direction: E-W
Address range: 1100 to 3399
Talmage Ave SE
Length: 1.76 miles
Direction: E-W
Address range: 1100 to 3299
Direction: E-W
Address range: 1100 to 3299
Elm St SE
Length: 1.47 miles
Direction: E-W
Address range: 1700 to 2699
Direction: E-W
Address range: 1700 to 2699
Kasota Ave SE
Length: 0.84 miles
Directions: E-W, SE-NW
Address range: 500 to 899
Directions: E-W, SE-NW
Address range: 500 to 899
Weeks Ave SE
Length: 0.75 miles
Directions: E-W, N-S, SE-NW
Address range: 710 to 2999
Directions: E-W, N-S, SE-NW
Address range: 710 to 2999
Fairmount Ave SE
Length: 0.69 miles
Direction: E-W
Address range: 1800 to 3099
Direction: E-W
Address range: 1800 to 3099
E Hennepin Ave
Length: 0.66 miles
Direction: E-W
Address range: 1050 to 1799
Direction: E-W
Address range: 1050 to 1799
29th Ave SE
Length: 0.62 miles
Directions: N-S, SE-NW
Address range: 700 to 1054
Directions: N-S, SE-NW
Address range: 700 to 1054
24th Ave SE
Length: 0.51 miles
Direction: N-S
Address range: 600 to 1056
Direction: N-S
Address range: 600 to 1056
18th Ave SE
Length: 0.50 miles
Direction: N-S
Address range: 800 to 1199
Direction: N-S
Address range: 800 to 1199
17th Ave SE
Length: 0.50 miles
Direction: N-S
Address range: 900 to 1199
Direction: N-S
Address range: 900 to 1199
Cole Ave SE
Length: 0.42 miles
Direction: SE-NW
Address range: 2200 to 2651
Direction: SE-NW
Address range: 2200 to 2651
15th Ave SE
Length: 0.42 miles
Direction: N-S
Address range: 900 to 1113
Direction: N-S
Address range: 900 to 1113
13th Ave SE
Length: 0.38 miles
Directions: N-S, SW-NE
Address range: 900 to 1122
Directions: N-S, SW-NE
Address range: 900 to 1122
19th Ave SE
Length: 0.38 miles
Directions: N-S, SE-NW
Address range: 800 to 1099
Directions: N-S, SE-NW
Address range: 800 to 1099
Rollins Ave SE
Length: 0.35 miles
Direction: E-W
Address range: 1400 to 1799
Direction: E-W
Address range: 1400 to 1799
22nd Ave SE
Length: 0.35 miles
Direction: N-S
Address range: 800 to 1055
Direction: N-S
Address range: 800 to 1055
21st Ave SE
Length: 0.35 miles
Direction: N-S
Address range: 800 to 1055
Direction: N-S
Address range: 800 to 1055
20th Ave SE
Length: 0.34 miles
Direction: N-S
Address range: 800 to 1099
Direction: N-S
Address range: 800 to 1099
16th Ave SE
Length: 0.34 miles
Direction: N-S
Address range: 1000 to 1199
Direction: N-S
Address range: 1000 to 1199
27th Ave SE
Length: 0.29 miles
Direction: N-S
Address range: 800 to 1056
Direction: N-S
Address range: 800 to 1056
23rd Ave SE
Length: 0.27 miles
Direction: N-S
Address range: 800 to 1055
Direction: N-S
Address range: 800 to 1055
12th Ave SE
Length: 0.25 miles
Directions: N-S, SW-NE
Address range: 1000 to 1199
Directions: N-S, SW-NE
Address range: 1000 to 1199
14th Ave SE
Length: 0.24 miles
Directions: N-S, SW-NE
Address range: 1002 to 1121
Directions: N-S, SW-NE
Address range: 1002 to 1121
25th Ave SE
Length: 0.24 miles
Direction: N-S
Address range: 800 to 1056
Direction: N-S
Address range: 800 to 1056
Brook Ave SE
Length: 0.24 miles
Direction: E-W
Address range: 500 to 1799
Direction: E-W
Address range: 500 to 1799
26th Ave SE
Length: 0.23 miles
Directions: N-S, SW-NE
Address range: 879 to 1056
Directions: N-S, SW-NE
Address range: 879 to 1056
11th Ave SE
Length: 0.18 miles
Direction: N-S
Address range: 1000 to 1110
Direction: N-S
Address range: 1000 to 1110
33rd Ave SE
Length: 0.17 miles
Direction: N-S
Address range: 1000 to 1077
Direction: N-S
Address range: 1000 to 1077
30th Ave SE
Length: 0.13 miles
Direction: N-S
Address range: 700 to 799
Direction: N-S
Address range: 700 to 799
28th Ave SE
Length: 0.12 miles
Direction: N-S
Address range: 700 to 999
Direction: N-S
Address range: 700 to 999
10th Ave SE
Length: 0.11 miles
Directions: N-S, SW-NE
Address range: 1111 to 1199
Directions: N-S, SW-NE
Address range: 1111 to 1199
Kasota Cir SE
Length: 0.08 miles
Direction: SW-NE
Address range: 700 to 799
Direction: SW-NE
Address range: 700 to 799
Paul Pl
Length: 0.07 miles
Direction: SW-NE
Direction: SW-NE
Ulysses St NE
Length: 0.02 miles
Direction: N-S
Address range: 300 to 352
Direction: N-S
Address range: 300 to 352
Railroad features:
Burlington Northern Santa Fe Rlwy
Length: 5.17 miles
Directions: E-W, N-S, SE-NW
Directions: E-W, N-S, SE-NW
Canadian Pacific Rlwy
Length: 0.34 miles
Directions: E-W, SE-NW
Directions: E-W, SE-NW