Cooper Park neighborhood in Bozeman, Montana (MT), 59715 detailed profile
Settings
X

Business Search - 14 Million verified businesses
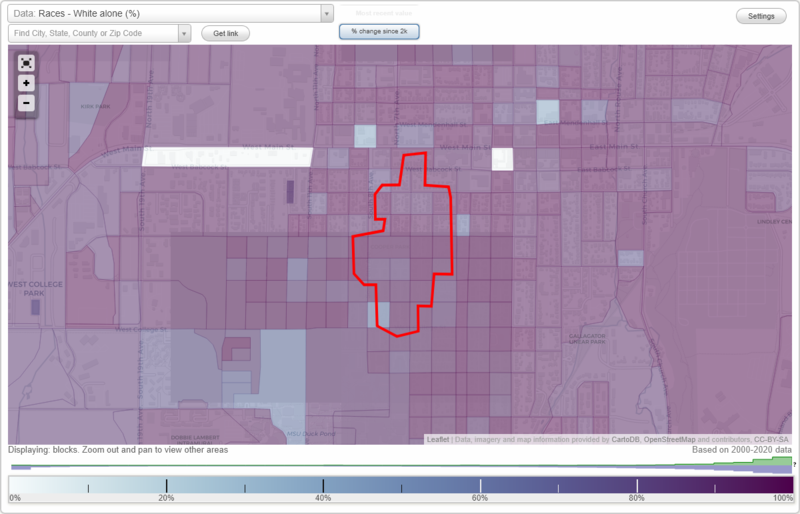
Area: 0.109 square miles
Population: 647
Population density:
| Cooper Park: | 5,939 people per square mile |
| Bozeman: | 4,247 people per square mile |

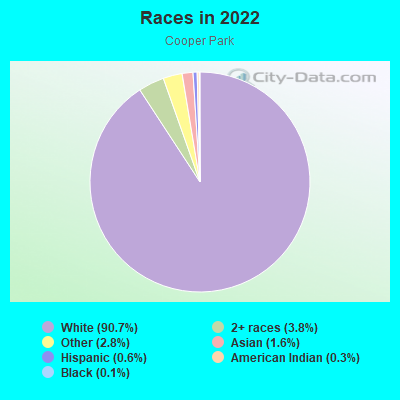
- 61490.7%White
- 263.8%Two or more races
- 192.8%Some other race
- 111.6%Asian
- 40.6%Hispanic or Latino
- 20.3%American Indian
- 10.1%Black
Median household income in 2022:
| Cooper Park: | $60,843 |
| Bozeman: | $74,113 |
Distribution of median household income
![Distribution of median household income]()
- 19Less than $10,000
- 46$10,000 to $19,999
- 42$20,000 to $29,999
- 57$30,000 to $39,999
- 31$40,000 to $49,999
- 23$50,000 to $59,999
- 30$60,000 to $74,999
- 51$75,000 to $99,999
- 21$100,000 to $124,999
- 16$125,000 to $149,999
- 24$150,000 to $199,999
- 71$200,000 or more

Distribution of owner-occupied house/condo value
![Distribution of owner-occupied house/condo value]()
- 4Less than $50,000
- 6$50,000 to $99,999
- 3$100,000 to $149,999
- 6$150,000 to $199,999
- 3$200,000 to $249,999
- 7$250,000 to $299,999
- 11$300,000 to $399,999
- 24$400,000 to $499,999
- 49$500,000 to $749,999
- 58$750,000 to $999,999
- 76$1,000,000 or more

Distribution of rent paid by renters
![Distribution of rent paid by renters]()
- 8$100 to $199
- 6$200 to $299
- 4$300 to $399
- 9$400 to $499
- 12$500 to $599
- 30$600 to $699
- 44$700 to $799
- 16$800 to $899
- 23$900 to $999
- 28$1,000 to $1,249
- 21$1,250 to $1,499
- 24$1,500 to $1,999
- 63$2,000 or more

Median rent in 2022:
| Cooper Park: | $1,130 |
| Bozeman: | $1,343 |
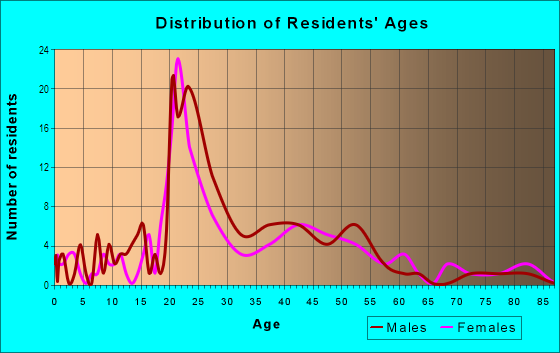
| Males: | 337 |
| Females: | 310 |
Males:
| This neighborhood: | 32.7 years |
| Whole city: | 27.8 years |
| This neighborhood: | 30.9 years |
| Whole city: | 28.9 years |
Average household size:
| Cooper Park: | 2.0 people |
| Bozeman: | 2.2 people |
Percentage of family households:
| Cooper Park: | 18.2% |
| Bozeman: | 36.1% |
| Here: | 26.0% |
| Bozeman: | 36.1% |
Percentage of married-couple families with children (among all households):
| Cooper Park: | 52.4% |
| Bozeman: | 31.7% |
Percentage of single-mother households (among all households):
| Cooper Park: | 28.0% |
| Bozeman: | 7.0% |
Percentage of never married males 15 years old and over:
Percentage of never married females 15 years old and over:
| Cooper Park: | 29.4% |
| Bozeman: | 30.7% |
Percentage of never married females 15 years old and over:
| Cooper Park: | 28.9% |
| city: | 22.0% |
Percentage of people that speak English not well or not at all:
| Cooper Park: | 0.3% |
| Bozeman: | 0.1% |
Percentage of people born in this state:
Percentage of people born in another U.S. state:
Percentage of native residents but born outside the U.S.:
Percentage of foreign born residents:
| Here: | 21.9% |
| Bozeman: | 29.8% |
Percentage of people born in another U.S. state:
| Cooper Park: | 72.1% |
| Bozeman: | 64.7% |
Percentage of native residents but born outside the U.S.:
| Here: | 0.6% |
| city: | 0.8% |
Percentage of foreign born residents:
| Here: | 5.4% |
| Bozeman: | 4.6% |
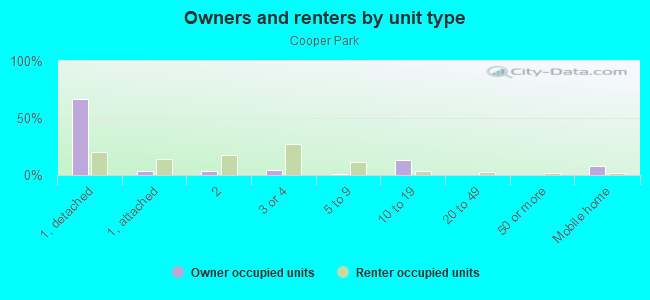
Owner-occupied
Renter-occupied

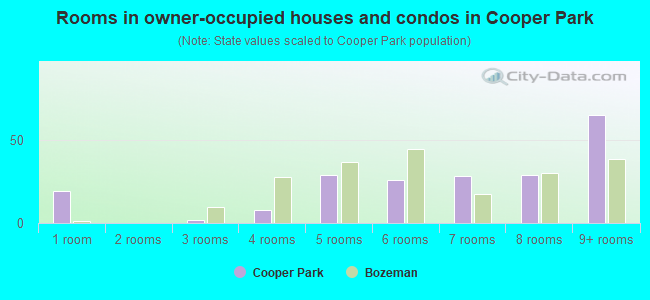
- Rooms in owner-occupied houses and condos in Cooper Park
- 191 room
- 02 rooms
- 23 rooms
- 84 rooms
- 295 rooms
- 266 rooms
- 287 rooms
- 298 rooms
- 659+ rooms
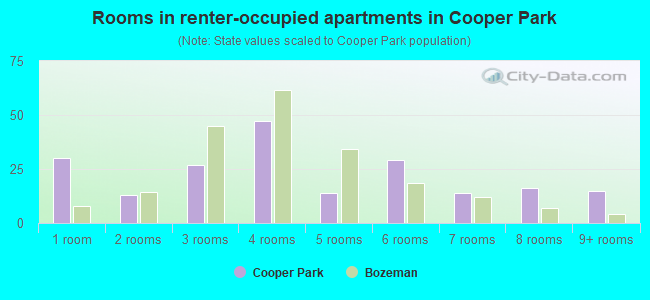
- Rooms in renter-occupied apartments in Cooper Park
- 301 room
- 132 rooms
- 273 rooms
- 474 rooms
- 145 rooms
- 296 rooms
- 147 rooms
- 168 rooms
- 159+ rooms
Owner-occupied
Renter-occupied
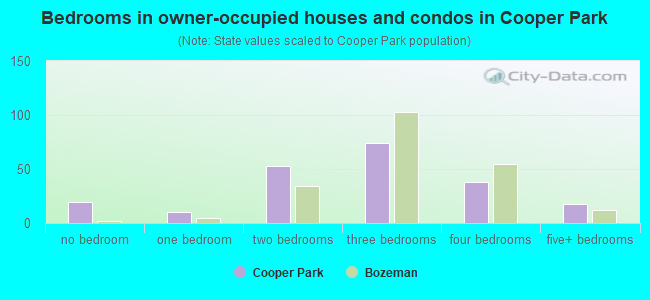
- Bedrooms in owner-occupied houses and condos in Cooper Park
- 19no bedroom
- 101 bedroom
- 532 bedrooms
- 743 bedrooms
- 384 bedrooms
- 185+ bedrooms
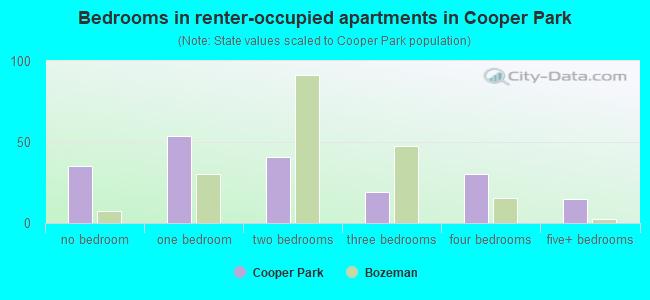
- Bedrooms in renter-occupied apartments in Cooper Park
- 35no bedroom
- 541 bedroom
- 412 bedrooms
- 193 bedrooms
- 304 bedrooms
- 155+ bedrooms
Average number of cars or other vehicles available in houses/condos:
Average number of cars or other vehicles available in apartments:
| This neighborhood: | 2.0 |
| Bozeman: | 2.0 |
Average number of cars or other vehicles available in apartments:
| Here: | 1.7 |
| city: | 1.8 |
Percentage of units with a mortgage:
| Cooper Park: | 35.2% |
| Bozeman: | 64.5% |
Average estimated value of detached houses in 2022 (61.5% of all units):
| Cooper Park: | $963,741 |
| Bozeman: | $664,180 |
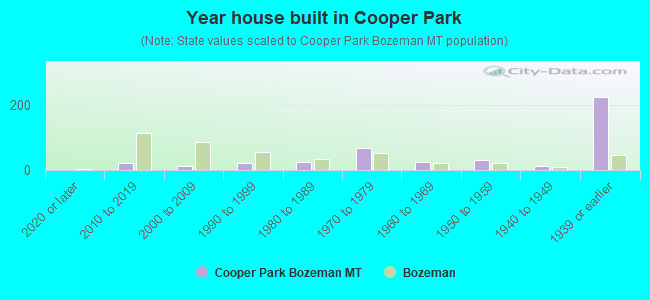
- Year house built in Cooper Park
- 12020 or later
- 222010 to 2019
- 122000 to 2009
- 231990 to 1999
- 241980 to 1989
- 691970 to 1979
- 241960 to 1969
- 311950 to 1959
- 131940 to 1949
- 2251939 or earlier
City-data.com crime index for city in 2020 (higher means more crime):
| City: | 160.5 |
| U.S. average: | 219.5 |
Travel time to work (commute)
![Travel time to work (commute)]()
- 23Less than 5 minutes
- 1245 to 9 minutes
- 6710 to 14 minutes
- 7715 to 19 minutes
- 3520 to 24 minutes
- 525 to 29 minutes
- 630 to 34 minutes
- 135 to 39 minutes
- 1145 to 59 minutes
- 1560 to 89 minutes
- 1690 or more minutes

Means of transportation to work
![Means of transportation to work]()
- 34.1%143Drove a car alone
- 14.5%61Carpooled
- 0.5%2Bus
- 0.2%1Motorcycle
- 10.5%44Bicycle
- 16.9%71Walked
- 11.0%46Other means
- 17.9%75Worked at home

Time leaving home to go to work
![Time leaving home to go to work]()
- 612:00 a.m. to 4:59 a.m.
- 65:00 a.m. to 5:29 a.m.
- 35:30 a.m. to 5:59 a.m.
- 56:00 a.m. to 6:29 a.m.
- 376:30 a.m. to 6:59 a.m.
- 217:00 a.m. to 7:29 a.m.
- 687:30 a.m. to 7:59 a.m.
- 568:00 a.m. to 8:29 a.m.
- 528:30 a.m. to 8:59 a.m.
- 489:00 a.m. to 9:59 a.m.
- 1110:00 a.m. to 10:59 a.m.
- 1011:00 a.m. to 11:59 a.m.
- 4512:00 p.m. to 3:59 p.m.
- 154:00 p.m. to 11:59 p.m.

Occupations of males:
- Percentage of males in management occupations (except farmers):
Here: 8.9% city: 14.6%
- Percentage of males in business and financial operations occupations:
Here: 3.6% city: 4.5%
- Percentage of males in computer and mathematical occupations:
Here: 3.4% city: 4.5%
- Percentage of males in architecture and engineering occupations:
Here: 8.9% city: 3.6%
- Percentage of males in life, physical, and social science occupations:
Here: 4.5% city: 3.2%
- Percentage of males in community and social services occupations:
Here: 11.1% city: 1.1%
- Percentage of males in education, training, and library occupations:
Here: 11.9% city: 6.7%
- Percentage of males in arts, design, entertainment, sports, and media occupations:
Here: 7.7% city: 4.9%
- Percentage of males in healthcare practitioners and technical occupations:
Here: 12.2% city: 3.5%
- Percentage of males in service occupations:
Here: 14.4% city: 13.7%
- Percentage of males in sales and office occupations:
Here: 2.7% city: 13.3%
- Percentage of males in farming, fishing, and forestry occupations:
Here: 1.3% city: 1.3%
- Percentage of males in construction, extraction, and maintenance occupations:
Here: 2.6% city: 8.9%
- Percentage of males in production occupations:
Here: 1.7% city: 5.8%
- Percentage of males in transportation occupations:
Here: 4.7% city: 2.1%
Occupations of females:
- Percentage of females in management occupations (except farmers):
Here: 12.9% city: 11.1%
- Percentage of females in business and financial operations occupations:
Here: 9.2% city: 4.5%
- Percentage of females in computer and mathematical occupations:
Here: 2.8% city: 2.6%
- Percentage of females in architecture and engineering occupations:
Here: 1.2% city: 1.2%
- Percentage of females in life, physical, and social science occupations:
Here: 4.4% city: 3.6%
- Percentage of females in community and social services occupations:
Here: 7.1% city: 1.9%
- Percentage of females in education, training, and library occupations:
Here: 14.5% city: 9.7%
- Percentage of females in arts, design, entertainment, sports, and media occupations:
Here: 1.8% city: 3.9%
- Percentage of females in healthcare practitioners and technical occupations:
Here: 3.5% city: 7.3%
- Percentage of females in service occupations:
Here: 19.9% city: 24.4%
- Percentage of females in sales and office occupations:
Here: 15.9% city: 22.1%
- Percentage of females in production occupations:
Here: 1.7% city: 2.9%
- Percentage of females in transportation occupations:
Here: 6.3% city: 0.6%
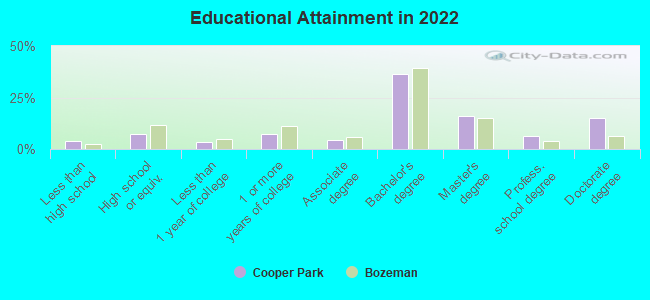
Education in this neighborhood (subdivision or community):
- Percentage of people 3 years and older in K-12 schools:
Cooper Park: 10.4% Bozeman: 9.9%
- Percentage of people 3 years and older in undergraduate colleges:
Cooper Park: 12.9% Bozeman: 20.9%
- Percentage of people 3 years and older in grad. or professional schools:
Cooper Park: 3.0% Bozeman: 4.4%
- Percentage of students K-12 enrolled in private schools:
Cooper Park: 0.0% Bozeman: 16.6%
Percentage of population below poverty level:
| Cooper Park: | 17.9% |
| Bozeman: | 14.7% |
Median year owner moved in (as recorded in 2022):
Median year renter moved in (as recorded in 2022):
| Cooper Park: | 2001 |
| Bozeman: | 2013 |
Median year renter moved in (as recorded in 2022):
| Cooper Park: | 2019 |
| Bozeman: | 2019 |
Percentage of married-couple families with both working:
| Cooper Park: | 56.0% |
| Bozeman: | 73.5% |
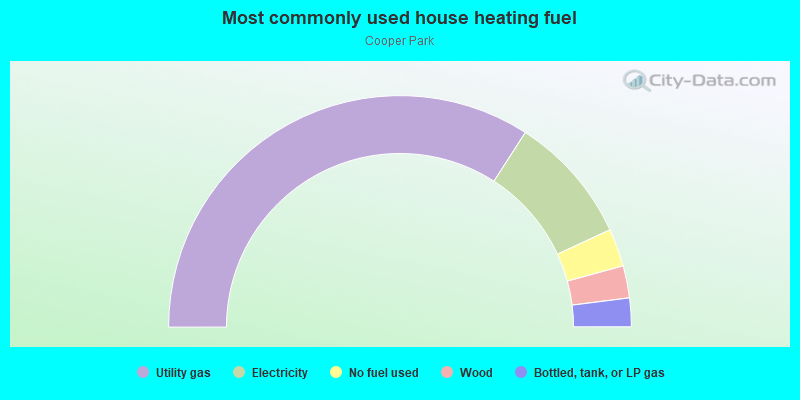
- 68.3%Utility gas
- 18.0%Electricity
- 5.3%No fuel used
- 4.5%Wood
- 4.0%Bottled, tank, or LP gas
Roads and streets:
S 6th Ave
Length: 0.49 miles
Direction: N-S
Address range: 100 to 799
Direction: N-S
Address range: 100 to 799
S 7th Ave
Length: 0.35 miles
Direction: N-S
Address range: 200 to 799
Direction: N-S
Address range: 200 to 799
S 5th Ave
Length: 0.34 miles
Direction: N-S
Address range: 200 to 699
Direction: N-S
Address range: 200 to 699
W Story St
Length: 0.33 miles
Direction: E-W
Address range: 500 to 849
Direction: E-W
Address range: 500 to 849
W Koch St
Length: 0.29 miles
Direction: E-W
Address range: 500 to 789
Direction: E-W
Address range: 500 to 789
W Dickerson St
Length: 0.29 miles
Direction: E-W
Address range: 500 to 791
Direction: E-W
Address range: 500 to 791
S 8th Ave
Length: 0.27 miles
Direction: N-S
Address range: 401 to 599
Direction: N-S
Address range: 401 to 599
W Alderson St
Length: 0.23 miles
Direction: E-W
Address range: 500 to 745
Direction: E-W
Address range: 500 to 745
W Curtiss St
Length: 0.23 miles
Direction: E-W
Address range: 500 to 745
Direction: E-W
Address range: 500 to 745
W Olive St
Length: 0.23 miles
Direction: E-W
Address range: 500 to 743
Direction: E-W
Address range: 500 to 743
W College St
Length: 0.13 miles
Direction: E-W
Address range: 600 to 743
Direction: E-W
Address range: 600 to 743
W Babcock St
Length: 0.05 miles
Direction: E-W
Address range: 546 to 599
Direction: E-W
Address range: 546 to 599