Darby Place neighborhood in Siloam Springs, Arkansas (AR), 72761 detailed profile
Settings
X

Business Search - 14 Million verified businesses
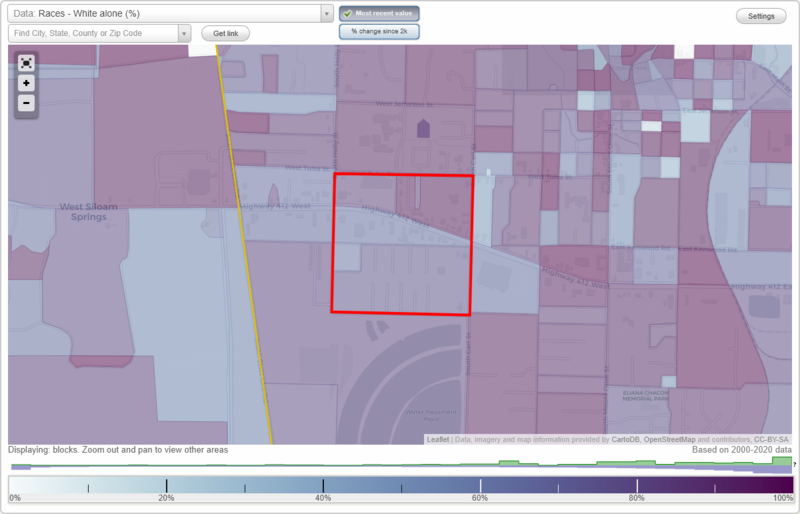
Area: 0.248 square miles
Population: 382
Population density:
| Darby Place: | 1,541 people per square mile |
| Siloam Springs: | 1,670 people per square mile |

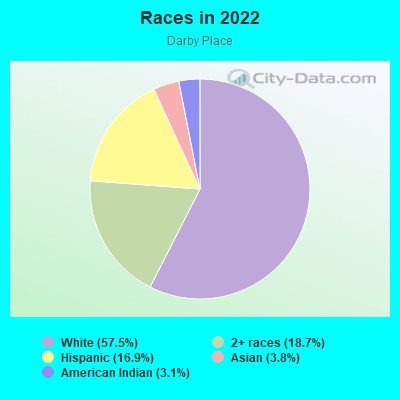
- 22557.5%White
- 7318.7%Two or more races
- 6616.9%Hispanic or Latino
- 153.8%Asian
- 123.1%American Indian
Median household income in 2022:
| Darby Place: | $45,365 |
| Siloam Springs: | $59,911 |
Distribution of median household income
![Distribution of median household income]()
- 16Less than $10,000
- 19$10,000 to $19,999
- 15$20,000 to $29,999
- 13$30,000 to $39,999
- 21$40,000 to $49,999
- 5$50,000 to $59,999
- 11$60,000 to $74,999
- 21$75,000 to $99,999
- 16$100,000 to $124,999
- 2$125,000 to $149,999
- 12$150,000 to $199,999
- 2$200,000 or more

Distribution of owner-occupied house/condo value
![Distribution of owner-occupied house/condo value]()
- 16Less than $50,000
- 30$50,000 to $99,999
- 20$100,000 to $149,999
- 21$150,000 to $199,999
- 16$200,000 to $249,999
- 2$250,000 to $299,999
- 7$300,000 to $399,999
- 1$500,000 to $749,999

Distribution of rent paid by renters
![Distribution of rent paid by renters]()
- 20$100 to $199
- 13$200 to $299
- 22$300 to $399
- 19$400 to $499
- 33$500 to $599
- 13$600 to $699
- 6$800 to $899
- 2$900 to $999
- 23$1,000 to $1,249

Median rent in 2022:
| Darby Place: | $587 |
| Siloam Springs: | $659 |
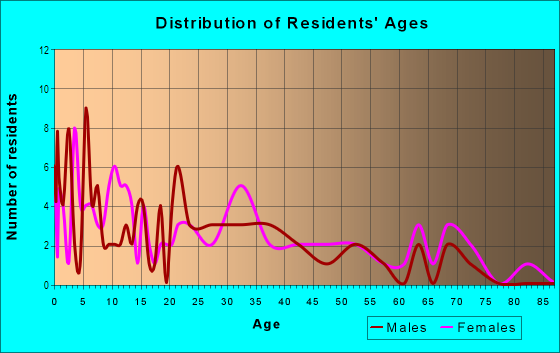
| Males: | 181 |
| Females: | 201 |
Males:
| This neighborhood: | 32.9 years |
| Whole city: | 29.8 years |
| This neighborhood: | 31.7 years |
| Whole city: | 30.3 years |
Average household size:
| Darby Place: | 2.8 people |
| Siloam Springs: | 2.8 people |
Percentage of family households:
| Darby Place: | 51.8% |
| Siloam Springs: | 59.8% |
| Here: | 52.1% |
| Siloam Springs: | 59.8% |
Percentage of married-couple families with children (among all households):
| Darby Place: | 27.4% |
| Siloam Springs: | 23.2% |
Percentage of single-mother households (among all households):
| Darby Place: | 6.3% |
| Siloam Springs: | 9.8% |
Percentage of never married males 15 years old and over:
Percentage of never married females 15 years old and over:
| Darby Place: | 15.8% |
| Siloam Springs: | 17.0% |
Percentage of never married females 15 years old and over:
| Darby Place: | 14.0% |
| city: | 16.5% |
Percentage of people that speak English not well or not at all:
| Darby Place: | 4.3% |
| Siloam Springs: | 6.0% |
Percentage of people born in this state:
Percentage of people born in another U.S. state:
Percentage of native residents but born outside the U.S.:
Percentage of foreign born residents:
| Here: | 47.8% |
| Siloam Springs: | 43.0% |
Percentage of people born in another U.S. state:
| Darby Place: | 39.1% |
| Siloam Springs: | 42.1% |
Percentage of native residents but born outside the U.S.:
| Here: | 3.5% |
| city: | 2.1% |
Percentage of foreign born residents:
| Here: | 9.6% |
| Siloam Springs: | 12.8% |
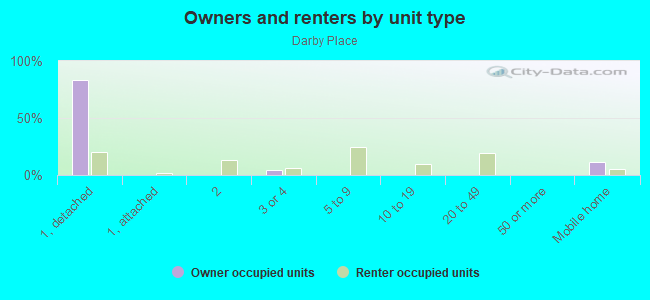
Owner-occupied
Renter-occupied

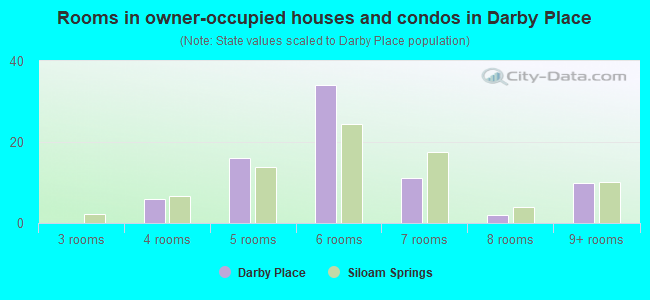
- Rooms in owner-occupied houses and condos in Darby Place
- 01 room
- 02 rooms
- 03 rooms
- 64 rooms
- 165 rooms
- 346 rooms
- 117 rooms
- 28 rooms
- 109+ rooms
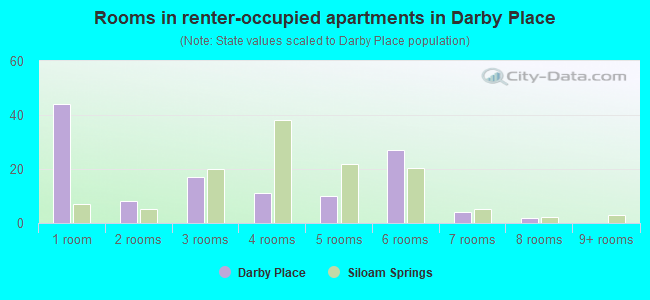
- Rooms in renter-occupied apartments in Darby Place
- 441 room
- 82 rooms
- 173 rooms
- 114 rooms
- 105 rooms
- 276 rooms
- 47 rooms
- 28 rooms
- 09+ rooms
Owner-occupied
Renter-occupied
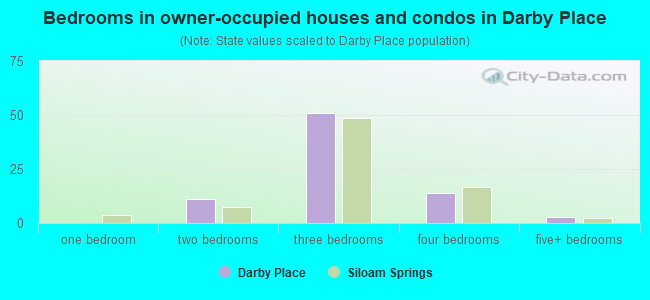
- Bedrooms in owner-occupied houses and condos in Darby Place
- 0no bedroom
- 01 bedroom
- 112 bedrooms
- 513 bedrooms
- 144 bedrooms
- 35+ bedrooms
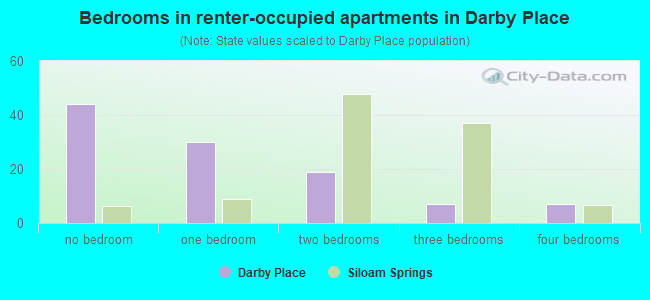
- Bedrooms in renter-occupied apartments in Darby Place
- 44no bedroom
- 301 bedroom
- 192 bedrooms
- 73 bedrooms
- 74 bedrooms
- 05+ bedrooms
Average number of cars or other vehicles available in houses/condos:
Average number of cars or other vehicles available in apartments:
| This neighborhood: | 2.3 |
| Siloam Springs: | 2.4 |
Average number of cars or other vehicles available in apartments:
| Here: | 1.0 |
| city: | 1.6 |
Percentage of units with a mortgage:
| Darby Place: | 58.4% |
| Siloam Springs: | 67.5% |
Housing prices:
- Average estimated value of detached houses in 2022 (64.9% of all units):
Darby Place: $169,722 Arkansas: $243,881
- Average estimated value of mobile home in 2022 (9.3% of all units):
Darby Place: $59,359 Arkansas: $79,566
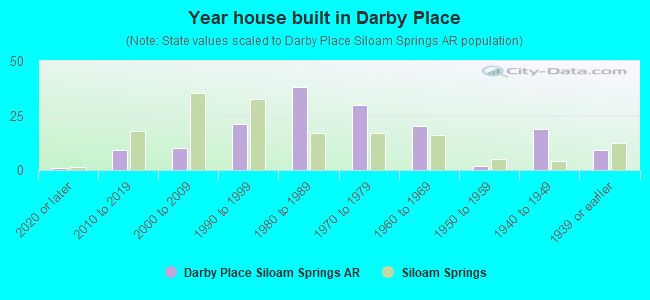
- Year house built in Darby Place
- 12020 or later
- 92010 to 2019
- 102000 to 2009
- 211990 to 1999
- 381980 to 1989
- 301970 to 1979
- 201960 to 1969
- 21950 to 1959
- 191940 to 1949
- 91939 or earlier
City-data.com crime index for city in 2020 (higher means more crime):
| City: | 299.7 |
| U.S. average: | 219.5 |
Travel time to work (commute)
![Travel time to work (commute)]()
- 22Less than 5 minutes
- 185 to 9 minutes
- 3610 to 14 minutes
- 915 to 19 minutes
- 2620 to 24 minutes
- 225 to 29 minutes
- 530 to 34 minutes
- 235 to 39 minutes
- 440 to 44 minutes
- 845 to 59 minutes
- 390 or more minutes

Means of transportation to work
![Means of transportation to work]()
- 79.5%118Drove a car alone
- 11.4%17Carpooled
- 4.0%6Bicycle
- 24.9%37Walked
- 20.9%31Worked at home

Time leaving home to go to work
![Time leaving home to go to work]()
- 1512:00 a.m. to 4:59 a.m.
- 125:00 a.m. to 5:29 a.m.
- 45:30 a.m. to 5:59 a.m.
- 96:00 a.m. to 6:29 a.m.
- 66:30 a.m. to 6:59 a.m.
- 337:00 a.m. to 7:29 a.m.
- 157:30 a.m. to 7:59 a.m.
- 58:00 a.m. to 8:29 a.m.
- 118:30 a.m. to 8:59 a.m.
- 99:00 a.m. to 9:59 a.m.
- 110:00 a.m. to 10:59 a.m.
- 612:00 p.m. to 3:59 p.m.
- 74:00 p.m. to 11:59 p.m.

Occupations of males:
- Percentage of males in management occupations (except farmers):
Here: 11.4% city: 7.2%
- Percentage of males in business and financial operations occupations:
Here: 1.8% city: 2.5%
- Percentage of males in computer and mathematical occupations:
Here: 1.2% city: 3.6%
- Percentage of males in architecture and engineering occupations:
Here: 5.3% city: 2.0%
- Percentage of males in education, training, and library occupations:
Here: 2.5% city: 3.5%
- Percentage of males in healthcare practitioners and technical occupations:
Here: 1.9% city: 2.0%
- Percentage of males in service occupations:
Here: 21.3% city: 16.1%
- Percentage of males in sales and office occupations:
Here: 10.4% city: 13.2%
- Percentage of males in construction, extraction, and maintenance occupations:
Here: 12.5% city: 11.9%
- Percentage of males in production occupations:
Here: 11.9% city: 14.8%
- Percentage of males in transportation occupations:
Here: 11.5% city: 5.6%
- Percentage of males in material moving occupations:
Here: 4.7% city: 7.9%
Occupations of females:
- Percentage of females in management occupations (except farmers):
Here: 1.9% city: 6.0%
- Percentage of females in business and financial operations occupations:
Here: 11.1% city: 3.7%
- Percentage of females in education, training, and library occupations:
Here: 14.9% city: 10.3%
- Percentage of females in healthcare practitioners and technical occupations:
Here: 3.6% city: 9.3%
- Percentage of females in service occupations:
Here: 8.4% city: 22.3%
- Percentage of females in sales and office occupations:
Here: 33.6% city: 27.6%
- Percentage of females in production occupations:
Here: 14.7% city: 12.7%
- Percentage of females in material moving occupations:
Here: 10.0% city: 2.0%
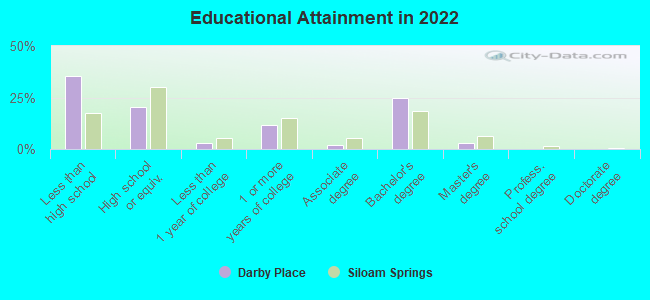
Education in this neighborhood (subdivision or community):
- Percentage of people 3 years and older in K-12 schools:
Darby Place: 18.5% Siloam Springs: 20.3%
- Percentage of people 3 years and older in undergraduate colleges:
Darby Place: 2.8% Siloam Springs: 9.4%
- Percentage of people 3 years and older in grad. or professional schools:
Darby Place: 0.0% Siloam Springs: 1.1%
- Percentage of students K-12 enrolled in private schools:
Darby Place: 18.2% Siloam Springs: 5.0%
Percentage of population below poverty level:
| Darby Place: | 17.7% |
| Siloam Springs: | 15.8% |
Median year owner moved in (as recorded in 2022):
Median year renter moved in (as recorded in 2022):
| Darby Place: | 2013 |
| Siloam Springs: | 2011 |
Median year renter moved in (as recorded in 2022):
| Darby Place: | 2018 |
| Siloam Springs: | 2018 |
Percentage of married-couple families with both working:
| Darby Place: | 66.2% |
| Siloam Springs: | 60.8% |
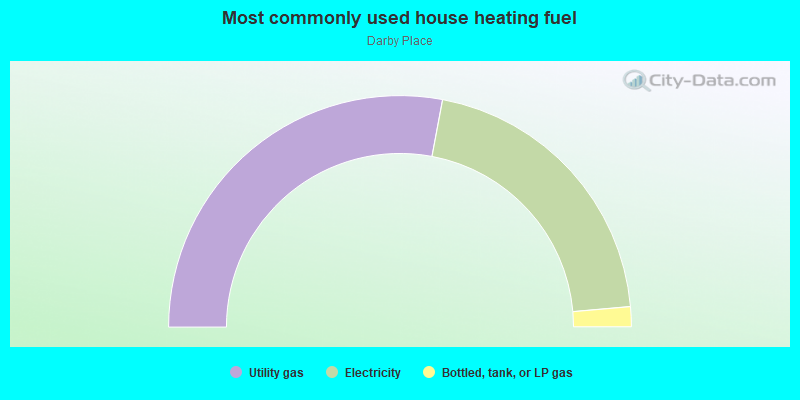
- 55.9%Utility gas
- 41.3%Electricity
- 2.8%Bottled, tank, or LP gas
Highways in this neighborhood:
Hwy 412 W (US Hwy 412)
Length: 0.35 miles
Direction: E-W
Direction: E-W
Roads and streets:
W Kenwood St
Length: 0.49 miles
Direction: E-W
Address range: 832 to 1555
Direction: E-W
Address range: 832 to 1555
S Carl St
Length: 0.26 miles
Direction: N-S
Address range: 1040 to 1699
Direction: N-S
Address range: 1040 to 1699
William Ct
Length: 0.11 miles
Direction: N-S
Address range: 1300 to 1699
Direction: N-S
Address range: 1300 to 1699
Courtney Ct
Length: 0.11 miles
Direction: N-S
Address range: 1300 to 1699
Direction: N-S
Address range: 1300 to 1699
Andrew Ct
Length: 0.11 miles
Direction: N-S
Address range: 1300 to 1699
Direction: N-S
Address range: 1300 to 1699
Hefton Ct
Length: 0.11 miles
Direction: N-S
Address range: 1300 to 1699
Direction: N-S
Address range: 1300 to 1699
S Dogwood St
Length: 0.10 miles
Direction: N-S
Address range: 1000 to 1507
Direction: N-S
Address range: 1000 to 1507
Jo Lynn St
Length: 0.10 miles
Direction: N-S
Address range: 1000 to 1512
Direction: N-S
Address range: 1000 to 1512
S Prospect St
Length: 0.10 miles
Direction: N-S
Address range: 1000 to 1512
Direction: N-S
Address range: 1000 to 1512
S Lyndale St
Length: 0.09 miles
Direction: N-S
Address range: 1000 to 1506
Direction: N-S
Address range: 1000 to 1506
W Quarter Rd
Length: 0.06 miles
Direction: E-W
Direction: E-W