Deer Run #2 (Deer Run Number 2) neighborhood in San Jose, California (CA), 95111, 95136 detailed profile
Settings
X

Business Search - 14 Million verified businesses
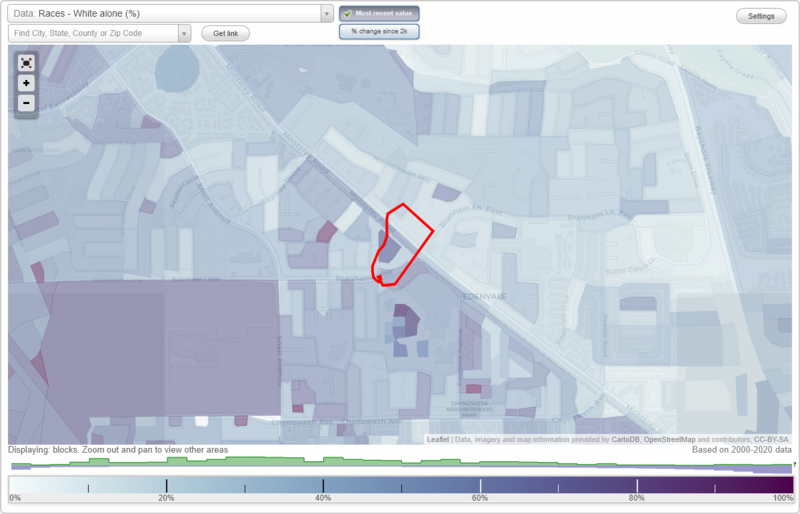
Area: 0.031 square miles
Population: 255
Population density:
| Deer Run #2 (Deer Run Number 2): | 8,318 people per square mile |
| San Jose: | 5,554 people per square mile |

- 9035.6%Asian
- 8935.2%White
- 3413.4%Hispanic or Latino
- 218.3%Two or more races
- 197.5%Black

Median household income in 2022:
| Deer Run #2 (Deer Run Number 2): | $155,904 |
| San Jose: | $133,835 |
Distribution of median household income
![Distribution of median household income]()
- 1Less than $10,000
- 5$10,000 to $19,999
- 6$20,000 to $29,999
- 6$30,000 to $39,999
- 4$50,000 to $59,999
- 4$60,000 to $74,999
- 4$75,000 to $99,999
- 19$100,000 to $124,999
- 10$125,000 to $149,999
- 15$150,000 to $199,999
- 31$200,000 or more

Distribution of owner-occupied house/condo value
![Distribution of owner-occupied house/condo value]()
- 5Less than $50,000
- 4$100,000 to $149,999
- 1$150,000 to $199,999
- 1$250,000 to $299,999
- 2$300,000 to $399,999
- 1$400,000 to $499,999
- 13$500,000 to $749,999
- 12$750,000 to $999,999
- 42$1,000,000 or more

Distribution of rent paid by renters
![Distribution of rent paid by renters]()
- 3$700 to $799
- 5$800 to $899
- 1$1,250 to $1,499
- 15$2,000 or more

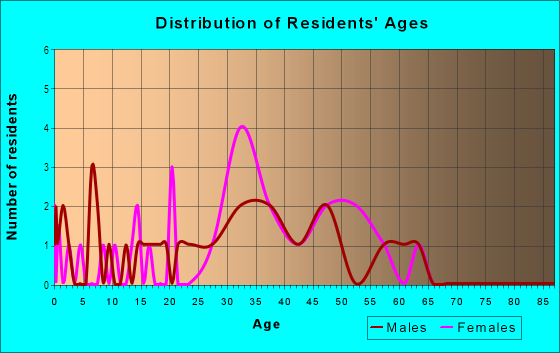
| Males: | 129 |
| Females: | 126 |
Males:
| This neighborhood: | 45.6 years |
| Whole city: | 37.6 years |
| This neighborhood: | 36.4 years |
| Whole city: | 39.1 years |
Average household size:
| Deer Run #2 (Deer Run Number 2): | 2.9 people |
| San Jose: | 2.9 people |
Percentage of family households:
| Deer Run #2 (Deer Run Number 2): | 51.8% |
| San Jose: | 49.9% |
| Here: | 65.1% |
| San Jose: | 53.0% |
Percentage of married-couple families with children (among all households):
| Deer Run #2 (Deer Run Number 2): | 33.9% |
| San Jose: | 25.8% |
Percentage of single-mother households (among all households):
| Deer Run #2 (Deer Run Number 2): | 1.3% |
| San Jose: | 5.2% |
Percentage of never married males 15 years old and over:
Percentage of never married females 15 years old and over:
| Deer Run #2 (Deer Run Number 2): | 19.3% |
| San Jose: | 20.9% |
Percentage of never married females 15 years old and over:
| Deer Run #2 (Deer Run Number 2): | 14.9% |
| city: | 16.7% |
Percentage of people that speak English not well or not at all:
| Deer Run #2 (Deer Run Number 2): | 9.0% |
| San Jose: | 11.4% |
Percentage of people born in this state:
Percentage of people born in another U.S. state:
Percentage of native residents but born outside the U.S.:
Percentage of foreign born residents:
| Here: | 46.9% |
| San Jose: | 46.1% |
Percentage of people born in another U.S. state:
| Deer Run #2 (Deer Run Number 2): | 11.3% |
| San Jose: | 10.4% |
Percentage of native residents but born outside the U.S.:
| Here: | 1.6% |
| city: | 1.7% |
Percentage of foreign born residents:
| Here: | 40.2% |
| San Jose: | 41.8% |

Owner-occupied
Renter-occupied


- Rooms in owner-occupied houses and condos in Deer Run #2 <
> - 01 room
- 02 rooms
- 23 rooms
- 114 rooms
- 135 rooms
- 46 rooms
- 157 rooms
- 168 rooms
- 129+ rooms

- Rooms in renter-occupied apartments in Deer Run #2 <
> - 01 room
- 02 rooms
- 03 rooms
- 44 rooms
- 85 rooms
- 136 rooms
- 17 rooms
- 08 rooms
- 49+ rooms
Owner-occupied
Renter-occupied

- Bedrooms in owner-occupied houses and condos in Deer Run #2 <
> - 0no bedroom
- 01 bedroom
- 142 bedrooms
- 193 bedrooms
- 374 bedrooms
- 75+ bedrooms

- Bedrooms in renter-occupied apartments in Deer Run #2 <
> - 0no bedroom
- 01 bedroom
- 52 bedrooms
- 63 bedrooms
- 94 bedrooms
- 05+ bedrooms
Average number of cars or other vehicles available in houses/condos:
Average number of cars or other vehicles available in apartments:
| This neighborhood: | 2.4 |
| San Jose: | 2.3 |
Average number of cars or other vehicles available in apartments:
| Here: | 2.4 |
| city: | 1.6 |
Percentage of units with a mortgage:
| Deer Run #2 (Deer Run Number 2): | 86.9% |
| San Jose: | 66.9% |
Housing prices:
- Average estimated value of detached houses in 2022 (65.2% of all units):
Deer Run #2 (Deer Run Number 2): $1,084,745 San Jose: $1,532,815
- Average estimated value of townhouses or other attached units in 2022 (29.3% of all units):
This neighborhood: $1,082,549 city: $1,024,857

- Year house built in Deer Run #2 <
> - 02020 or later
- 52010 to 2019
- 42000 to 2009
- 21990 to 1999
- 291980 to 1989
- 561970 to 1979
- 71960 to 1969
- 01950 to 1959
- 01940 to 1949
- 11939 or earlier

City-data.com crime index for city in 2020 (higher means more crime):
| City: | 268.4 |
| U.S. average: | 219.5 |
Travel time to work (commute)
![Travel time to work (commute)]()
- 45 to 9 minutes
- 810 to 14 minutes
- 615 to 19 minutes
- 1520 to 24 minutes
- 1725 to 29 minutes
- 1730 to 34 minutes
- 435 to 39 minutes
- 340 to 44 minutes
- 2345 to 59 minutes
- 660 to 89 minutes

Means of transportation to work
![Means of transportation to work]()
- 62.3%91Drove a car alone
- 24.0%35Carpooled
- 1.4%2Walked
- 25.3%37Worked at home

Time leaving home to go to work
![Time leaving home to go to work]()
- 412:00 a.m. to 4:59 a.m.
- 15:00 a.m. to 5:29 a.m.
- 45:30 a.m. to 5:59 a.m.
- 46:00 a.m. to 6:29 a.m.
- 166:30 a.m. to 6:59 a.m.
- 117:00 a.m. to 7:29 a.m.
- 117:30 a.m. to 7:59 a.m.
- 178:00 a.m. to 8:29 a.m.
- 88:30 a.m. to 8:59 a.m.
- 119:00 a.m. to 9:59 a.m.
- 110:00 a.m. to 10:59 a.m.
- 912:00 p.m. to 3:59 p.m.
- 44:00 p.m. to 11:59 p.m.

Occupations of males:
- Percentage of males in management occupations (except farmers):
Here: 15.8% city: 13.0%
- Percentage of males in business and financial operations occupations:
Here: 6.7% city: 4.6%
- Percentage of males in computer and mathematical occupations:
Here: 10.2% city: 13.6%
- Percentage of males in architecture and engineering occupations:
Here: 4.9% city: 10.2%
- Percentage of males in life, physical, and social science occupations:
Here: 1.1% city: 1.1%
- Percentage of males in community and social services occupations:
Here: 7.7% city: 0.8%
- Percentage of males in legal occupations:
Here: 3.0% city: 0.8%
- Percentage of males in education, training, and library occupations:
Here: 10.4% city: 2.8%
- Percentage of males in healthcare practitioners and technical occupations:
Here: 3.2% city: 2.0%
- Percentage of males in service occupations:
Here: 7.3% city: 12.7%
- Percentage of males in sales and office occupations:
Here: 17.9% city: 12.8%
- Percentage of males in production occupations:
Here: 7.9% city: 5.5%
- Percentage of males in transportation occupations:
Here: 7.2% city: 3.6%
Occupations of females:
- Percentage of females in management occupations (except farmers):
Here: 7.5% city: 11.0%
- Percentage of females in business and financial operations occupations:
Here: 16.1% city: 8.6%
- Percentage of females in computer and mathematical occupations:
Here: 6.7% city: 5.4%
- Percentage of females in life, physical, and social science occupations:
Here: 4.5% city: 1.7%
- Percentage of females in legal occupations:
Here: 1.5% city: 1.3%
- Percentage of females in education, training, and library occupations:
Here: 7.8% city: 8.1%
- Percentage of females in arts, design, entertainment, sports, and media occupations:
Here: 3.9% city: 2.0%
- Percentage of females in healthcare practitioners and technical occupations:
Here: 12.5% city: 6.8%
- Percentage of females in service occupations:
Here: 8.7% city: 21.7%
- Percentage of females in sales and office occupations:
Here: 27.7% city: 22.0%
- Percentage of females in production occupations:
Here: 1.2% city: 4.0%
- Percentage of females in material moving occupations:
Here: 1.8% city: 1.5%
Education in this neighborhood (subdivision or community):
- Percentage of people 3 years and older in K-12 schools:
Deer Run #2 (Deer Run Number 2): 10.6% San Jose: 16.1%
- Percentage of people 3 years and older in undergraduate colleges:
Deer Run #2 (Deer Run Number 2): 4.7% San Jose: 6.5%
- Percentage of people 3 years and older in grad. or professional schools:
Deer Run #2 (Deer Run Number 2): 5.1% San Jose: 2.0%
- Percentage of students K-12 enrolled in private schools:
Deer Run #2 (Deer Run Number 2): 14.8% San Jose: 14.9%
Percentage of population below poverty level:
| Deer Run #2 (Deer Run Number 2): | 4.6% |
| San Jose: | 9.0% |
Median year owner moved in (as recorded in 2022):
| Deer Run #2 (Deer Run Number 2): | 2011 |
| San Jose: | 2008 |
Percentage of married-couple families with both working:
| Deer Run #2 (Deer Run Number 2): | 43.3% |
| San Jose: | 72.5% |

- 71.0%Utility gas
- 26.5%Electricity
- 2.4%Bottled, tank, or LP gas
Highways in this neighborhood:
Monterey Hwy (State Hwy 82)
Length: 0.20 miles
Direction: SE-NW
Address range: 4636 to 4799
Direction: SE-NW
Address range: 4636 to 4799
Roads and streets:
Frontier Trail Dr
Length: 0.13 miles
Directions: E-W, SW-NE
Address range: 1 to 99
Directions: E-W, SW-NE
Address range: 1 to 99
Deer Run Cir
Length: 0.09 miles
Directions: N-S, SE-NW, SW-NE
Address range: 63 to 83
Directions: N-S, SE-NW, SW-NE
Address range: 63 to 83
Branham Ln E
Length: 0.06 miles
Direction: SW-NE
Direction: SW-NE
Canyon Trail Way
Length: 0.04 miles
Direction: SE-NW
Direction: SE-NW
Trail Run Ct
Length: 0.03 miles
Direction: SE-NW
Direction: SE-NW
Archbow Ct
Length: 0.03 miles
Direction: SE-NW
Address range: 4700 to 4799
Direction: SE-NW
Address range: 4700 to 4799
River Trail Ct ()
Length: 0.03 miles
Direction: SE-NW
Address range: 4800 to 4899
Direction: SE-NW
Address range: 4800 to 4899
Raindance Ct
Length: 0.02 miles
Direction: SW-NE
Address range: 1 to 99
Direction: SW-NE
Address range: 1 to 99
Saddle Brook Rd
Length: 0.02 miles
Direction: E-W
Address range: 2 to 98
Direction: E-W
Address range: 2 to 98