Downtown Birmingham (Downtown) neighborhood in Birmingham, Michigan (MI), 48009 detailed profile
Settings
X

Business Search - 14 Million verified businesses
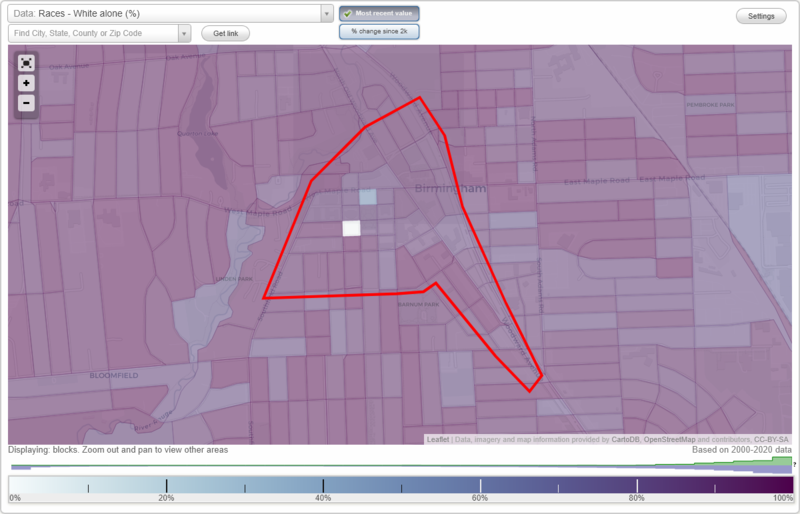
Area: 0.347 square miles
Population: 1,799
Population density:
| Downtown Birmingham (Downtown): | 5,189 people per square mile |
| Birmingham: | 4,551 people per square mile |

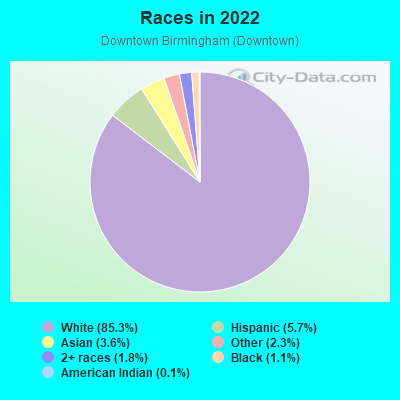
- 1,60485.3%White
- 1085.7%Hispanic or Latino
- 683.6%Asian
- 442.3%Some other race
- 341.8%Two or more races
- 201.1%Black
- 20.1%American Indian
Median household income in 2022:
| Downtown Birmingham (Downtown): | $184,762 |
| Birmingham: | $151,556 |
Distribution of median household income
![Distribution of median household income]()
- 12Less than $10,000
- 50$10,000 to $19,999
- 57$20,000 to $29,999
- 87$30,000 to $39,999
- 90$40,000 to $49,999
- 40$50,000 to $59,999
- 39$60,000 to $74,999
- 45$75,000 to $99,999
- 52$100,000 to $124,999
- 37$125,000 to $149,999
- 70$150,000 to $199,999
- 447$200,000 or more

Distribution of owner-occupied house/condo value
![Distribution of owner-occupied house/condo value]()
- 86Less than $50,000
- 13$50,000 to $99,999
- 53$100,000 to $149,999
- 53$150,000 to $199,999
- 31$200,000 to $249,999
- 19$250,000 to $299,999
- 55$300,000 to $399,999
- 28$400,000 to $499,999
- 129$500,000 to $749,999
- 124$750,000 to $999,999
- 308$1,000,000 or more

Distribution of rent paid by renters
![Distribution of rent paid by renters]()
- 21$200 to $299
- 25$500 to $599
- 40$600 to $699
- 105$700 to $799
- 8$900 to $999
- 53$1,000 to $1,249
- 50$1,250 to $1,499
- 53$1,500 to $1,999
- 132$2,000 or more

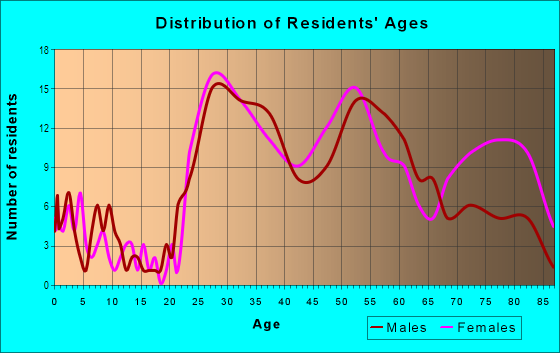
| Males: | 912 |
| Females: | 887 |
Males:
| This neighborhood: | 41.7 years |
| Whole city: | 41.0 years |
| This neighborhood: | 48.6 years |
| Whole city: | 43.2 years |
Average household size:
| Downtown Birmingham (Downtown): | 12.4 people |
| Birmingham: | 2.3 people |
Percentage of family households:
| Downtown Birmingham (Downtown): | 32.7% |
| Birmingham: | 43.8% |
| Here: | 49.7% |
| Birmingham: | 50.8% |
Percentage of married-couple families with children (among all households):
| Downtown Birmingham (Downtown): | 42.4% |
| Birmingham: | 35.7% |
Percentage of single-mother households (among all households):
| Downtown Birmingham (Downtown): | 26.3% |
| Birmingham: | 5.2% |
Percentage of never married males 15 years old and over:
Percentage of never married females 15 years old and over:
| Downtown Birmingham (Downtown): | 11.7% |
| Birmingham: | 12.6% |
Percentage of never married females 15 years old and over:
| Downtown Birmingham (Downtown): | 11.7% |
| city: | 13.4% |
Percentage of people that speak English not well or not at all:
| Downtown Birmingham (Downtown): | 0.1% |
| Birmingham: | 0.2% |
Percentage of people born in this state:
Percentage of people born in another U.S. state:
Percentage of native residents but born outside the U.S.:
Percentage of foreign born residents:
| Here: | 63.6% |
| Birmingham: | 65.9% |
Percentage of people born in another U.S. state:
| Downtown Birmingham (Downtown): | 24.0% |
| Birmingham: | 21.8% |
Percentage of native residents but born outside the U.S.:
| Here: | 1.5% |
| city: | 1.5% |
Percentage of foreign born residents:
| Here: | 10.9% |
| Birmingham: | 10.8% |
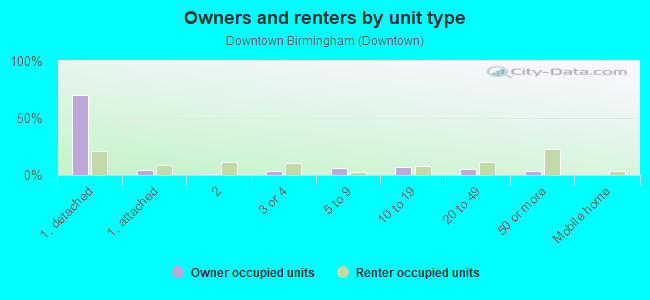
Owner-occupied
Renter-occupied

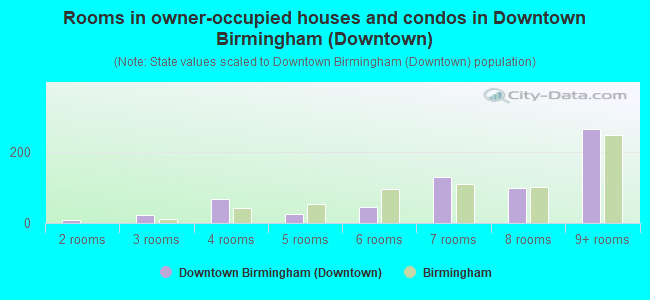
- Rooms in owner-occupied houses and condos in Downtown Birmingham <
> - 01 room
- 92 rooms
- 213 rooms
- 664 rooms
- 265 rooms
- 446 rooms
- 1307 rooms
- 998 rooms
- 2639+ rooms
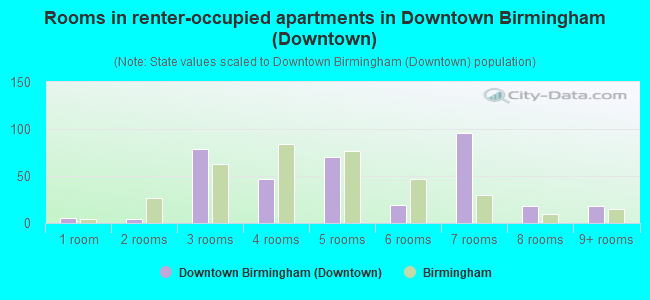
- Rooms in renter-occupied apartments in Downtown Birmingham <
> - 51 room
- 42 rooms
- 793 rooms
- 474 rooms
- 705 rooms
- 196 rooms
- 967 rooms
- 188 rooms
- 189+ rooms
Owner-occupied
Renter-occupied
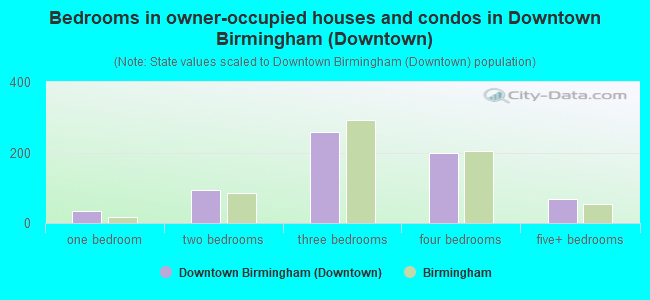
- Bedrooms in owner-occupied houses and condos in Downtown Birmingham <
> - 0no bedroom
- 341 bedroom
- 932 bedrooms
- 2593 bedrooms
- 1994 bedrooms
- 675+ bedrooms
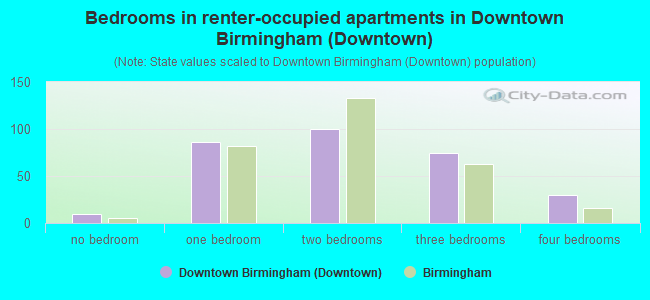
- Bedrooms in renter-occupied apartments in Downtown Birmingham <
> - 10no bedroom
- 861 bedroom
- 1002 bedrooms
- 743 bedrooms
- 304 bedrooms
- 05+ bedrooms
Average number of cars or other vehicles available in houses/condos:
Average number of cars or other vehicles available in apartments:
| This neighborhood: | 1.9 |
| Birmingham: | 1.9 |
Average number of cars or other vehicles available in apartments:
| Here: | 1.1 |
| city: | 1.2 |
Percentage of units with a mortgage:
| Downtown Birmingham (Downtown): | 66.3% |
| Birmingham: | 69.3% |
Average estimated value of detached houses in 2022 (63.0% of all units):
| Downtown Birmingham (Downtown): | $1,180,022 |
| Michigan: | $280,038 |
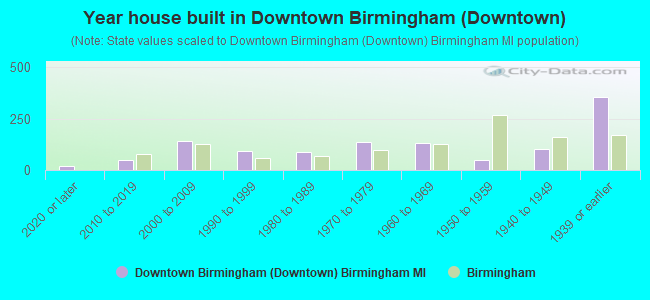
- Year house built in Downtown Birmingham <
> - 192020 or later
- 472010 to 2019
- 1412000 to 2009
- 901990 to 1999
- 891980 to 1989
- 1361970 to 1979
- 1311960 to 1969
- 471950 to 1959
- 1041940 to 1949
- 3531939 or earlier
City-data.com crime index for city in 2020 (higher means more crime):
| City: | 27.8 |
| U.S. average: | 219.5 |
Travel time to work (commute)
![Travel time to work (commute)]()
- 41Less than 5 minutes
- 785 to 9 minutes
- 8710 to 14 minutes
- 9515 to 19 minutes
- 9920 to 24 minutes
- 6725 to 29 minutes
- 8730 to 34 minutes
- 5335 to 39 minutes
- 3840 to 44 minutes
- 2845 to 59 minutes
- 1860 to 89 minutes
- 990 or more minutes

Means of transportation to work
![Means of transportation to work]()
- 66.5%647Drove a car alone
- 9.0%88Carpooled
- 3.5%34Bicycle
- 3.5%34Walked
- 0.9%9Other means
- 27.0%263Worked at home

Time leaving home to go to work
![Time leaving home to go to work]()
- 912:00 a.m. to 4:59 a.m.
- 145:00 a.m. to 5:29 a.m.
- 275:30 a.m. to 5:59 a.m.
- 206:00 a.m. to 6:29 a.m.
- 426:30 a.m. to 6:59 a.m.
- 1147:00 a.m. to 7:29 a.m.
- 1017:30 a.m. to 7:59 a.m.
- 908:00 a.m. to 8:29 a.m.
- 418:30 a.m. to 8:59 a.m.
- 1169:00 a.m. to 9:59 a.m.
- 1710:00 a.m. to 10:59 a.m.
- 6911:00 a.m. to 11:59 a.m.
- 3912:00 p.m. to 3:59 p.m.
- 164:00 p.m. to 11:59 p.m.

Occupations of males:
- Percentage of males in management occupations (except farmers):
Here: 31.6% city: 28.7%
- Percentage of males in business and financial operations occupations:
Here: 6.8% city: 10.2%
- Percentage of males in architecture and engineering occupations:
Here: 5.6% city: 6.7%
- Percentage of males in life, physical, and social science occupations:
Here: 1.3% city: 0.6%
- Percentage of males in legal occupations:
Here: 10.7% city: 9.5%
- Percentage of males in education, training, and library occupations:
Here: 3.9% city: 2.3%
- Percentage of males in arts, design, entertainment, sports, and media occupations:
Here: 1.2% city: 2.5%
- Percentage of males in healthcare practitioners and technical occupations:
Here: 13.3% city: 7.4%
- Percentage of males in service occupations:
Here: 6.2% city: 6.1%
- Percentage of males in sales and office occupations:
Here: 6.3% city: 14.1%
- Percentage of males in construction, extraction, and maintenance occupations:
Here: 1.7% city: 3.4%
- Percentage of males in production occupations:
Here: 3.8% city: 2.0%
- Percentage of males in transportation occupations:
Here: 5.8% city: 1.4%
Occupations of females:
- Percentage of females in management occupations (except farmers):
Here: 18.8% city: 17.0%
- Percentage of females in business and financial operations occupations:
Here: 7.4% city: 12.9%
- Percentage of females in community and social services occupations:
Here: 2.4% city: 2.7%
- Percentage of females in legal occupations:
Here: 7.6% city: 6.0%
- Percentage of females in education, training, and library occupations:
Here: 2.3% city: 5.7%
- Percentage of females in arts, design, entertainment, sports, and media occupations:
Here: 2.4% city: 3.0%
- Percentage of females in healthcare practitioners and technical occupations:
Here: 13.6% city: 13.7%
- Percentage of females in service occupations:
Here: 6.5% city: 13.1%
- Percentage of females in sales and office occupations:
Here: 33.4% city: 19.7%
- Percentage of females in production occupations:
Here: 4.3% city: 0.9%
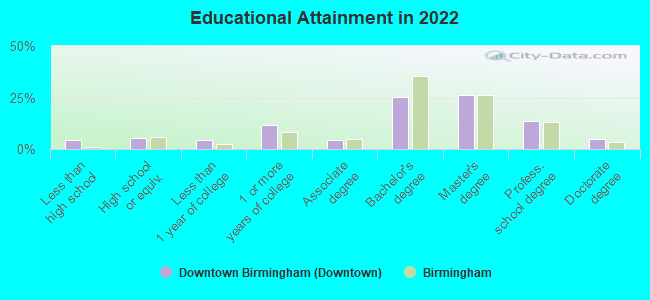
Education in this neighborhood (subdivision or community):
- Percentage of people 3 years and older in K-12 schools:
Downtown Birmingham (Downtown): 12.9% Birmingham: 20.3%
- Percentage of people 3 years and older in undergraduate colleges:
Downtown Birmingham (Downtown): 3.3% Birmingham: 1.7%
- Percentage of people 3 years and older in grad. or professional schools:
Downtown Birmingham (Downtown): 3.5% Birmingham: 1.1%
- Percentage of students K-12 enrolled in private schools:
Downtown Birmingham (Downtown): 45.5% Birmingham: 22.5%
Percentage of population below poverty level:
| Downtown Birmingham (Downtown): | 3.7% |
| Birmingham: | 5.5% |
Median year owner moved in (as recorded in 2022):
| Downtown Birmingham (Downtown): | 2011 |
| Birmingham: | 2009 |
Percentage of married-couple families with both working:
| Downtown Birmingham (Downtown): | 91.5% |
| Birmingham: | 71.9% |
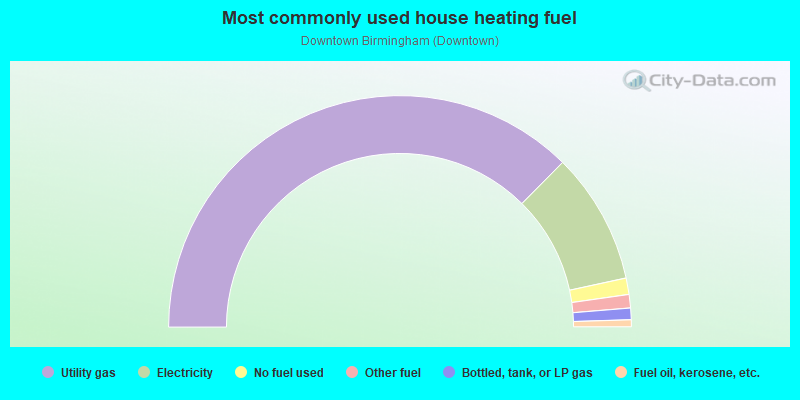
- 74.9%Utility gas
- 18.4%Electricity
- 2.3%No fuel used
- 1.9%Other fuel
- 1.6%Bottled, tank, or LP gas
- 1.0%Fuel oil, kerosene, etc.
Highways in this neighborhood:
State Hwy 10 (S Hunter Blvd, Woodward Ave)
Length: 1.25 miles
Direction: SE-NW
Address range: 100 to 34798
Direction: SE-NW
Address range: 100 to 34798
S Woodward Ave (S Old Woodward Ave, State Hwy 1)
Length: 0.79 miles
Direction: SE-NW
Address range: 100 to 899
Direction: SE-NW
Address range: 100 to 899
State Hwy 10 (N Hunter Blvd, Woodward Ave)
Length: 0.47 miles
Direction: SE-NW
Address range: 101 to 299
Direction: SE-NW
Address range: 101 to 299
State Hwy 1 (N Old Woodward Ave, N Woodward Ave)
Length: 0.26 miles
Direction: SE-NW
Address range: 100 to 373
Direction: SE-NW
Address range: 100 to 373
State Hwy 10 (Woodward Ave)
Length: 0.07 miles
Direction: SE-NW
Direction: SE-NW
Roads and streets:
W Frank St
Length: 0.49 miles
Direction: E-W
Address range: 100 to 799
Direction: E-W
Address range: 100 to 799
W Brown St
Length: 0.47 miles
Direction: E-W
Address range: 100 to 699
Direction: E-W
Address range: 100 to 699
W Maple Rd
Length: 0.45 miles
Direction: E-W
Address range: 1 to 599
Direction: E-W
Address range: 1 to 599
Townsend St
Length: 0.44 miles
Direction: E-W
Address range: 100 to 699
Direction: E-W
Address range: 100 to 699
Ann St
Length: 0.42 miles
Direction: SE-NW
Address range: 500 to 1099
Direction: SE-NW
Address range: 500 to 1099
W Merrill St
Length: 0.41 miles
Direction: E-W
Address range: 100 to 599
Direction: E-W
Address range: 100 to 599
Southfield Rd
Length: 0.39 miles
Direction: SW-NE
Address range: 100 to 698
Direction: SW-NE
Address range: 100 to 698
Martin St
Length: 0.38 miles
Direction: E-W
Address range: 100 to 599
Direction: E-W
Address range: 100 to 599
Pierce St
Length: 0.33 miles
Direction: N-S
Address range: 100 to 699
Direction: N-S
Address range: 100 to 699
Henrietta St
Length: 0.33 miles
Direction: N-S
Address range: 100 to 699
Direction: N-S
Address range: 100 to 699
S Bates St
Length: 0.33 miles
Direction: N-S
Address range: 100 to 715
Direction: N-S
Address range: 100 to 715
Chester St
Length: 0.32 miles
Direction: N-S
Address range: 100 to 699
Direction: N-S
Address range: 100 to 699
E Frank St
Length: 0.26 miles
Directions: E-W, SW-NE
Address range: 100 to 499
Directions: E-W, SW-NE
Address range: 100 to 499
Oakland Ave
Length: 0.22 miles
Directions: E-W, SW-NE
Address range: 100 to 522
Directions: E-W, SW-NE
Address range: 100 to 522
Willits St
Length: 0.21 miles
Directions: E-W, SW-NE
Address range: 100 to 498
Directions: E-W, SW-NE
Address range: 100 to 498
E Brown St
Length: 0.18 miles
Directions: E-W, SW-NE
Address range: 100 to 399
Directions: E-W, SW-NE
Address range: 100 to 399
Park St
Length: 0.18 miles
Directions: N-S, SE-NW
Address range: 200 to 399
Directions: N-S, SE-NW
Address range: 200 to 399
Hamilton Row
Length: 0.17 miles
Direction: E-W
Address range: 100 to 499
Direction: E-W
Address range: 100 to 499
E Maple Rd
Length: 0.16 miles
Direction: E-W
Address range: 100 to 350
Direction: E-W
Address range: 100 to 350
Purdy St
Length: 0.16 miles
Direction: SE-NW
Address range: 500 to 699
Direction: SE-NW
Address range: 500 to 699
Daines St
Length: 0.14 miles
Direction: E-W
Address range: 200 to 399
Direction: E-W
Address range: 200 to 399
Watkins St
Length: 0.13 miles
Direction: N-S
Address range: 500 to 699
Direction: N-S
Address range: 500 to 699
Stanley Blvd
Length: 0.13 miles
Direction: N-S
Address range: 500 to 699
Direction: N-S
Address range: 500 to 699
E Lincoln St
Length: 0.12 miles
Direction: E-W
Address range: 800 to 999
Direction: E-W
Address range: 800 to 999
Forest Ave
Length: 0.12 miles
Directions: E-W, SW-NE
Address range: 400 to 599
Directions: E-W, SW-NE
Address range: 400 to 599
E Merrill St
Length: 0.12 miles
Directions: E-W, SW-NE
Address range: 100 to 299
Directions: E-W, SW-NE
Address range: 100 to 299
Peabody St
Length: 0.11 miles
Directions: N-S, SE-NW, SW-NE
Address range: 100 to 299
Directions: N-S, SE-NW, SW-NE
Address range: 100 to 299
N Bates St
Length: 0.10 miles
Direction: N-S
Address range: 100 to 299
Direction: N-S
Address range: 100 to 299
Ferndale Ave
Length: 0.08 miles
Directions: N-S, SE-NW
Address range: 200 to 299
Directions: N-S, SE-NW
Address range: 200 to 299
Cherry Ct
Length: 0.08 miles
Direction: N-S
Address range: 546 to 652
Direction: N-S
Address range: 546 to 652
Bowers St
Length: 0.08 miles
Directions: E-W, SW-NE
Address range: 700 to 733
Directions: E-W, SW-NE
Address range: 700 to 733
George St
Length: 0.07 miles
Direction: SW-NE
Address range: 600 to 699
Direction: SW-NE
Address range: 600 to 699
Hazel St
Length: 0.07 miles
Directions: E-W, SW-NE
Address range: 500 to 699
Directions: E-W, SW-NE
Address range: 500 to 699
Haynes St
Length: 0.07 miles
Directions: E-W, SW-NE
Address range: 700 to 798
Directions: E-W, SW-NE
Address range: 700 to 798
Warren Ct
Length: 0.07 miles
Directions: E-W, N-S, SE-NW
Address range: 200 to 499
Directions: E-W, N-S, SE-NW
Address range: 200 to 499
N Chester St
Length: 0.07 miles
Directions: E-W, N-S, SW-NE
Address range: 100 to 299
Directions: E-W, N-S, SW-NE
Address range: 100 to 299
Landon St
Length: 0.07 miles
Directions: E-W, SW-NE
Address range: 700 to 799
Directions: E-W, SW-NE
Address range: 700 to 799
Lawndale St
Length: 0.06 miles
Directions: N-S, SW-NE
Address range: 300 to 389
Directions: N-S, SW-NE
Address range: 300 to 389
Hamilton Rd
Length: 0.04 miles
Directions: E-W, SW-NE
Address range: 100 to 176
Directions: E-W, SW-NE
Address range: 100 to 176
Madison St
Length: 0.03 miles
Direction: E-W
Address range: 400 to 439
Direction: E-W
Address range: 400 to 439
Euclid Ave
Length: 0.03 miles
Direction: SW-NE
Direction: SW-NE
Frank St (E Frank St)
Length: 0.02 miles
Direction: SW-NE
Direction: SW-NE
S Worth St (Worth St)
Length: 0.02 miles
Direction: N-S
Direction: N-S