Downtown Nutley (Downtown) neighborhood in Nutley, New Jersey (NJ), 07110 detailed profile
Settings
X

Business Search - 14 Million verified businesses
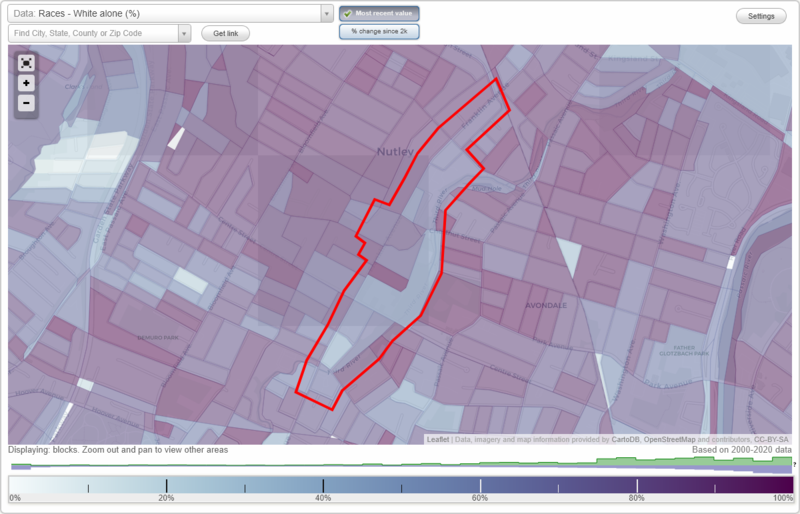
Area: 0.242 square miles
Population: 2,139
Population density:
| Downtown Nutley (Downtown): | 8,837 people per square mile |
| Nutley: | 8,123 people per square mile |

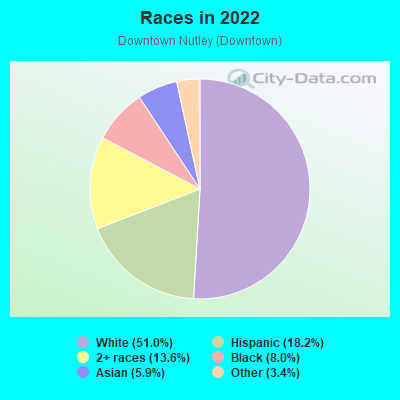
- 1,28251.0%White
- 45618.2%Hispanic or Latino
- 34113.6%Two or more races
- 2008.0%Black
- 1475.9%Asian
- 863.4%Some other race
Median household income in 2022:
| Downtown Nutley (Downtown): | $121,623 |
| New Jersey: | $96,346 |
Distribution of median household income
![Distribution of median household income]()
- 36Less than $10,000
- 119$10,000 to $19,999
- 188$20,000 to $29,999
- 58$30,000 to $39,999
- 216$40,000 to $49,999
- 66$50,000 to $59,999
- 110$60,000 to $74,999
- 110$75,000 to $99,999
- 148$100,000 to $124,999
- 59$125,000 to $149,999
- 172$150,000 to $199,999
- 139$200,000 or more

Distribution of owner-occupied house/condo value
![Distribution of owner-occupied house/condo value]()
- 67Less than $50,000
- 47$50,000 to $99,999
- 28$200,000 to $249,999
- 46$250,000 to $299,999
- 95$300,000 to $399,999
- 145$400,000 to $499,999
- 146$500,000 to $749,999
- 31$750,000 to $999,999
- 57$1,000,000 or more

Distribution of rent paid by renters
![Distribution of rent paid by renters]()
- 62$200 to $299
- 85$400 to $499
- 183$500 to $599
- 27$800 to $899
- 84$900 to $999
- 52$1,000 to $1,249
- 203$1,250 to $1,499
- 144$1,500 to $1,999
- 151$2,000 or more

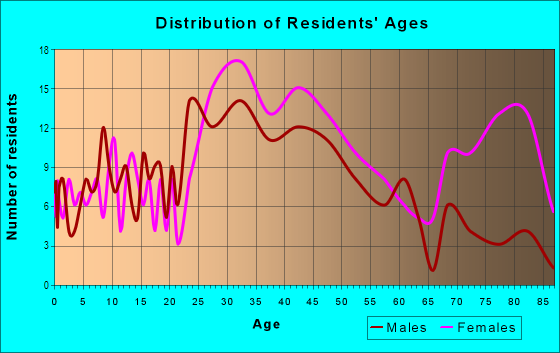
| Males: | 1,029 |
| Females: | 1,109 |
| Males: | 40.8 years |
| Females: | 43.9 years |
Average household size:
| Downtown Nutley (Downtown): | 2.5 people |
| New Jersey: | 2.6 people |
Percentage of family households:
| Downtown Nutley (Downtown): | 48.3% |
| New Jersey: | 47.0% |
| Here: | 45.1% |
| New Jersey: | 49.9% |
Percentage of married-couple families with children (among all households):
| Downtown Nutley (Downtown): | 37.3% |
| New Jersey: | 51.5% |
Percentage of single-mother households (among all households):
| Downtown Nutley (Downtown): | 10.4% |
| New Jersey: | 7.6% |
Percentage of never married males 15 years old and over:
Percentage of never married females 15 years old and over:
| Downtown Nutley (Downtown): | 18.2% |
| New Jersey: | 18.2% |
Percentage of never married females 15 years old and over:
| Downtown Nutley (Downtown): | 17.2% |
| New Jersey: | 16.6% |
Percentage of people that speak English not well or not at all:
| Downtown Nutley (Downtown): | 2.5% |
| New Jersey: | 6.5% |
Percentage of people born in this state:
Percentage of people born in another U.S. state:
Percentage of native residents but born outside the U.S.:
Percentage of foreign born residents:
| Here: | 60.1% |
| New Jersey: | 50.7% |
Percentage of people born in another U.S. state:
| Downtown Nutley (Downtown): | 13.5% |
| New Jersey: | 23.4% |
Percentage of native residents but born outside the U.S.:
| Here: | 2.1% |
| New Jersey: | 2.4% |
Percentage of foreign born residents:
| Here: | 24.3% |
| New Jersey: | 23.5% |
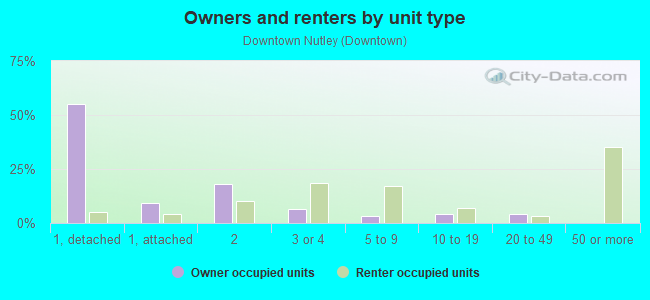
Owner-occupied
Renter-occupied

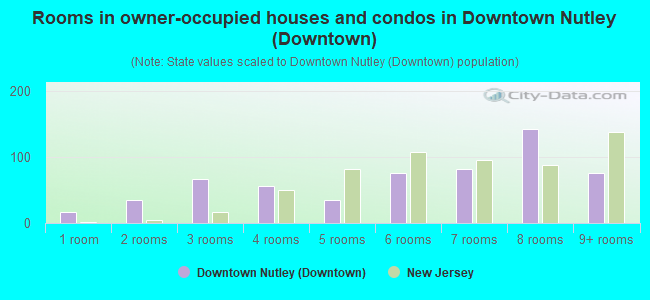
- Rooms in owner-occupied houses and condos in Downtown Nutley <
> - 161 room
- 342 rooms
- 673 rooms
- 564 rooms
- 345 rooms
- 756 rooms
- 827 rooms
- 1428 rooms
- 769+ rooms
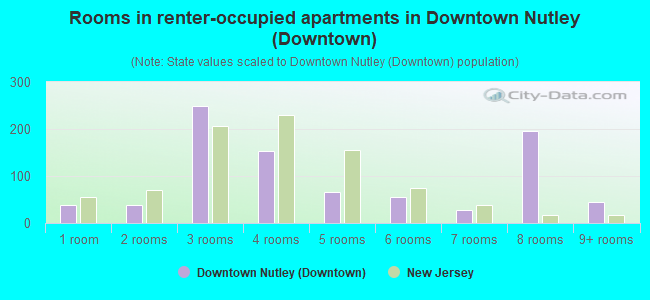
- Rooms in renter-occupied apartments in Downtown Nutley <
> - 391 room
- 382 rooms
- 2493 rooms
- 1534 rooms
- 665 rooms
- 556 rooms
- 277 rooms
- 1968 rooms
- 459+ rooms
Owner-occupied
Renter-occupied
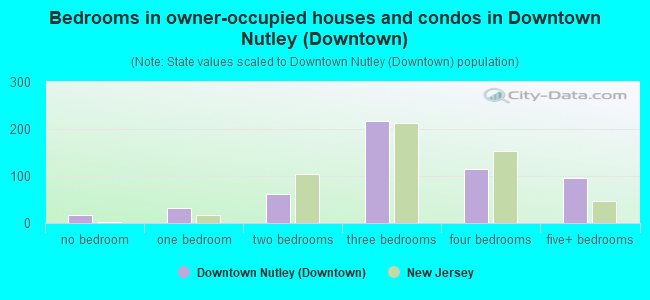
- Bedrooms in owner-occupied houses and condos in Downtown Nutley <
> - 16no bedroom
- 321 bedroom
- 612 bedrooms
- 2163 bedrooms
- 1144 bedrooms
- 965+ bedrooms
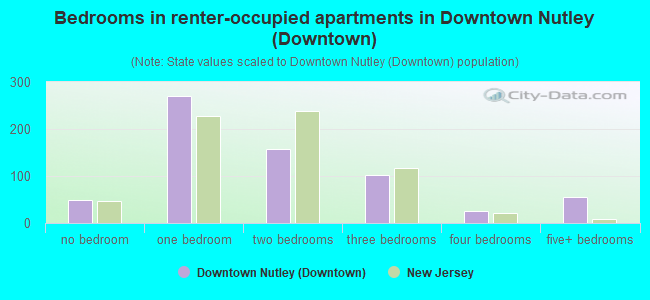
- Bedrooms in renter-occupied apartments in Downtown Nutley <
> - 48no bedroom
- 2701 bedroom
- 1582 bedrooms
- 1033 bedrooms
- 254 bedrooms
- 565+ bedrooms
Average number of cars or other vehicles available in houses/condos:
Average number of cars or other vehicles available in apartments:
| This neighborhood: | 1.8 |
| New Jersey: | 2.0 |
Average number of cars or other vehicles available in apartments:
| Here: | 1.2 |
| New Jersey: | 1.1 |
Percentage of units with a mortgage:
| Downtown Nutley (Downtown): | 69.5% |
| New Jersey: | 63.3% |
Average estimated value of detached houses in 2022 (39.9% of all units):
| Downtown Nutley (Downtown): | $498,745 |
| New Jersey: | $537,591 |
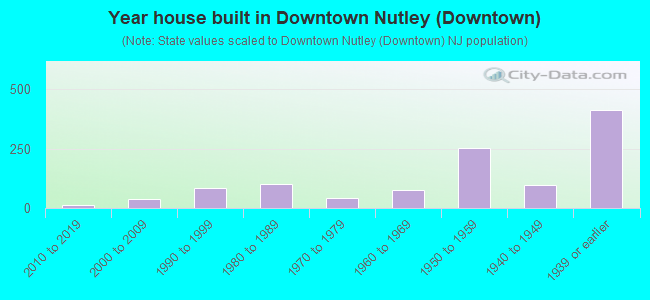
- Year house built in Downtown Nutley <
> - 02020 or later
- 122010 to 2019
- 362000 to 2009
- 861990 to 1999
- 1001980 to 1989
- 431970 to 1979
- 771960 to 1969
- 2511950 to 1959
- 971940 to 1949
- 4121939 or earlier
City-data.com crime index for place in 2020 (higher means more crime):
| City: | 45.1 |
| U.S. average: | 219.5 |
Travel time to work (commute)
![Travel time to work (commute)]()
- 16Less than 5 minutes
- 595 to 9 minutes
- 8610 to 14 minutes
- 6015 to 19 minutes
- 11620 to 24 minutes
- 3925 to 29 minutes
- 18430 to 34 minutes
- 1835 to 39 minutes
- 2140 to 44 minutes
- 12045 to 59 minutes
- 9060 to 89 minutes
- 5690 or more minutes

Means of transportation to work
![Means of transportation to work]()
- 70.1%753Drove a car alone
- 6.1%66Carpooled
- 10.3%111Bus
- 1.2%13Subway or elevated rail
- 7.4%79Long-distance train or commuter rail
- 3.6%39Light rail, streetcar or trolley
- 1.0%11Taxi
- 3.0%32Walked
- 9.1%98Other means
- 15.2%163Worked at home

Time leaving home to go to work
![Time leaving home to go to work]()
- 2612:00 a.m. to 4:59 a.m.
- 685:00 a.m. to 5:29 a.m.
- 425:30 a.m. to 5:59 a.m.
- 716:00 a.m. to 6:29 a.m.
- 716:30 a.m. to 6:59 a.m.
- 1097:00 a.m. to 7:29 a.m.
- 937:30 a.m. to 7:59 a.m.
- 1008:00 a.m. to 8:29 a.m.
- 438:30 a.m. to 8:59 a.m.
- 509:00 a.m. to 9:59 a.m.
- 4610:00 a.m. to 10:59 a.m.
- 2511:00 a.m. to 11:59 a.m.
- 5112:00 p.m. to 3:59 p.m.
- 414:00 p.m. to 11:59 p.m.

Occupations of males:
- Percentage of males in management occupations (except farmers):
Here: 8.0% New Jersey: 13.9%
- Percentage of males in business and financial operations occupations:
Here: 8.0% New Jersey: 6.9%
- Percentage of males in computer and mathematical occupations:
Here: 5.4% New Jersey: 6.5%
- Percentage of males in architecture and engineering occupations:
Here: 1.3% New Jersey: 3.1%
- Percentage of males in legal occupations:
Here: 2.1% New Jersey: 1.5%
- Percentage of males in education, training, and library occupations:
Here: 1.7% New Jersey: 3.6%
- Percentage of males in arts, design, entertainment, sports, and media occupations:
Here: 3.9% New Jersey: 2.0%
- Percentage of males in healthcare practitioners and technical occupations:
Here: 7.8% New Jersey: 3.2%
- Percentage of males in service occupations:
Here: 14.0% New Jersey: 12.9%
- Percentage of males in sales and office occupations:
Here: 12.1% New Jersey: 15.3%
- Percentage of males in construction, extraction, and maintenance occupations:
Here: 7.2% New Jersey: 8.1%
- Percentage of males in production occupations:
Here: 4.9% New Jersey: 4.8%
- Percentage of males in transportation occupations:
Here: 12.2% New Jersey: 6.5%
- Percentage of males in material moving occupations:
Here: 2.3% New Jersey: 4.7%
Occupations of females:
- Percentage of females in management occupations (except farmers):
Here: 7.3% New Jersey: 10.4%
- Percentage of females in business and financial operations occupations:
Here: 4.3% New Jersey: 7.3%
- Percentage of females in computer and mathematical occupations:
Here: 2.6% New Jersey: 2.4%
- Percentage of females in legal occupations:
Here: 1.1% New Jersey: 1.6%
- Percentage of females in education, training, and library occupations:
Here: 18.2% New Jersey: 11.4%
- Percentage of females in arts, design, entertainment, sports, and media occupations:
Here: 3.0% New Jersey: 2.2%
- Percentage of females in healthcare practitioners and technical occupations:
Here: 6.1% New Jersey: 9.6%
- Percentage of females in service occupations:
Here: 15.3% New Jersey: 17.2%
- Percentage of females in sales and office occupations:
Here: 37.8% New Jersey: 26.7%
- Percentage of females in production occupations:
Here: 1.6% New Jersey: 2.7%
Percentage of people 16-64 in Armed Forces:
| Downtown Nutley (Downtown): | 0.3% |
| New Jersey: | 0.2% |
Education in this neighborhood (subdivision or community):
- Percentage of people 3 years and older in K-12 schools:
Downtown Nutley (Downtown): 27.2% New Jersey: 16.6%
- Percentage of people 3 years and older in undergraduate colleges:
Downtown Nutley (Downtown): 4.2% New Jersey: 4.9%
- Percentage of people 3 years and older in grad. or professional schools:
Downtown Nutley (Downtown): 3.1% New Jersey: 1.6%
- Percentage of students K-12 enrolled in private schools:
Downtown Nutley (Downtown): 12.7% New Jersey: 12.7%
Percentage of population below poverty level:
| Downtown Nutley (Downtown): | 8.1% |
| New Jersey: | 9.7% |
Median year owner moved in (as recorded in 2022):
| Downtown Nutley (Downtown): | 2006 |
| New Jersey: | 2008 |
Percentage of married-couple families with both working:
| Downtown Nutley (Downtown): | 88.0% |
| New Jersey: | 72.0% |
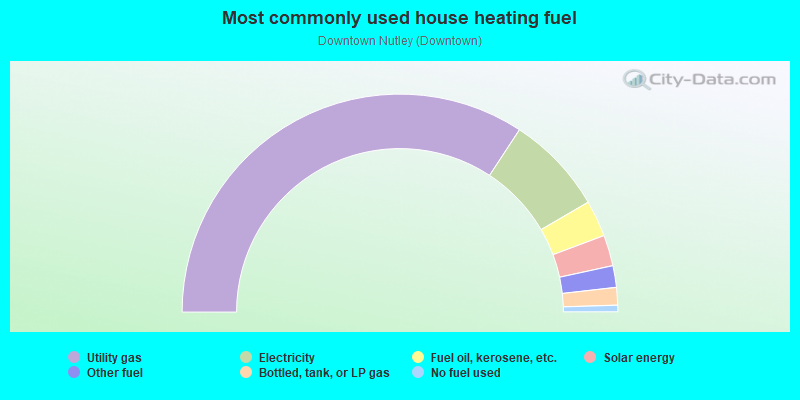
- 68.5%Utility gas
- 14.7%Electricity
- 5.4%Fuel oil, kerosene, etc.
- 4.6%Solar energy
- 3.2%Other fuel
- 2.6%Bottled, tank, or LP gas
- 1.0%No fuel used
Roads and streets:
Franklin Ave
Length: 1.35 miles
Direction: SW-NE
Address range: 62 to 550
Direction: SW-NE
Address range: 62 to 550
Park Dr
Length: 0.33 miles
Directions: N-S, SW-NE
Directions: N-S, SW-NE
Chestnut St
Length: 0.29 miles
Directions: E-W, SE-NW
Address range: 190 to 283
Directions: E-W, SE-NW
Address range: 190 to 283
Ravine Ave
Length: 0.28 miles
Direction: SW-NE
Address range: 1 to 112
Direction: SW-NE
Address range: 1 to 112
Vincent Pl
Length: 0.27 miles
Direction: SW-NE
Address range: 1 to 148
Direction: SW-NE
Address range: 1 to 148
Warren St
Length: 0.26 miles
Directions: E-W, SW-NE
Address range: 1 to 124
Directions: E-W, SW-NE
Address range: 1 to 124
Dodd St
Length: 0.22 miles
Direction: SW-NE
Address range: 1 to 99
Direction: SW-NE
Address range: 1 to 99
Centre St
Length: 0.20 miles
Directions: E-W, SE-NW
Address range: 319 to 389
Directions: E-W, SE-NW
Address range: 319 to 389
Booth Dr
Length: 0.19 miles
Directions: E-W, SE-NW, SW-NE
Directions: E-W, SE-NW, SW-NE
New St
Length: 0.16 miles
Direction: E-W
Address range: 1 to 54
Direction: E-W
Address range: 1 to 54
William St
Length: 0.16 miles
Direction: E-W
Address range: 1 to 56
Direction: E-W
Address range: 1 to 56
Vreeland Ave
Length: 0.15 miles
Direction: SE-NW
Address range: 75 to 128
Direction: SE-NW
Address range: 75 to 128
Harrison St
Length: 0.12 miles
Direction: SE-NW
Address range: 102 to 167
Direction: SE-NW
Address range: 102 to 167
Coppola St
Length: 0.11 miles
Direction: E-W
Address range: 1 to 42
Direction: E-W
Address range: 1 to 42
Stager St
Length: 0.09 miles
Direction: SE-NW
Address range: 2 to 30
Direction: SE-NW
Address range: 2 to 30
Ernest St
Length: 0.06 miles
Direction: SW-NE
Address range: 1 to 23
Direction: SW-NE
Address range: 1 to 23
Kennedy Dr
Length: 0.06 miles
Direction: SE-NW
Direction: SE-NW
E High St
Length: 0.06 miles
Directions: N-S, SE-NW, SW-NE
Address range: 1 to 26
Directions: N-S, SE-NW, SW-NE
Address range: 1 to 26
Adams St
Length: 0.04 miles
Direction: E-W
Address range: 1 to 32
Direction: E-W
Address range: 1 to 32
Lloyd St
Length: 0.04 miles
Direction: E-W
Address range: 1 to 32
Direction: E-W
Address range: 1 to 32
Florence St
Length: 0.02 miles
Direction: SE-NW
Address range: 70 to 99
Direction: SE-NW
Address range: 70 to 99
Other features:
3rd Riv
Length: 0.84 miles
Directions: E-W, N-S, SE-NW, SW-NE
Directions: E-W, N-S, SE-NW, SW-NE