Downtown neighborhood in Overland Park, Kansas (KS), 66204 detailed profile
Settings
X

Business Search - 14 Million verified businesses
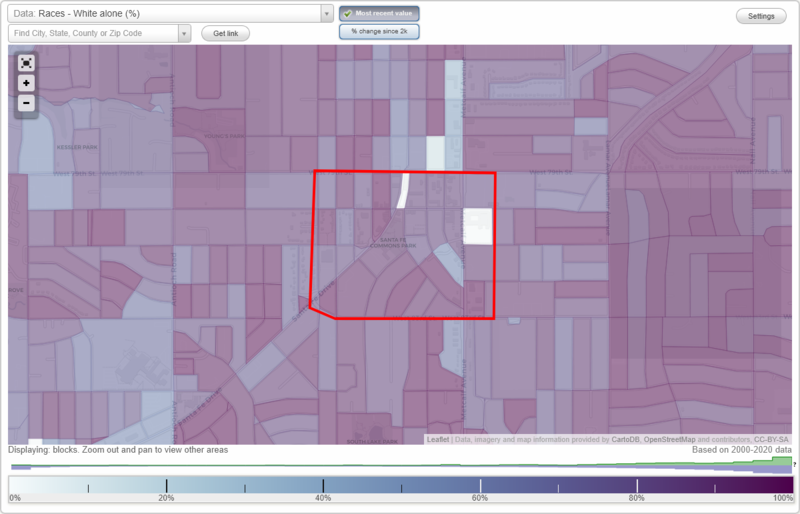
Area: 0.318 square miles
Population: 1,282
Population density:
| Downtown: | 4,029 people per square mile |
| Overland Park: | 3,485 people per square mile |

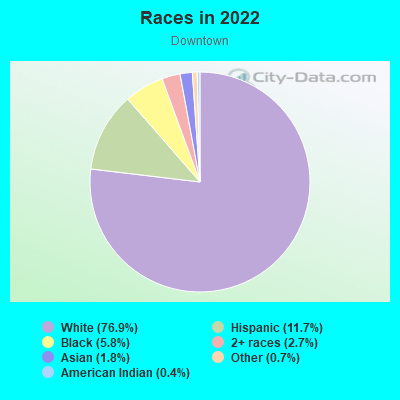
- 99776.9%White
- 15211.7%Hispanic or Latino
- 755.8%Black
- 352.7%Two or more races
- 231.8%Asian
- 90.7%Some other race
- 50.4%American Indian
Median household income in 2022:
| Downtown: | $69,663 |
| Overland Park: | $96,694 |
Distribution of median household income
![Distribution of median household income]()
- 13Less than $10,000
- 61$10,000 to $19,999
- 19$20,000 to $29,999
- 53$30,000 to $39,999
- 50$40,000 to $49,999
- 73$50,000 to $59,999
- 78$60,000 to $74,999
- 107$75,000 to $99,999
- 76$100,000 to $124,999
- 37$125,000 to $149,999
- 45$150,000 to $199,999
- 34$200,000 or more

Distribution of owner-occupied house/condo value
![Distribution of owner-occupied house/condo value]()
- 11Less than $50,000
- 30$50,000 to $99,999
- 124$100,000 to $149,999
- 102$150,000 to $199,999
- 52$200,000 to $249,999
- 33$250,000 to $299,999
- 31$300,000 to $399,999
- 21$400,000 to $499,999
- 17$500,000 to $749,999

Distribution of rent paid by renters
![Distribution of rent paid by renters]()
- 42$100 to $199
- 25$200 to $299
- 19$300 to $399
- 20$500 to $599
- 4$600 to $699
- 34$700 to $799
- 44$800 to $899
- 41$900 to $999
- 27$1,000 to $1,249
- 51$1,250 to $1,499
- 108$1,500 to $1,999
- 32$2,000 or more

Median rent in 2022:
| Downtown: | $1,171 |
| Overland Park: | $1,194 |
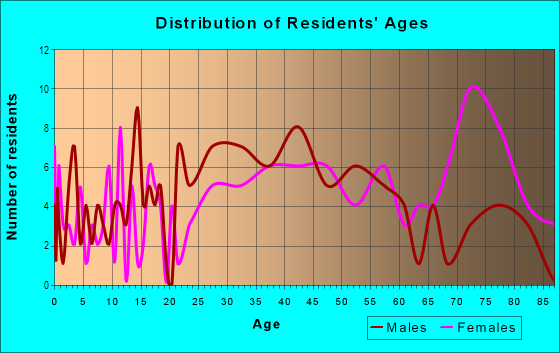
| Males: | 626 |
| Females: | 655 |
Males:
| This neighborhood: | 35.5 years |
| Whole city: | 37.7 years |
| This neighborhood: | 39.2 years |
| Whole city: | 38.8 years |
Average household size:
| Downtown: | 2.1 people |
| Overland Park: | 2.3 people |
Percentage of family households:
| Downtown: | 34.4% |
| Overland Park: | 42.1% |
| Here: | 28.8% |
| Overland Park: | 48.0% |
Percentage of married-couple families with children (among all households):
| Downtown: | 42.2% |
| Overland Park: | 37.4% |
Percentage of single-mother households (among all households):
| Downtown: | 1.9% |
| Overland Park: | 4.2% |
Percentage of never married males 15 years old and over:
Percentage of never married females 15 years old and over:
| Downtown: | 25.1% |
| Overland Park: | 17.2% |
Percentage of never married females 15 years old and over:
| Downtown: | 19.8% |
| city: | 15.1% |
Percentage of people that speak English not well or not at all:
| Downtown: | 0.5% |
| Overland Park: | 1.4% |
Percentage of people born in this state:
Percentage of people born in another U.S. state:
Percentage of native residents but born outside the U.S.:
Percentage of foreign born residents:
| Here: | 42.0% |
| Overland Park: | 37.4% |
Percentage of people born in another U.S. state:
| Downtown: | 46.5% |
| Overland Park: | 50.4% |
Percentage of native residents but born outside the U.S.:
| Here: | 0.8% |
| city: | 0.9% |
Percentage of foreign born residents:
| Here: | 10.8% |
| Overland Park: | 11.3% |
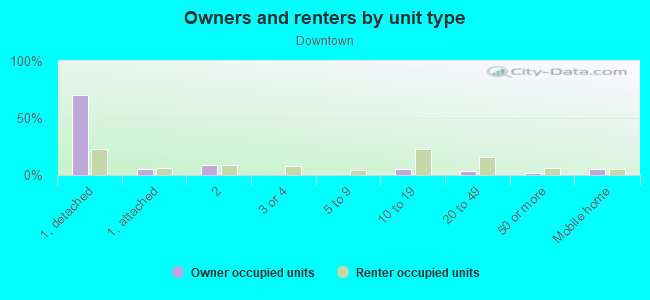
Owner-occupied
Renter-occupied

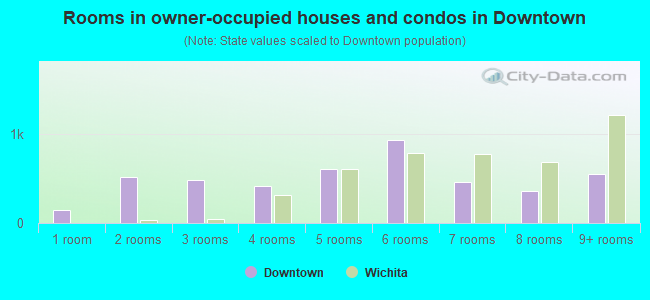
- Rooms in owner-occupied houses and condos in Downtown
- 01 room
- 02 rooms
- 53 rooms
- 374 rooms
- 585 rooms
- 726 rooms
- 337 rooms
- 278 rooms
- 1209+ rooms
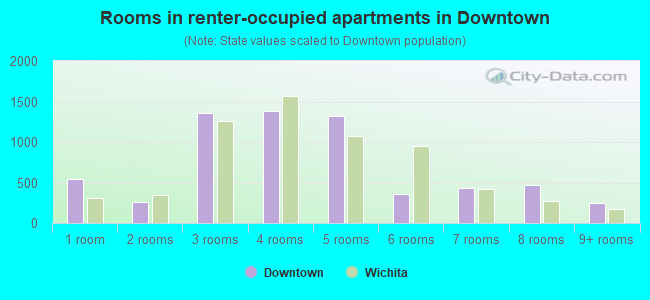
- Rooms in renter-occupied apartments in Downtown
- 391 room
- 452 rooms
- 983 rooms
- 774 rooms
- 1155 rooms
- 326 rooms
- 377 rooms
- 108 rooms
- 209+ rooms
Owner-occupied
Renter-occupied

- Bedrooms in owner-occupied houses and condos in Downtown
- 0no bedroom
- 81 bedroom
- 902 bedrooms
- 1383 bedrooms
- 274 bedrooms
- 735+ bedrooms
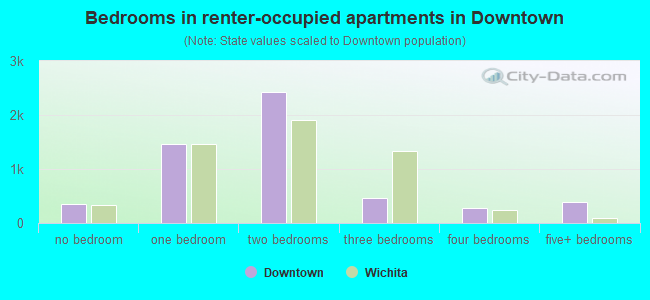
- Bedrooms in renter-occupied apartments in Downtown
- 39no bedroom
- 1031 bedroom
- 1372 bedrooms
- 443 bedrooms
- 134 bedrooms
- 85+ bedrooms
Average number of cars or other vehicles available in houses/condos:
Average number of cars or other vehicles available in apartments:
| This neighborhood: | 1.8 |
| Overland Park: | 2.0 |
Average number of cars or other vehicles available in apartments:
| Here: | 1.3 |
| city: | 1.3 |
Percentage of units with a mortgage:
| Downtown: | 57.9% |
| Overland Park: | 67.7% |
Average estimated value of detached houses in 2022 (45.5% of all units):
| Downtown: | $247,062 |
| Kansas: | $264,181 |
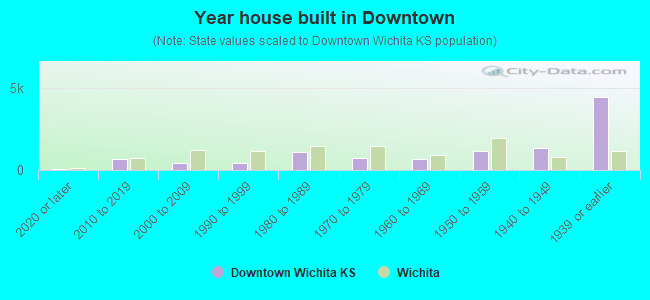
- Year house built in Downtown
- 212020 or later
- 1132010 to 2019
- 722000 to 2009
- 351990 to 1999
- 321980 to 1989
- 551970 to 1979
- 1241960 to 1969
- 1421950 to 1959
- 671940 to 1949
- 651939 or earlier
City-data.com crime index for city in 2020 (higher means more crime):
| City: | 154.8 |
| U.S. average: | 219.5 |
Travel time to work (commute)
![Travel time to work (commute)]()
- 17Less than 5 minutes
- 505 to 9 minutes
- 9110 to 14 minutes
- 13615 to 19 minutes
- 12420 to 24 minutes
- 5425 to 29 minutes
- 5130 to 34 minutes
- 1435 to 39 minutes
- 340 to 44 minutes
- 2645 to 59 minutes
- 360 to 89 minutes
- 590 or more minutes

Means of transportation to work
![Means of transportation to work]()
- 73.2%518Drove a car alone
- 4.4%31Carpooled
- 3.8%27Taxi
- 1.6%11Bicycle
- 4.4%31Walked
- 1.3%9Other means
- 19.5%138Worked at home

Time leaving home to go to work
![Time leaving home to go to work]()
- 3012:00 a.m. to 4:59 a.m.
- 65:00 a.m. to 5:29 a.m.
- 225:30 a.m. to 5:59 a.m.
- 386:00 a.m. to 6:29 a.m.
- 866:30 a.m. to 6:59 a.m.
- 617:00 a.m. to 7:29 a.m.
- 897:30 a.m. to 7:59 a.m.
- 728:00 a.m. to 8:29 a.m.
- 488:30 a.m. to 8:59 a.m.
- 609:00 a.m. to 9:59 a.m.
- 1810:00 a.m. to 10:59 a.m.
- 611:00 a.m. to 11:59 a.m.
- 912:00 p.m. to 3:59 p.m.
- 54:00 p.m. to 11:59 p.m.

Occupations of males:
- Percentage of males in management occupations (except farmers):
Here: 13.8% city: 17.2%
- Percentage of males in business and financial operations occupations:
Here: 3.7% city: 9.9%
- Percentage of males in computer and mathematical occupations:
Here: 10.1% city: 11.2%
- Percentage of males in architecture and engineering occupations:
Here: 5.3% city: 5.0%
- Percentage of males in education, training, and library occupations:
Here: 6.1% city: 2.4%
- Percentage of males in arts, design, entertainment, sports, and media occupations:
Here: 4.0% city: 2.6%
- Percentage of males in healthcare practitioners and technical occupations:
Here: 10.3% city: 4.1%
- Percentage of males in service occupations:
Here: 8.3% city: 9.7%
- Percentage of males in sales and office occupations:
Here: 14.4% city: 19.9%
- Percentage of males in production occupations:
Here: 2.6% city: 2.3%
- Percentage of males in transportation occupations:
Here: 6.0% city: 3.0%
- Percentage of males in material moving occupations:
Here: 1.3% city: 2.7%
Occupations of females:
- Percentage of females in management occupations (except farmers):
Here: 8.3% city: 10.8%
- Percentage of females in business and financial operations occupations:
Here: 13.0% city: 10.2%
- Percentage of females in computer and mathematical occupations:
Here: 5.2% city: 4.6%
- Percentage of females in education, training, and library occupations:
Here: 9.0% city: 10.8%
- Percentage of females in arts, design, entertainment, sports, and media occupations:
Here: 4.1% city: 2.8%
- Percentage of females in healthcare practitioners and technical occupations:
Here: 12.1% city: 12.1%
- Percentage of females in service occupations:
Here: 12.1% city: 13.8%
- Percentage of females in sales and office occupations:
Here: 29.7% city: 25.2%
- Percentage of females in production occupations:
Here: 6.3% city: 2.0%
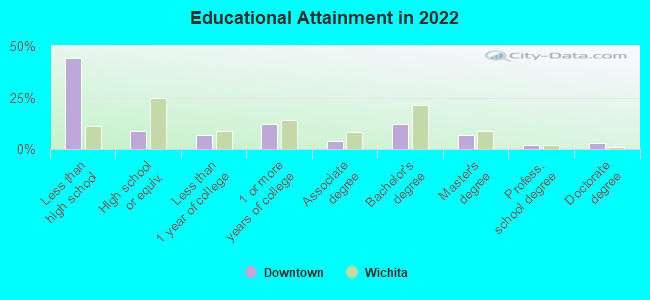
Education in this neighborhood (subdivision or community):
- Percentage of people 3 years and older in K-12 schools:
Downtown: 18.0% Overland Park: 15.4%
- Percentage of people 3 years and older in undergraduate colleges:
Downtown: 4.1% Overland Park: 3.4%
- Percentage of people 3 years and older in grad. or professional schools:
Downtown: 2.6% Overland Park: 2.3%
- Percentage of students K-12 enrolled in private schools:
Downtown: 73.9% Overland Park: 14.1%
Percentage of population below poverty level:
| Downtown: | 5.9% |
| Overland Park: | 5.0% |
Median year owner moved in (as recorded in 2022):
Median year renter moved in (as recorded in 2022):
| Downtown: | 2008 |
| Overland Park: | 2013 |
Median year renter moved in (as recorded in 2022):
| Downtown: | 2017 |
| Overland Park: | 2021 |
Percentage of married-couple families with both working:
| Downtown: | 53.0% |
| Overland Park: | 75.4% |
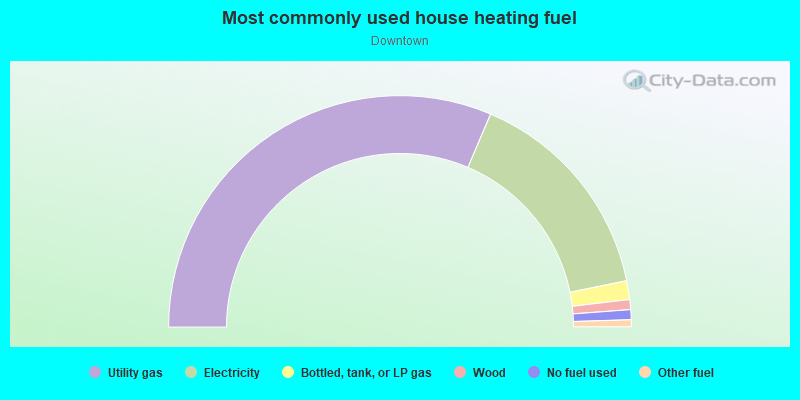
- 68.0%Utility gas
- 25.0%Electricity
- 3.6%No fuel used
- 2.3%Bottled, tank, or LP gas
- 1.1%Wood
Highways in this neighborhood:
US Hwy 169 (Metcalf Ave)
Length: 0.38 miles
Direction: N-S
Address range: 8000 to 8299
Direction: N-S
Address range: 8000 to 8299
Roads and streets:
W 83rd St
Length: 0.81 miles
Directions: E-W, SE-NW
Address range: 6900 to 7903
Directions: E-W, SE-NW
Address range: 6900 to 7903
W 80th St
Length: 0.77 miles
Direction: E-W
Address range: 6710 to 7899
Direction: E-W
Address range: 6710 to 7899
Robinson St
Length: 0.50 miles
Direction: N-S
Address range: 7900 to 8299
Direction: N-S
Address range: 7900 to 8299
Santa Fe Dr (Santa Fe Trail Dr)
Length: 0.49 miles
Direction: SW-NE
Address range: 8000 to 8217
Direction: SW-NE
Address range: 8000 to 8217
W 81st St
Length: 0.48 miles
Directions: E-W, SW-NE
Address range: 6902 to 7899
Directions: E-W, SW-NE
Address range: 6902 to 7899
Overland Park Dr
Length: 0.47 miles
Directions: E-W, N-S, SE-NW
Address range: 8000 to 8299
Directions: E-W, N-S, SE-NW
Address range: 8000 to 8299
Hamilton Dr
Length: 0.47 miles
Directions: E-W, N-S, SW-NE
Address range: 7200 to 8299
Directions: E-W, N-S, SW-NE
Address range: 7200 to 8299
Marty St
Length: 0.47 miles
Directions: N-S, SE-NW, SW-NE
Address range: 8000 to 8299
Directions: N-S, SE-NW, SW-NE
Address range: 8000 to 8299
Lowell Ave
Length: 0.42 miles
Directions: N-S, SE-NW
Address range: 7900 to 8206
Directions: N-S, SE-NW
Address range: 7900 to 8206
Newton St
Length: 0.42 miles
Directions: N-S, SE-NW
Address range: 7900 to 8299
Directions: N-S, SE-NW
Address range: 7900 to 8299
Valley View Dr
Length: 0.32 miles
Directions: N-S, SW-NE
Address range: 8100 to 8299
Directions: N-S, SW-NE
Address range: 8100 to 8299
Floyd St
Length: 0.22 miles
Directions: N-S, SE-NW
Address range: 8000 to 8199
Directions: N-S, SE-NW
Address range: 8000 to 8199
Riley St
Length: 0.19 miles
Direction: SW-NE
Address range: 8100 to 8299
Direction: SW-NE
Address range: 8100 to 8299
W 79th St
Length: 0.16 miles
Direction: E-W
Address range: 7700 to 7899
Direction: E-W
Address range: 7700 to 7899
Travis St
Length: 0.13 miles
Direction: N-S
Address range: 8200 to 8299
Direction: N-S
Address range: 8200 to 8299
Broadmoor Ln
Length: 0.13 miles
Direction: N-S
Address range: 8000 to 8099
Direction: N-S
Address range: 8000 to 8099
Conser St (Conser Pl)
Length: 0.12 miles
Directions: N-S, SE-NW
Address range: 8000 to 8099
Directions: N-S, SE-NW
Address range: 8000 to 8099
W 82nd St
Length: 0.09 miles
Direction: E-W
Address range: 6912 to 7099
Direction: E-W
Address range: 6912 to 7099
Foster St
Length: 0.03 miles
Direction: N-S
Address range: 8000 to 8099
Direction: N-S
Address range: 8000 to 8099