East Bank Historic District (East Bank) neighborhood in Westport, Connecticut (CT), 06880 detailed profile
Settings
X

Business Search - 14 Million verified businesses
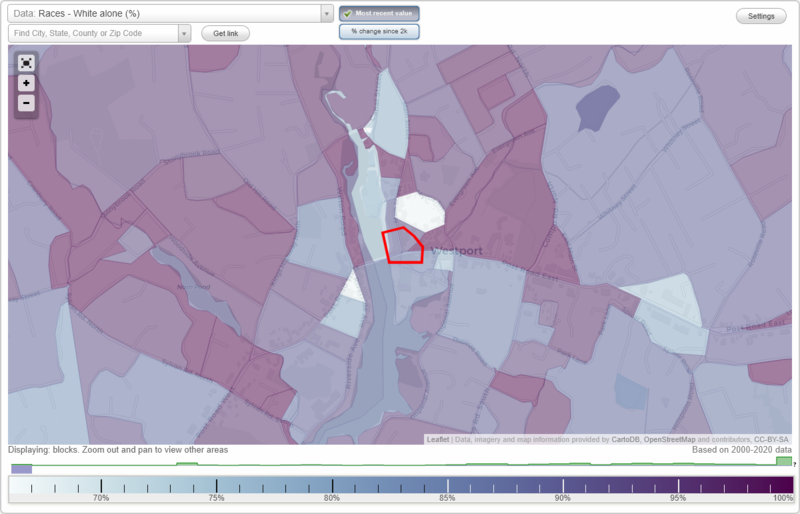
Area: 0.012 square miles
City-data.com crime index for place in 2020 (higher means more crime):
| City: | 49.5 |
| U.S. average: | 219.5 |
Highways in this neighborhood:
US Hwy 1 (Post Rd E)
Length: 0.03 miles
Direction: E-W
Address range: 26 to 60
Direction: E-W
Address range: 26 to 60