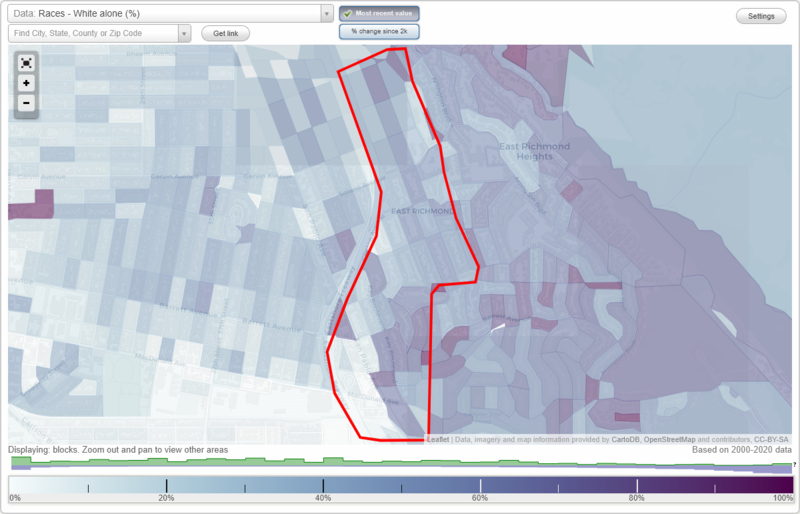
East Richmond neighborhood in Richmond, California (CA), 94805 detailed profile
Settings
X

Business Search - 14 Million verified businesses
Area: 0.398 square miles
Population: 3,064
Population density:
| East Richmond: | 7,699 people per square mile |
| Richmond: | 3,812 people per square mile |

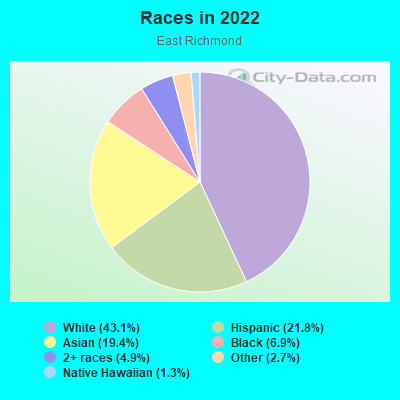
- 1,38143.1%White
- 69721.8%Hispanic or Latino
- 62019.4%Asian
- 2216.9%Black
- 1574.9%Two or more races
- 852.7%Some other race
- 411.3%Native Hawaiian and Other
Pacific Islander - 20.06%American Indian
Median household income in 2022:
| East Richmond: | $126,361 |
| Richmond: | $88,594 |
Distribution of median household income
![Distribution of median household income]()
- 154Less than $10,000
- 257$10,000 to $19,999
- 112$20,000 to $29,999
- 57$30,000 to $39,999
- 107$40,000 to $49,999
- 51$50,000 to $59,999
- 74$60,000 to $74,999
- 117$75,000 to $99,999
- 34$100,000 to $124,999
- 154$125,000 to $149,999
- 261$150,000 to $199,999
- 343$200,000 or more

Distribution of owner-occupied house/condo value
![Distribution of owner-occupied house/condo value]()
- 20Less than $50,000
- 37$50,000 to $99,999
- 61$100,000 to $149,999
- 43$150,000 to $199,999
- 25$200,000 to $249,999
- 68$250,000 to $299,999
- 20$300,000 to $399,999
- 25$400,000 to $499,999
- 274$500,000 to $749,999
- 503$750,000 to $999,999
- 162$1,000,000 or more

Distribution of rent paid by renters
![Distribution of rent paid by renters]()
- 30$100 to $199
- 251$200 to $299
- 64$300 to $399
- 18$400 to $499
- 204$500 to $599
- 38$700 to $799
- 36$800 to $899
- 33$900 to $999
- 36$1,000 to $1,249
- 86$1,250 to $1,499
- 112$1,500 to $1,999
- 315$2,000 or more

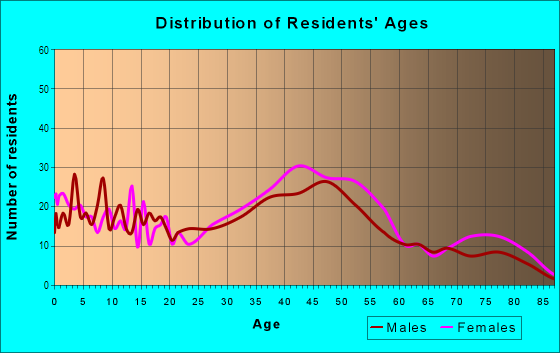
| Males: | 1,601 |
| Females: | 1,462 |
Males:
| This neighborhood: | 37.5 years |
| Whole city: | 35.3 years |
| This neighborhood: | 43.5 years |
| Whole city: | 43.0 years |
Average household size:
| East Richmond: | 2.7 people |
| Richmond: | 2.8 people |
Percentage of family households:
| East Richmond: | 55.5% |
| Richmond: | 42.7% |
| Here: | 61.7% |
| Richmond: | 40.5% |
Percentage of married-couple families with children (among all households):
| East Richmond: | 28.5% |
| Richmond: | 21.6% |
Percentage of single-mother households (among all households):
| East Richmond: | 5.5% |
| Richmond: | 9.9% |
Percentage of never married males 15 years old and over:
Percentage of never married females 15 years old and over:
| East Richmond: | 18.8% |
| Richmond: | 25.4% |
Percentage of never married females 15 years old and over:
| East Richmond: | 13.3% |
| city: | 19.6% |
Percentage of people that speak English not well or not at all:
| East Richmond: | 5.1% |
| Richmond: | 12.7% |
Percentage of people born in this state:
Percentage of people born in another U.S. state:
Percentage of native residents but born outside the U.S.:
Percentage of foreign born residents:
| Here: | 44.9% |
| Richmond: | 47.4% |
Percentage of people born in another U.S. state:
| East Richmond: | 25.2% |
| Richmond: | 14.0% |
Percentage of native residents but born outside the U.S.:
| Here: | 1.0% |
| city: | 2.3% |
Percentage of foreign born residents:
| Here: | 29.0% |
| Richmond: | 36.3% |
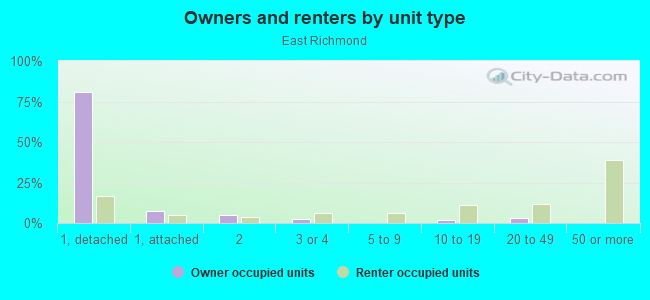
Owner-occupied
Renter-occupied

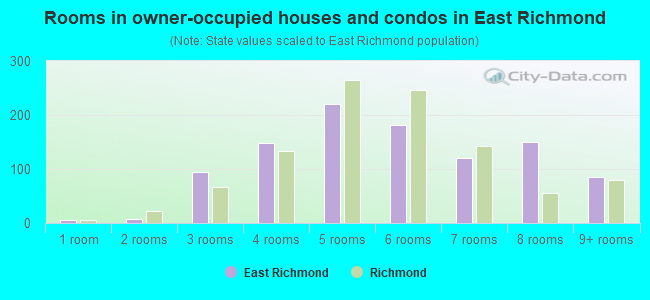
- Rooms in owner-occupied houses and condos in East Richmond
- 51 room
- 72 rooms
- 943 rooms
- 1494 rooms
- 2215 rooms
- 1826 rooms
- 1217 rooms
- 1508 rooms
- 859+ rooms
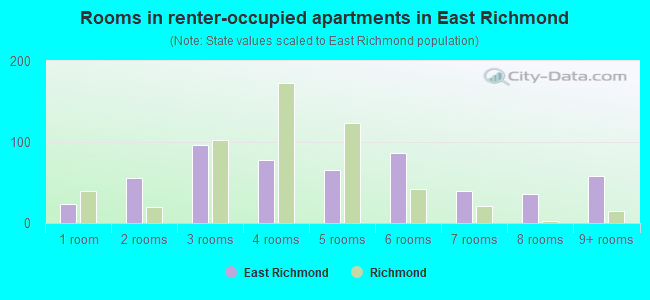
- Rooms in renter-occupied apartments in East Richmond
- 241 room
- 562 rooms
- 963 rooms
- 784 rooms
- 665 rooms
- 866 rooms
- 407 rooms
- 368 rooms
- 589+ rooms
Owner-occupied
Renter-occupied
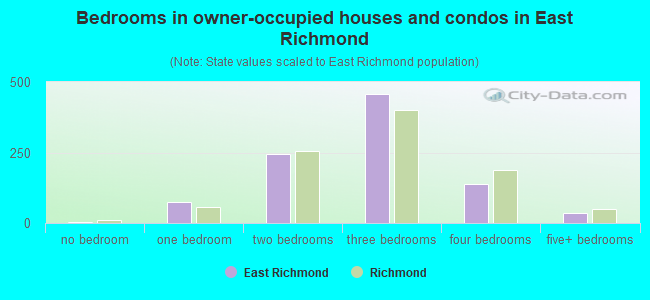
- Bedrooms in owner-occupied houses and condos in East Richmond
- 5no bedroom
- 761 bedroom
- 2442 bedrooms
- 4573 bedrooms
- 1404 bedrooms
- 365+ bedrooms
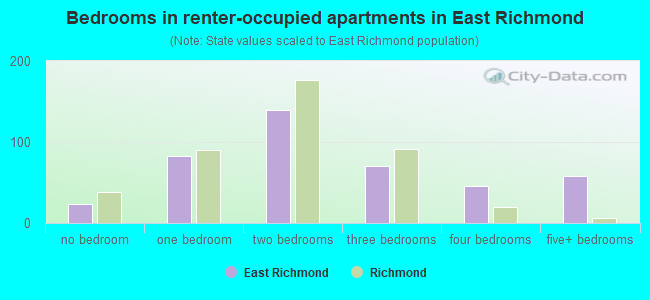
- Bedrooms in renter-occupied apartments in East Richmond
- 24no bedroom
- 831 bedroom
- 1402 bedrooms
- 703 bedrooms
- 464 bedrooms
- 585+ bedrooms
Average number of cars or other vehicles available in houses/condos:
Average number of cars or other vehicles available in apartments:
| This neighborhood: | 1.9 |
| Richmond: | 2.2 |
Average number of cars or other vehicles available in apartments:
| Here: | 1.7 |
| city: | 1.7 |
Percentage of units with a mortgage:
| East Richmond: | 77.6% |
| Richmond: | 67.4% |
Average estimated value of detached houses in 2022 (88.0% of all units):
| East Richmond: | $803,506 |
| Richmond: | $610,033 |
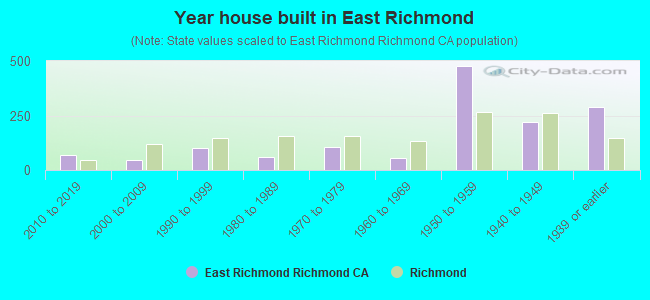
- Year house built in East Richmond
- 02020 or later
- 692010 to 2019
- 452000 to 2009
- 1021990 to 1999
- 611980 to 1989
- 1061970 to 1979
- 571960 to 1969
- 4761950 to 1959
- 2191940 to 1949
- 2891939 or earlier
City-data.com crime index for city in 2020 (higher means more crime):
| City: | 461.7 |
| U.S. average: | 219.5 |
Travel time to work (commute)
![Travel time to work (commute)]()
- 34Less than 5 minutes
- 275 to 9 minutes
- 17110 to 14 minutes
- 12715 to 19 minutes
- 9920 to 24 minutes
- 7725 to 29 minutes
- 26730 to 34 minutes
- 1335 to 39 minutes
- 9840 to 44 minutes
- 19545 to 59 minutes
- 12960 to 89 minutes
- 6290 or more minutes

Means of transportation to work
![Means of transportation to work]()
- 50.1%875Drove a car alone
- 9.2%160Carpooled
- 4.6%80Bus
- 10.1%176Subway or elevated rail
- 4.0%70Long-distance train or commuter rail
- 4.6%81Light rail, streetcar or trolley
- 3.4%59Ferryboat
- 0.3%6Taxi
- 3.5%62Motorcycle
- 2.3%40Bicycle
- 3.3%57Walked
- 2.6%45Other means
- 22.8%399Worked at home

Time leaving home to go to work
![Time leaving home to go to work]()
- 9812:00 a.m. to 4:59 a.m.
- 855:00 a.m. to 5:29 a.m.
- 525:30 a.m. to 5:59 a.m.
- 566:00 a.m. to 6:29 a.m.
- 486:30 a.m. to 6:59 a.m.
- 1337:00 a.m. to 7:29 a.m.
- 1787:30 a.m. to 7:59 a.m.
- 1718:00 a.m. to 8:29 a.m.
- 1668:30 a.m. to 8:59 a.m.
- 1679:00 a.m. to 9:59 a.m.
- 5010:00 a.m. to 10:59 a.m.
- 2811:00 a.m. to 11:59 a.m.
- 9512:00 p.m. to 3:59 p.m.
- 594:00 p.m. to 11:59 p.m.

Occupations of males:
- Percentage of males in management occupations (except farmers):
Here: 5.2% city: 9.4%
- Percentage of males in business and financial operations occupations:
Here: 8.7% city: 4.6%
- Percentage of males in computer and mathematical occupations:
Here: 2.4% city: 3.3%
- Percentage of males in architecture and engineering occupations:
Here: 4.7% city: 2.9%
- Percentage of males in community and social services occupations:
Here: 2.5% city: 1.1%
- Percentage of males in legal occupations:
Here: 10.2% city: 0.6%
- Percentage of males in education, training, and library occupations:
Here: 1.6% city: 3.6%
- Percentage of males in arts, design, entertainment, sports, and media occupations:
Here: 5.3% city: 2.2%
- Percentage of males in healthcare practitioners and technical occupations:
Here: 2.9% city: 1.4%
- Percentage of males in service occupations:
Here: 10.5% city: 18.4%
- Percentage of males in sales and office occupations:
Here: 17.1% city: 13.4%
- Percentage of males in construction, extraction, and maintenance occupations:
Here: 11.0% city: 14.7%
- Percentage of males in production occupations:
Here: 2.4% city: 4.8%
- Percentage of males in transportation occupations:
Here: 6.9% city: 8.9%
- Percentage of males in material moving occupations:
Here: 2.6% city: 5.0%
Occupations of females:
- Percentage of females in management occupations (except farmers):
Here: 12.8% city: 10.0%
- Percentage of females in business and financial operations occupations:
Here: 6.7% city: 4.9%
- Percentage of females in computer and mathematical occupations:
Here: 3.9% city: 1.0%
- Percentage of females in architecture and engineering occupations:
Here: 1.2% city: 0.3%
- Percentage of females in life, physical, and social science occupations:
Here: 2.6% city: 1.7%
- Percentage of females in legal occupations:
Here: 3.0% city: 1.1%
- Percentage of females in education, training, and library occupations:
Here: 7.3% city: 8.3%
- Percentage of females in arts, design, entertainment, sports, and media occupations:
Here: 13.0% city: 1.9%
- Percentage of females in healthcare practitioners and technical occupations:
Here: 13.1% city: 4.9%
- Percentage of females in service occupations:
Here: 17.8% city: 28.3%
- Percentage of females in sales and office occupations:
Here: 16.4% city: 25.4%
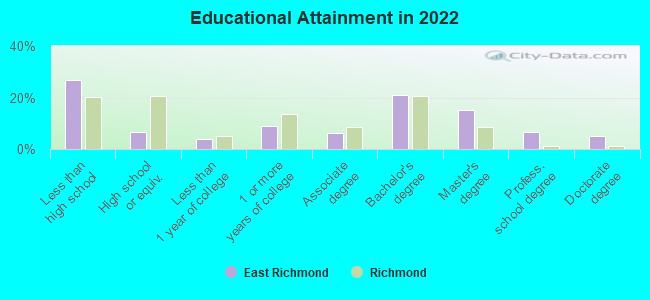
Education in this neighborhood (subdivision or community):
- Percentage of people 3 years and older in K-12 schools:
East Richmond: 18.6% Richmond: 17.8%
- Percentage of people 3 years and older in undergraduate colleges:
East Richmond: 2.7% Richmond: 4.5%
- Percentage of people 3 years and older in grad. or professional schools:
East Richmond: 5.8% Richmond: 0.8%
- Percentage of students K-12 enrolled in private schools:
East Richmond: 51.1% Richmond: 7.3%
Percentage of population below poverty level:
| East Richmond: | 2.5% |
| Richmond: | 16.2% |
Median year owner moved in (as recorded in 2022):
Median year renter moved in (as recorded in 2022):
| East Richmond: | 2004 |
| Richmond: | 2006 |
Median year renter moved in (as recorded in 2022):
| East Richmond: | 2014 |
| Richmond: | 2016 |
Percentage of married-couple families with both working:
| East Richmond: | 88.7% |
| Richmond: | 68.0% |
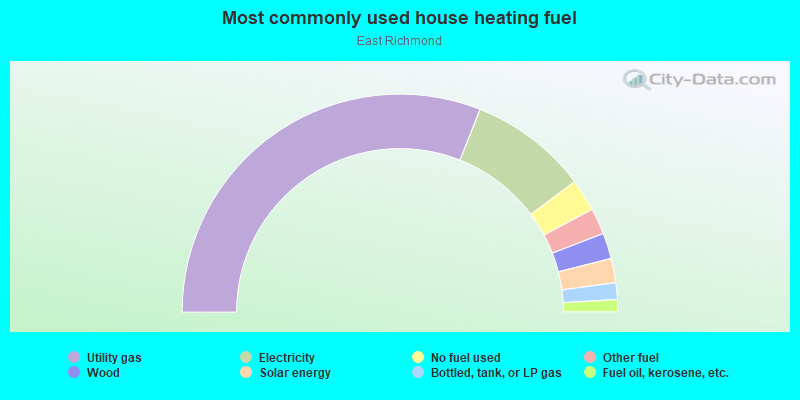
- 62.0%Utility gas
- 17.6%Electricity
- 4.8%No fuel used
- 3.9%Other fuel
- 3.8%Wood
- 3.6%Solar energy
- 2.5%Bottled, tank, or LP gas
- 1.8%Fuel oil, kerosene, etc.
Highways in this neighborhood:
San Pablo Ave (State Rte 123)
Length: 0.41 miles
Directions: N-S, SE-NW
Address range: 11918 to 12299
Directions: N-S, SE-NW
Address range: 11918 to 12299
Roads and streets:
Yuba St
Length: 0.85 miles
Directions: N-S, SE-NW
Address range: 600 to 999
Directions: N-S, SE-NW
Address range: 600 to 999
Kern St
Length: 0.83 miles
Directions: N-S, SE-NW
Address range: 600 to 999
Directions: N-S, SE-NW
Address range: 600 to 999
Amador St
Length: 0.82 miles
Directions: N-S, SE-NW
Address range: 600 to 799
Directions: N-S, SE-NW
Address range: 600 to 799
I- 80 (I- 80, I 80 Fwy)
Length: 0.72 miles
Directions: N-S, SE-NW
Directions: N-S, SE-NW
Key Blvd
Length: 0.63 miles
Directions: N-S, SE-NW
Address range: 300 to 661
Directions: N-S, SE-NW
Address range: 300 to 661
Sonoma St
Length: 0.62 miles
Directions: N-S, SE-NW, SW-NE
Address range: 600 to 999
Directions: N-S, SE-NW, SW-NE
Address range: 600 to 999
Humboldt St
Length: 0.55 miles
Directions: E-W, N-S, SE-NW, SW-NE
Address range: 301 to 2398
Directions: E-W, N-S, SE-NW, SW-NE
Address range: 301 to 2398
W Macdonald Ave (Macdonald Ave)
Length: 0.42 miles
Directions: E-W, SE-NW
Address range: 4581 to 5299
Directions: E-W, SE-NW
Address range: 4581 to 5299
Barrett Ave
Length: 0.39 miles
Directions: E-W, N-S, SE-NW, SW-NE
Address range: 4501 to 5320
Directions: E-W, N-S, SE-NW, SW-NE
Address range: 4501 to 5320
Nevin Ave
Length: 0.38 miles
Directions: E-W, N-S
Address range: 4600 to 5299
Directions: E-W, N-S
Address range: 4600 to 5299
Dimm St
Length: 0.38 miles
Directions: E-W, N-S, SE-NW, SW-NE
Address range: 400 to 599
Directions: E-W, N-S, SE-NW, SW-NE
Address range: 400 to 599
Carlston St (Carlston Ave)
Length: 0.37 miles
Directions: E-W, N-S, SE-NW, SW-NE
Address range: 300 to 499
Directions: E-W, N-S, SE-NW, SW-NE
Address range: 300 to 499
Sierra Ave
Length: 0.36 miles
Direction: E-W
Address range: 5200 to 5699
Direction: E-W
Address range: 5200 to 5699
Wilson Ave
Length: 0.29 miles
Directions: N-S, SE-NW
Address range: 301 to 599
Directions: N-S, SE-NW
Address range: 301 to 599
Solano Ave
Length: 0.28 miles
Directions: E-W, SW-NE
Address range: 5400 to 5752
Directions: E-W, SW-NE
Address range: 5400 to 5752
Mount St
Length: 0.27 miles
Directions: E-W, N-S, SE-NW, SW-NE
Address range: 400 to 599
Directions: E-W, N-S, SE-NW, SW-NE
Address range: 400 to 599
McLaughlin St (Mc Laughlin St)
Length: 0.27 miles
Directions: N-S, SE-NW
Address range: 400 to 599
Directions: N-S, SE-NW
Address range: 400 to 599
Clinton Ave
Length: 0.22 miles
Directions: E-W, SW-NE
Address range: 5300 to 5599
Directions: E-W, SW-NE
Address range: 5300 to 5599
Esmond Ave
Length: 0.22 miles
Direction: E-W
Address range: 5400 to 5699
Direction: E-W
Address range: 5400 to 5699
Mc Bryde Ave (McBryde Ave)
Length: 0.20 miles
Directions: E-W, SW-NE
Address range: 5400 to 5626
Directions: E-W, SW-NE
Address range: 5400 to 5626
Garvin Ave
Length: 0.20 miles
Direction: E-W
Address range: 5400 to 5699
Direction: E-W
Address range: 5400 to 5699
Prather Ave
Length: 0.18 miles
Direction: E-W
Address range: 4900 to 5299
Direction: E-W
Address range: 4900 to 5299
Ventura St
Length: 0.15 miles
Directions: N-S, SE-NW, SW-NE
Address range: 600 to 649
Directions: N-S, SE-NW, SW-NE
Address range: 600 to 649
Zara Ave
Length: 0.14 miles
Directions: E-W, SE-NW
Address range: 5300 to 5414
Directions: E-W, SE-NW
Address range: 5300 to 5414
Bissell Ave
Length: 0.13 miles
Directions: E-W, SE-NW
Address range: 4700 to 4899
Directions: E-W, SE-NW
Address range: 4700 to 4899
Roosevelt Ave
Length: 0.11 miles
Directions: E-W, SW-NE
Address range: 5000 to 5199
Directions: E-W, SW-NE
Address range: 5000 to 5199
46th St
Length: 0.11 miles
Directions: N-S, SE-NW
Address range: 400 to 499
Directions: N-S, SE-NW
Address range: 400 to 499
Doremus Ave
Length: 0.10 miles
Direction: E-W
Address range: 5600 to 5798
Direction: E-W
Address range: 5600 to 5798
Silva Ave
Length: 0.10 miles
Directions: E-W, SW-NE
Address range: 5200 to 5315
Directions: E-W, SW-NE
Address range: 5200 to 5315
Hazel Ave
Length: 0.09 miles
Direction: E-W
Address range: 5600 to 5705
Direction: E-W
Address range: 5600 to 5705
Marin Ave
Length: 0.09 miles
Direction: E-W
Address range: 5600 to 5699
Direction: E-W
Address range: 5600 to 5699
Courtland Ave
Length: 0.08 miles
Direction: N-S
Address range: 600 to 799
Direction: N-S
Address range: 600 to 799
Rosalind Ave
Length: 0.04 miles
Direction: E-W
Address range: 5300 to 5327
Direction: E-W
Address range: 5300 to 5327
Ohio St
Length: 0.04 miles
Directions: E-W, SW-NE
Address range: 6300 to 6399
Directions: E-W, SW-NE
Address range: 6300 to 6399
Poinsett Ave
Length: 0.03 miles
Direction: E-W
Address range: 5300 to 5317
Direction: E-W
Address range: 5300 to 5317
Bernhard Ave
Length: 0.03 miles
Direction: E-W
Direction: E-W
Cliff Ln
Length: 0.03 miles
Direction: E-W
Address range: 500 to 599
Direction: E-W
Address range: 500 to 599
Railroad features:
Bay Area Rapid Transit RR
Length: 0.38 miles
Directions: E-W, SE-NW
Directions: E-W, SE-NW