East Solano Avenue (East Solano Ave) neighborhood in Berkeley, California (CA), 94707 detailed profile
Settings
X

Business Search - 14 Million verified businesses
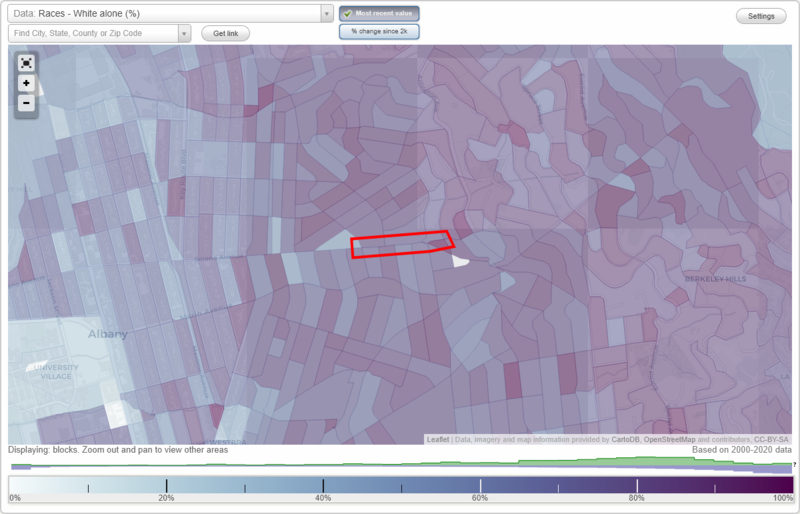
Area: 0.023 square miles
Population: 186
Population density:
| East Solano Avenue (East Solano Ave): | 8,232 people per square mile |
| Berkeley: | 11,372 people per square mile |

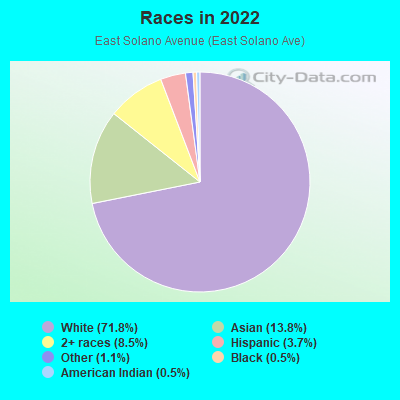
- 13571.8%White
- 2613.8%Asian
- 168.5%Two or more races
- 73.7%Hispanic or Latino
- 21.1%Some other race
- 10.5%Black
- 10.5%American Indian
Distribution of median household income
![Distribution of median household income]()
- 10Less than $10,000
- 4$10,000 to $19,999
- 17$20,000 to $29,999
- 5$30,000 to $39,999
- 6$40,000 to $49,999
- 5$50,000 to $59,999
- 5$60,000 to $74,999
- 8$75,000 to $99,999
- 8$100,000 to $124,999
- 5$125,000 to $149,999
- 10$150,000 to $199,999
- 32$200,000 or more

Distribution of owner-occupied house/condo value
![Distribution of owner-occupied house/condo value]()
- 5Less than $50,000
- 2$100,000 to $149,999
- 1$150,000 to $199,999
- 3$200,000 to $249,999
- 2$400,000 to $499,999
- 4$500,000 to $749,999
- 12$750,000 to $999,999
- 55$1,000,000 or more

Distribution of rent paid by renters
![Distribution of rent paid by renters]()
- 4$500 to $599
- 5$600 to $699
- 4$700 to $799
- 20$800 to $899
- 3$900 to $999
- 13$1,000 to $1,249
- 2$1,250 to $1,499
- 5$1,500 to $1,999
- 8$2,000 or more

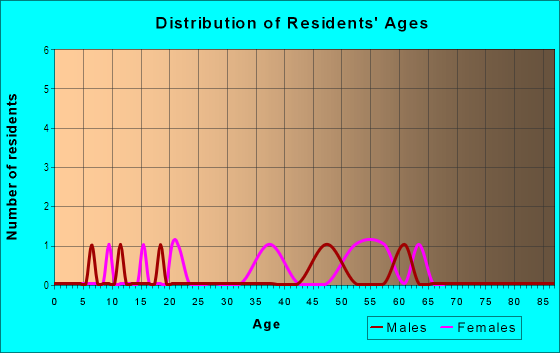
| Males: | 88 |
| Females: | 98 |
Males:
| This neighborhood: | 47.3 years |
| Whole city: | 31.4 years |
| This neighborhood: | 58.7 years |
| Whole city: | 31.7 years |
Average household size:
| East Solano Avenue (East Solano Ave): | 2.2 people |
| Berkeley: | 2.3 people |
Percentage of family households:
| East Solano Avenue (East Solano Ave): | 32.8% |
| Berkeley: | 31.4% |
| Here: | 51.7% |
| Berkeley: | 34.9% |
Percentage of married-couple families with children (among all households):
| East Solano Avenue (East Solano Ave): | 40.4% |
| Berkeley: | 30.5% |
Percentage of single-mother households (among all households):
| East Solano Avenue (East Solano Ave): | 6.7% |
| Berkeley: | 7.7% |
Percentage of never married males 15 years old and over:
Percentage of never married females 15 years old and over:
| East Solano Avenue (East Solano Ave): | 13.4% |
| Berkeley: | 26.2% |
Percentage of never married females 15 years old and over:
| East Solano Avenue (East Solano Ave): | 11.5% |
| city: | 29.6% |
Percentage of people that speak English not well or not at all:
| East Solano Avenue (East Solano Ave): | 0.0% |
| Berkeley: | 1.9% |
Percentage of people born in this state:
Percentage of people born in another U.S. state:
Percentage of native residents but born outside the U.S.:
Percentage of foreign born residents:
| Here: | 46.2% |
| Berkeley: | 46.8% |
Percentage of people born in another U.S. state:
| East Solano Avenue (East Solano Ave): | 30.9% |
| Berkeley: | 29.9% |
Percentage of native residents but born outside the U.S.:
| Here: | 2.9% |
| city: | 2.5% |
Percentage of foreign born residents:
| Here: | 20.0% |
| Berkeley: | 20.8% |
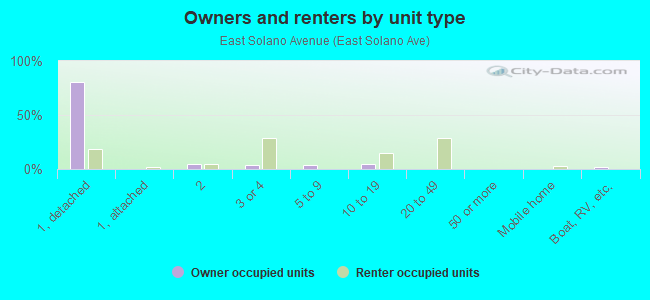
Owner-occupied
Renter-occupied

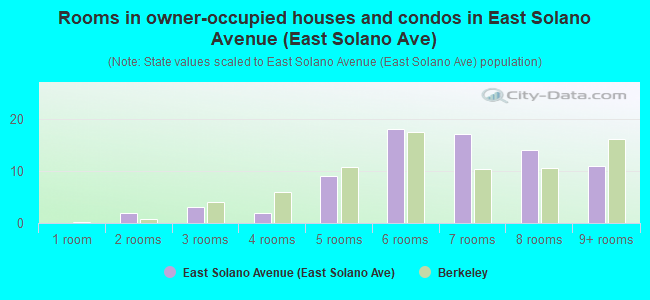
- Rooms in owner-occupied houses and condos in East Solano Avenue <
> - 01 room
- 22 rooms
- 33 rooms
- 24 rooms
- 95 rooms
- 186 rooms
- 177 rooms
- 148 rooms
- 119+ rooms
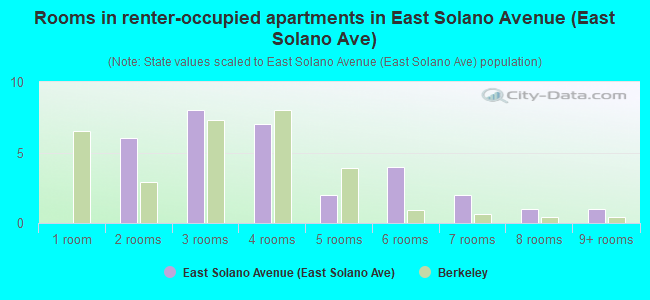
- Rooms in renter-occupied apartments in East Solano Avenue <
> - 01 room
- 62 rooms
- 83 rooms
- 74 rooms
- 25 rooms
- 46 rooms
- 27 rooms
- 18 rooms
- 19+ rooms
Owner-occupied
Renter-occupied
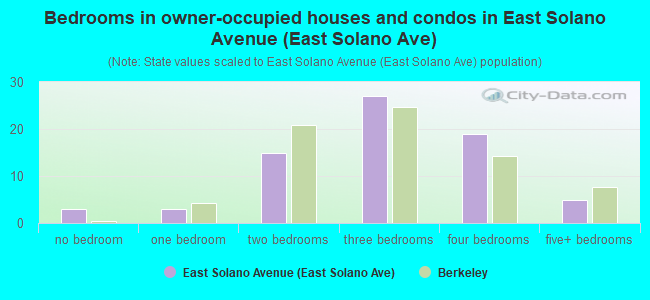
- Bedrooms in owner-occupied houses and condos in East Solano Avenue <
> - 3no bedroom
- 31 bedroom
- 152 bedrooms
- 273 bedrooms
- 194 bedrooms
- 55+ bedrooms
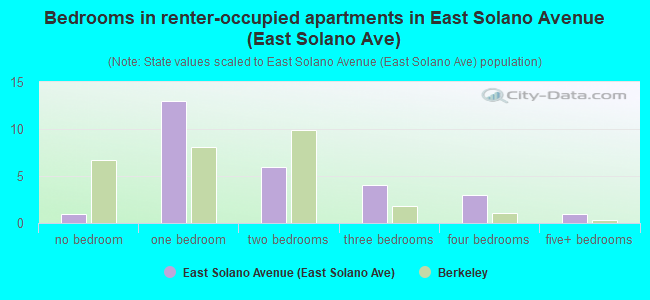
- Bedrooms in renter-occupied apartments in East Solano Avenue <
> - 1no bedroom
- 131 bedroom
- 62 bedrooms
- 43 bedrooms
- 34 bedrooms
- 15+ bedrooms
Average number of cars or other vehicles available in houses/condos:
Average number of cars or other vehicles available in apartments:
| This neighborhood: | 1.7 |
| Berkeley: | 1.7 |
Average number of cars or other vehicles available in apartments:
| Here: | 1.2 |
| city: | 0.9 |
Percentage of units with a mortgage:
| East Solano Avenue (East Solano Ave): | 61.5% |
| Berkeley: | 67.6% |
Average estimated value of detached houses in 2022 (86.9% of all units):
| East Solano Avenue (East Solano Ave): | $2,127,073 |
| California: | $988,808 |
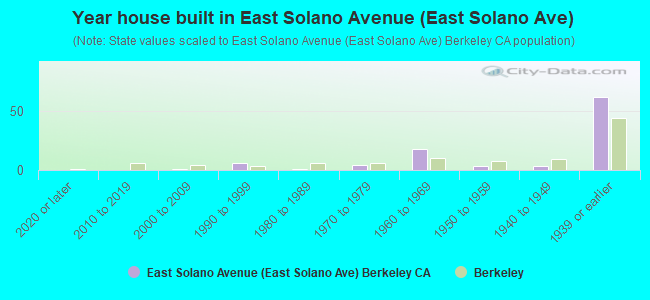
- Year house built in East Solano Avenue <
> - 02020 or later
- 02010 to 2019
- 12000 to 2009
- 61990 to 1999
- 11980 to 1989
- 41970 to 1979
- 181960 to 1969
- 31950 to 1959
- 31940 to 1949
- 621939 or earlier
City-data.com crime index for city in 2020 (higher means more crime):
| City: | 368.9 |
| U.S. average: | 219.5 |
Travel time to work (commute)
![Travel time to work (commute)]()
- 35 to 9 minutes
- 810 to 14 minutes
- 815 to 19 minutes
- 520 to 24 minutes
- 125 to 29 minutes
- 530 to 34 minutes
- 135 to 39 minutes
- 440 to 44 minutes
- 445 to 59 minutes
- 860 to 89 minutes
- 290 or more minutes

Means of transportation to work
![Means of transportation to work]()
- 30.1%27Drove a car alone
- 11.1%10Carpooled
- 5.6%5Bus
- 7.8%7Subway or elevated rail
- 1.1%1Long-distance train or commuter rail
- 7.8%7Bicycle
- 2.2%2Walked
- 42.3%38Worked at home

Time leaving home to go to work
![Time leaving home to go to work]()
- 15:00 a.m. to 5:29 a.m.
- 16:00 a.m. to 6:29 a.m.
- 26:30 a.m. to 6:59 a.m.
- 37:00 a.m. to 7:29 a.m.
- 47:30 a.m. to 7:59 a.m.
- 108:00 a.m. to 8:29 a.m.
- 88:30 a.m. to 8:59 a.m.
- 139:00 a.m. to 9:59 a.m.
- 410:00 a.m. to 10:59 a.m.
- 111:00 a.m. to 11:59 a.m.
- 112:00 p.m. to 3:59 p.m.

Occupations of males:
- Percentage of males in management occupations (except farmers):
Here: 19.2% city: 12.9%
- Percentage of males in business and financial operations occupations:
Here: 5.7% city: 5.0%
- Percentage of males in computer and mathematical occupations:
Here: 11.8% city: 12.2%
- Percentage of males in architecture and engineering occupations:
Here: 5.4% city: 6.4%
- Percentage of males in life, physical, and social science occupations:
Here: 6.1% city: 6.6%
- Percentage of males in legal occupations:
Here: 6.8% city: 3.7%
- Percentage of males in education, training, and library occupations:
Here: 9.4% city: 11.4%
- Percentage of males in arts, design, entertainment, sports, and media occupations:
Here: 8.0% city: 6.4%
- Percentage of males in healthcare practitioners and technical occupations:
Here: 3.8% city: 2.6%
- Percentage of males in service occupations:
Here: 3.4% city: 9.3%
- Percentage of males in sales and office occupations:
Here: 8.1% city: 11.2%
- Percentage of males in construction, extraction, and maintenance occupations:
Here: 1.9% city: 3.9%
- Percentage of males in production occupations:
Here: 2.6% city: 1.4%
- Percentage of males in material moving occupations:
Here: 3.9% city: 1.8%
Occupations of females:
- Percentage of females in management occupations (except farmers):
Here: 14.8% city: 14.2%
- Percentage of females in business and financial operations occupations:
Here: 5.9% city: 7.4%
- Percentage of females in computer and mathematical occupations:
Here: 2.7% city: 3.9%
- Percentage of females in life, physical, and social science occupations:
Here: 7.3% city: 5.5%
- Percentage of females in community and social services occupations:
Here: 5.1% city: 3.2%
- Percentage of females in legal occupations:
Here: 9.6% city: 2.4%
- Percentage of females in education, training, and library occupations:
Here: 16.6% city: 14.4%
- Percentage of females in arts, design, entertainment, sports, and media occupations:
Here: 3.7% city: 7.0%
- Percentage of females in healthcare practitioners and technical occupations:
Here: 10.3% city: 6.1%
- Percentage of females in service occupations:
Here: 8.4% city: 12.4%
- Percentage of females in sales and office occupations:
Here: 12.4% city: 18.1%
- Percentage of females in production occupations:
Here: 2.5% city: 1.1%
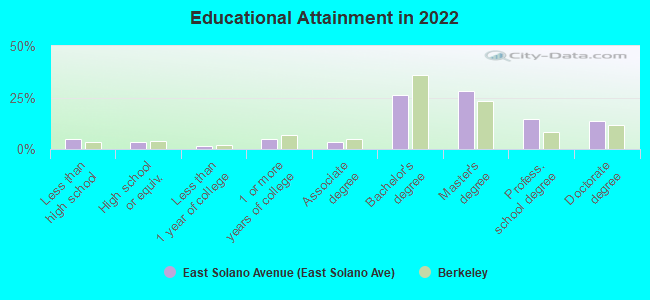
Education in this neighborhood (subdivision or community):
- Percentage of people 3 years and older in K-12 schools:
East Solano Avenue (East Solano Ave): 13.4% Berkeley: 9.8%
- Percentage of people 3 years and older in undergraduate colleges:
East Solano Avenue (East Solano Ave): 7.3% Berkeley: 22.4%
- Percentage of people 3 years and older in grad. or professional schools:
East Solano Avenue (East Solano Ave): 1.7% Berkeley: 6.8%
- Percentage of students K-12 enrolled in private schools:
East Solano Avenue (East Solano Ave): 54.2% Berkeley: 25.0%
Percentage of population below poverty level:
| East Solano Avenue (East Solano Ave): | 4.6% |
| Berkeley: | 19.0% |
Median year owner moved in (as recorded in 2022):
| East Solano Avenue (East Solano Ave): | 2001 |
| Berkeley: | 2004 |
Percentage of married-couple families with both working:
| East Solano Avenue (East Solano Ave): | 92.5% |
| Berkeley: | 78.8% |
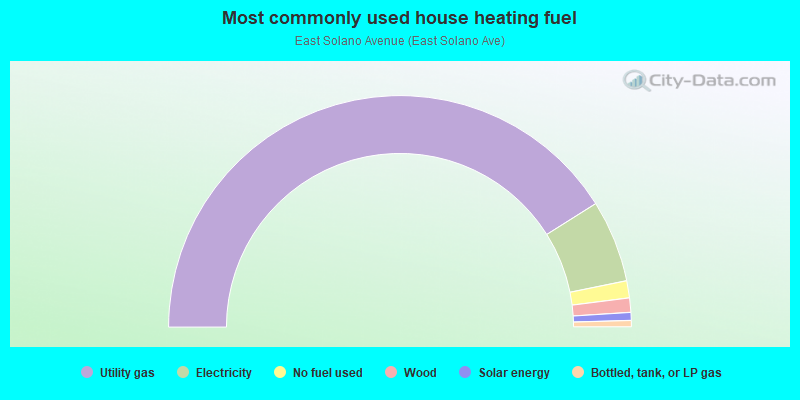
- 82.2%Utility gas
- 11.5%Electricity
- 2.4%No fuel used
- 2.0%Wood
- 1.1%Solar energy
- 0.9%Bottled, tank, or LP gas
Roads and streets:
Solano Ave
Length: 0.49 miles
Direction: E-W
Address range: 1740 to 1899
Direction: E-W
Address range: 1740 to 1899
Indian Rock Path
Length: 0.08 miles
Directions: E-W, SW-NE
Directions: E-W, SW-NE
Fresno Ave
Length: 0.00 miles
Direction: N-S
Address range: 900 to 903
Direction: N-S
Address range: 900 to 903