Fairview neighborhood in Gunnison, Colorado (CO), 81230 detailed profile
Settings
X

Business Search - 14 Million verified businesses
Area: 0.021 square miles
Population: 1,178
Population density:
| Fairview: | 55,600 people per square mile |
| Gunnison: | 2,065 people per square mile |

- 90866.7%Hispanic or Latino
- 21615.9%Asian
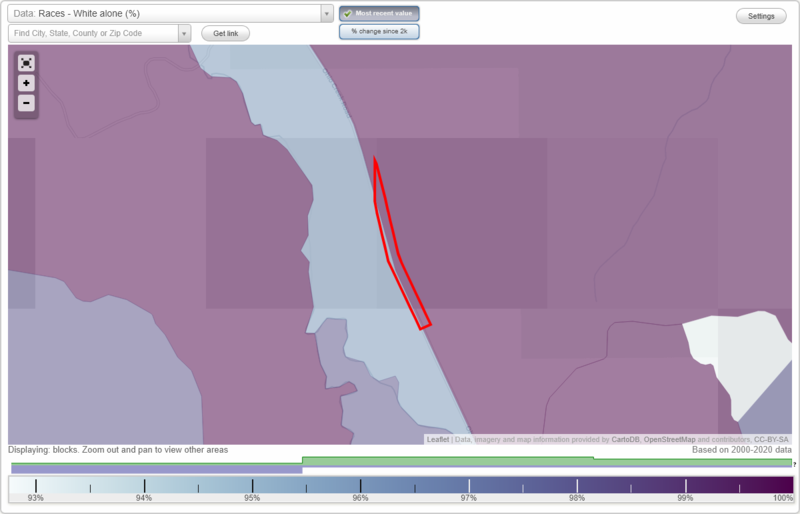
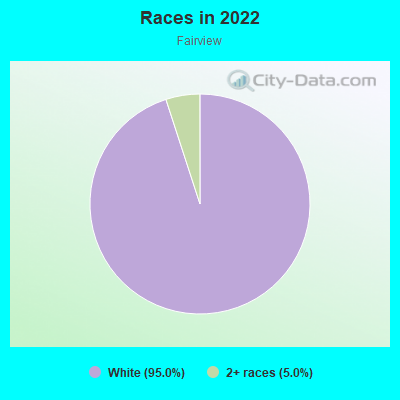
- 18813.8%White
- 342.5%Two or more races
- 161.2%Black
Median household income in 2022:
| Fairview: | $123,536 |
| Gunnison: | $63,229 |
Distribution of median household income
![Distribution of median household income]()
- 5Less than $10,000
- 41$10,000 to $19,999
- 61$20,000 to $29,999
- 34$30,000 to $39,999
- 40$40,000 to $49,999
- 33$50,000 to $59,999
- 16$60,000 to $74,999
- 61$75,000 to $99,999
- 13$100,000 to $124,999
- 119$125,000 to $149,999
- 13$150,000 to $199,999
- 78$200,000 or more

Distribution of owner-occupied house/condo value
![Distribution of owner-occupied house/condo value]()
- 12Less than $50,000
- 23$100,000 to $149,999
- 2$150,000 to $199,999
- 14$200,000 to $249,999
- 16$250,000 to $299,999
- 130$300,000 to $399,999
- 92$400,000 to $499,999
- 8$500,000 to $749,999

Distribution of rent paid by renters
![Distribution of rent paid by renters]()
- 11$100 to $199
- 27$200 to $299
- 3$300 to $399
- 4$500 to $599
- 4$600 to $699
- 7$700 to $799
- 8$800 to $899
- 57$900 to $999
- 34$1,000 to $1,249
- 6$1,250 to $1,499
- 25$1,500 to $1,999
- 10$2,000 or more

Median rent in 2022:
| Fairview: | $1,165 |
| Gunnison: | $928 |
| Males: | 571 |
| Females: | 606 |
Males:
| This neighborhood: | 37.3 years |
| Whole city: | 24.3 years |
| This neighborhood: | 34.2 years |
| Whole city: | 27.4 years |
Average household size:
| Fairview: | 3.4 people |
| Gunnison: | 1.9 people |
Percentage of family households:
| Fairview: | 42.6% |
| Gunnison: | 31.5% |
| Here: | 50.2% |
| Gunnison: | 28.7% |
Percentage of married-couple families with children (among all households):
| Fairview: | 27.0% |
| Gunnison: | 28.3% |
Percentage of single-mother households (among all households):
| Fairview: | 7.1% |
| Gunnison: | 13.7% |
Percentage of never married males 15 years old and over:
Percentage of never married females 15 years old and over:
| Fairview: | 22.1% |
| Gunnison: | 38.2% |
Percentage of never married females 15 years old and over:
| Fairview: | 14.5% |
| city: | 22.3% |
Percentage of people that speak English not well or not at all:
| Fairview: | 9.8% |
| Gunnison: | 0.0% |
Percentage of people born in this state:
Percentage of people born in another U.S. state:
Percentage of native residents but born outside the U.S.:
Percentage of foreign born residents:
| Here: | 45.1% |
| Gunnison: | 38.5% |
Percentage of people born in another U.S. state:
| Fairview: | 24.1% |
| Gunnison: | 57.6% |
Percentage of native residents but born outside the U.S.:
| Here: | 10.6% |
| city: | 1.4% |
Percentage of foreign born residents:
| Here: | 20.3% |
| Gunnison: | 2.6% |
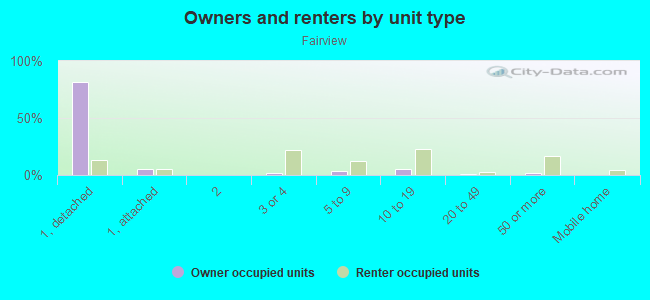
Owner-occupied
Renter-occupied

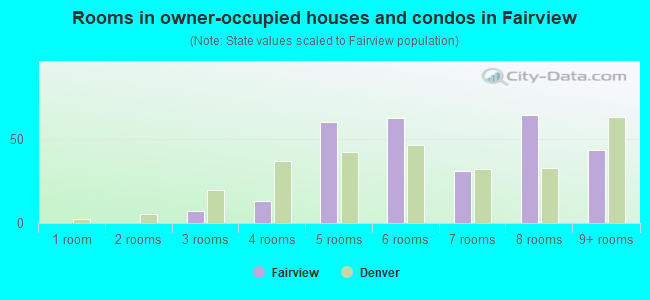
- Rooms in owner-occupied houses and condos in Fairview
- 01 room
- 02 rooms
- 73 rooms
- 134 rooms
- 605 rooms
- 626 rooms
- 317 rooms
- 648 rooms
- 439+ rooms
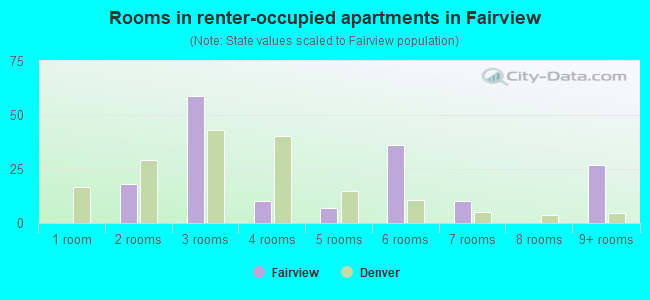
- Rooms in renter-occupied apartments in Fairview
- 01 room
- 182 rooms
- 593 rooms
- 104 rooms
- 75 rooms
- 366 rooms
- 107 rooms
- 08 rooms
- 279+ rooms
Owner-occupied
Renter-occupied
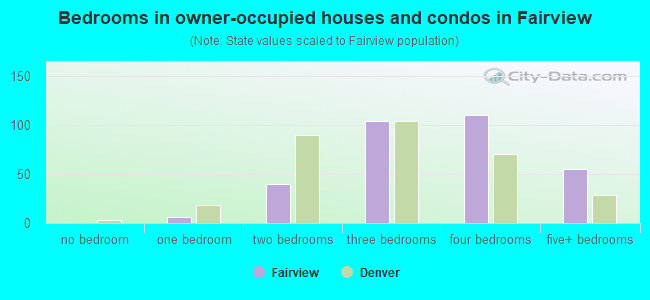
- Bedrooms in owner-occupied houses and condos in Fairview
- 0no bedroom
- 61 bedroom
- 402 bedrooms
- 1043 bedrooms
- 1104 bedrooms
- 555+ bedrooms
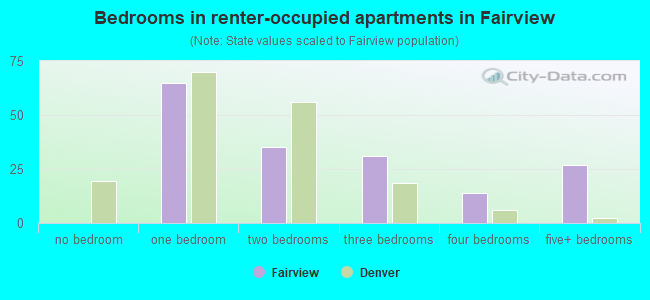
- Bedrooms in renter-occupied apartments in Fairview
- 0no bedroom
- 651 bedroom
- 352 bedrooms
- 313 bedrooms
- 144 bedrooms
- 275+ bedrooms
Average number of cars or other vehicles available in houses/condos:
Average number of cars or other vehicles available in apartments:
| This neighborhood: | 2.9 |
| Gunnison: | 1.9 |
Average number of cars or other vehicles available in apartments:
| Here: | 1.6 |
| city: | 2.1 |
Percentage of units with a mortgage:
| Fairview: | 76.0% |
| Gunnison: | 64.6% |
Average estimated value of detached houses in 2022 (71.4% of all units):
| Fairview: | $356,136 |
| Colorado: | $676,667 |
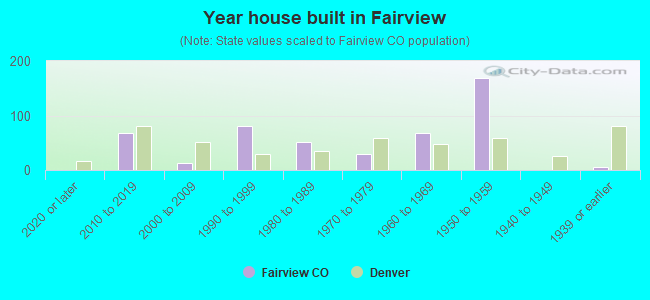
- Year house built in Fairview
- 02020 or later
- 672010 to 2019
- 122000 to 2009
- 811990 to 1999
- 521980 to 1989
- 291970 to 1979
- 671960 to 1969
- 1691950 to 1959
- 01940 to 1949
- 51939 or earlier
City-data.com crime index for city in 2020 (higher means more crime):
| City: | 119.2 |
| U.S. average: | 219.5 |
Travel time to work (commute)
![Travel time to work (commute)]()
- 505 to 9 minutes
- 2710 to 14 minutes
- 10715 to 19 minutes
- 20720 to 24 minutes
- 2325 to 29 minutes
- 15530 to 34 minutes
- 2335 to 39 minutes
- 1640 to 44 minutes
- 3545 to 59 minutes
- 3260 to 89 minutes
- 690 or more minutes

Means of transportation to work
![Means of transportation to work]()
- 77.8%379Drove a car alone
- 14.6%71Carpooled
- 2.1%10Bus
- 1.0%5Light rail, streetcar or trolley
- 4.5%22Other means
- 5.1%25Worked at home

Time leaving home to go to work
![Time leaving home to go to work]()
- 5212:00 a.m. to 4:59 a.m.
- 195:00 a.m. to 5:29 a.m.
- 555:30 a.m. to 5:59 a.m.
- 696:00 a.m. to 6:29 a.m.
- 1266:30 a.m. to 6:59 a.m.
- 967:00 a.m. to 7:29 a.m.
- 97:30 a.m. to 7:59 a.m.
- 918:00 a.m. to 8:29 a.m.
- 248:30 a.m. to 8:59 a.m.
- 319:00 a.m. to 9:59 a.m.
- 3910:00 a.m. to 10:59 a.m.
- 1211:00 a.m. to 11:59 a.m.
- 5912:00 p.m. to 3:59 p.m.
- 384:00 p.m. to 11:59 p.m.

Occupations of males:
- Percentage of males in management occupations (except farmers):
Here: 9.8% city: 14.8%
- Percentage of males in business and financial operations occupations:
Here: 17.2% city: 0.4%
- Percentage of males in arts, design, entertainment, sports, and media occupations:
Here: 1.7% city: 13.7%
- Percentage of males in service occupations:
Here: 3.4% city: 16.4%
- Percentage of males in sales and office occupations:
Here: 6.0% city: 10.9%
- Percentage of males in farming, fishing, and forestry occupations:
Here: 2.6% city: 3.3%
- Percentage of males in construction, extraction, and maintenance occupations:
Here: 14.6% city: 16.3%
- Percentage of males in production occupations:
Here: 16.8% city: 0.0%
- Percentage of males in transportation occupations:
Here: 4.1% city: 3.8%
Occupations of females:
- Percentage of females in management occupations (except farmers):
Here: 4.6% city: 5.3%
- Percentage of females in business and financial operations occupations:
Here: 3.4% city: 6.1%
- Percentage of females in computer and mathematical occupations:
Here: 2.2% city: 0.3%
- Percentage of females in life, physical, and social science occupations:
Here: 3.8% city: 1.0%
- Percentage of females in community and social services occupations:
Here: 11.8% city: 1.2%
- Percentage of females in education, training, and library occupations:
Here: 3.0% city: 2.9%
- Percentage of females in healthcare practitioners and technical occupations:
Here: 13.1% city: 7.8%
- Percentage of females in service occupations:
Here: 19.1% city: 32.7%
- Percentage of females in sales and office occupations:
Here: 42.5% city: 33.9%
- Percentage of females in construction, extraction, and maintenance occupations:
Here: 1.7% city: 0.0%
- Percentage of females in production occupations:
Here: 6.6% city: 0.9%
- Percentage of females in transportation occupations:
Here: 7.6% city: 0.0%
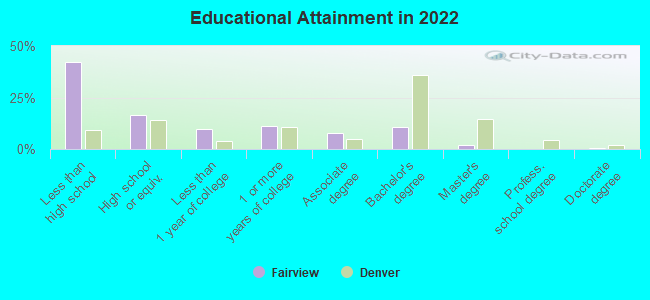
Education in this neighborhood (subdivision or community):
- Percentage of people 3 years and older in K-12 schools:
Fairview: 26.8% Gunnison: 10.1%
- Percentage of people 3 years and older in undergraduate colleges:
Fairview: 5.2% Gunnison: 26.2%
- Percentage of people 3 years and older in grad. or professional schools:
Fairview: 0.4% Gunnison: 1.4%
- Percentage of students K-12 enrolled in private schools:
Fairview: 18.3% Gunnison: 7.0%
Percentage of population below poverty level:
| Fairview: | 7.9% |
| Gunnison: | 20.6% |
Median year owner moved in (as recorded in 2022):
Median year renter moved in (as recorded in 2022):
| Fairview: | 2198 |
| Gunnison: | 2014 |
Median year renter moved in (as recorded in 2022):
| Fairview: | 2211 |
| Gunnison: | 2017 |
Percentage of married-couple families with both working:
| Fairview: | 35.3% |
| Gunnison: | 89.2% |
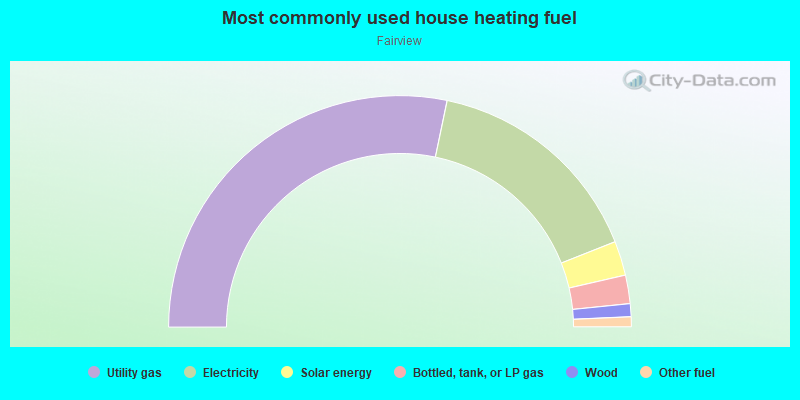
- 56.5%Utility gas
- 31.4%Electricity
- 4.8%Solar energy
- 4.0%Bottled, tank, or LP gas
- 1.8%Wood
- 1.4%Other fuel