Falls Park neighborhood in Sioux Falls, South Dakota (SD), 57103, 57104 detailed profile
Settings
X

Business Search - 14 Million verified businesses
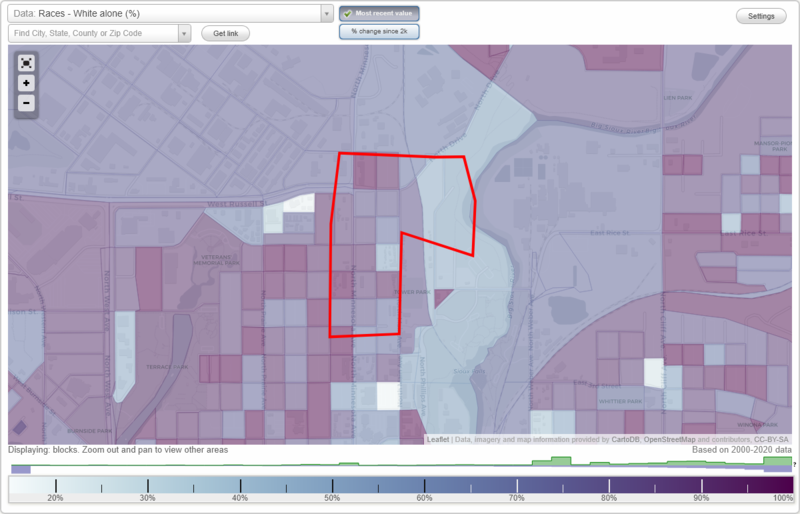
Area: 0.214 square miles
Population: 305
Population density:
| Falls Park: | 1,426 people per square mile |
| Sioux Falls: | 3,588 people per square mile |

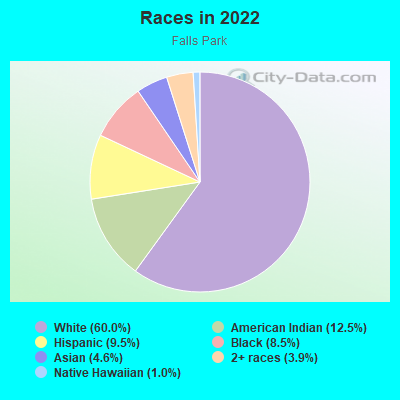
- 18360.0%White
- 3812.5%American Indian
- 299.5%Hispanic or Latino
- 268.5%Black
- 144.6%Asian
- 123.9%Two or more races
- 31.0%Native Hawaiian and Other
Pacific Islander
Distribution of median household income
![Distribution of median household income]()
- 7Less than $10,000
- 6$10,000 to $19,999
- 7$20,000 to $29,999
- 13$30,000 to $39,999
- 16$40,000 to $49,999
- 9$50,000 to $59,999
- 20$60,000 to $74,999
- 10$75,000 to $99,999
- 14$100,000 to $124,999
- 6$125,000 to $149,999
- 5$150,000 to $199,999
- 1$200,000 or more

Distribution of owner-occupied house/condo value
![Distribution of owner-occupied house/condo value]()
- 24Less than $50,000
- 34$50,000 to $99,999
- 19$100,000 to $149,999
- 11$150,000 to $199,999
- 13$200,000 to $249,999
- 2$250,000 to $299,999
- 3$300,000 to $399,999
- 1$400,000 to $499,999
- 8$500,000 to $749,999
- 1$750,000 to $999,999

Distribution of rent paid by renters
![Distribution of rent paid by renters]()
- 12Less than $100
- 3$200 to $299
- 7$300 to $399
- 3$400 to $499
- 7$500 to $599
- 2$600 to $699
- 5$700 to $799
- 9$800 to $899
- 3$900 to $999
- 3$1,000 to $1,249
- 2$1,250 to $1,499
- 14$1,500 to $1,999
- 7$2,000 or more

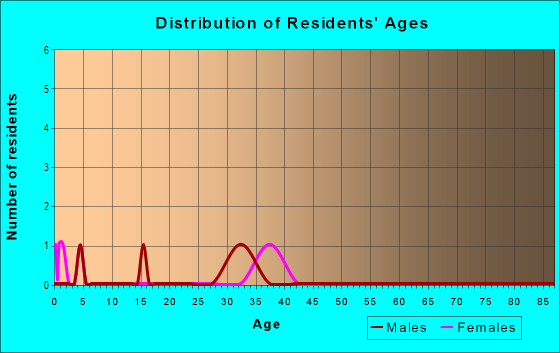
| Males: | 208 |
| Females: | 97 |
Males:
| This neighborhood: | 38.4 years |
| Whole city: | 35.1 years |
| This neighborhood: | 32.9 years |
| Whole city: | 38.0 years |
Average household size:
| Falls Park: | 2.4 people |
| Sioux Falls: | 2.3 people |
Percentage of family households:
| Falls Park: | 43.6% |
| Sioux Falls: | 42.9% |
| Here: | 44.6% |
| Sioux Falls: | 44.4% |
Percentage of married-couple families with children (among all households):
| Falls Park: | 17.5% |
| Sioux Falls: | 31.1% |
Percentage of single-mother households (among all households):
| Falls Park: | 16.8% |
| Sioux Falls: | 7.5% |
Percentage of never married males 15 years old and over:
Percentage of never married females 15 years old and over:
| Falls Park: | 38.6% |
| Sioux Falls: | 18.5% |
Percentage of never married females 15 years old and over:
| Falls Park: | 8.1% |
| city: | 13.9% |
Percentage of people that speak English not well or not at all:
| Falls Park: | 5.1% |
| Sioux Falls: | 1.6% |
Percentage of people born in this state:
Percentage of people born in another U.S. state:
Percentage of native residents but born outside the U.S.:
Percentage of foreign born residents:
| Here: | 55.0% |
| Sioux Falls: | 56.6% |
Percentage of people born in another U.S. state:
| Falls Park: | 30.7% |
| Sioux Falls: | 35.3% |
Percentage of native residents but born outside the U.S.:
| Here: | 0.3% |
| city: | 0.7% |
Percentage of foreign born residents:
| Here: | 14.0% |
| Sioux Falls: | 7.4% |
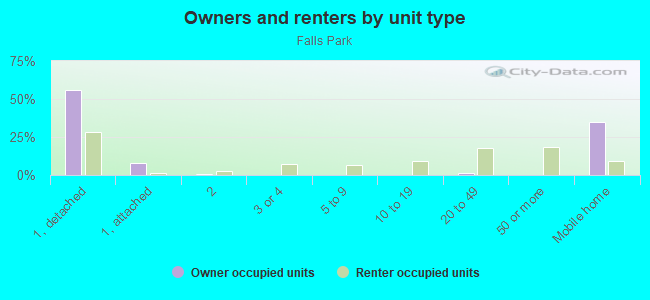
Owner-occupied
Renter-occupied

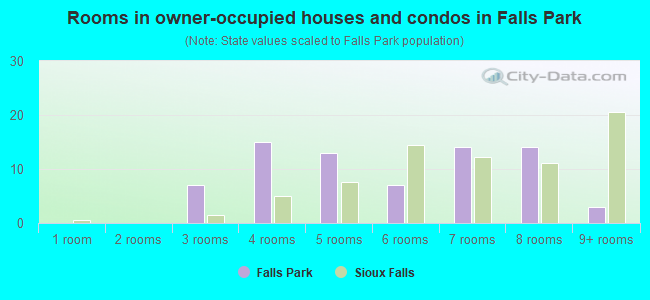
- Rooms in owner-occupied houses and condos in Falls Park
- 01 room
- 02 rooms
- 73 rooms
- 154 rooms
- 135 rooms
- 76 rooms
- 147 rooms
- 148 rooms
- 39+ rooms
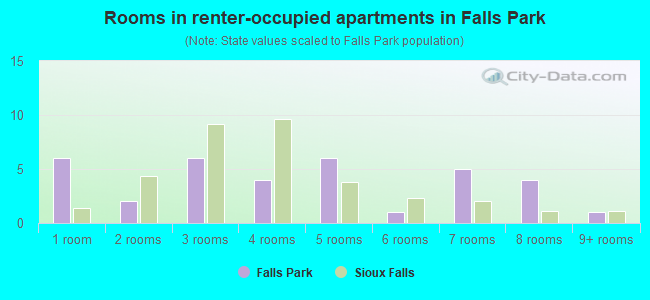
- Rooms in renter-occupied apartments in Falls Park
- 61 room
- 22 rooms
- 63 rooms
- 44 rooms
- 65 rooms
- 16 rooms
- 57 rooms
- 48 rooms
- 19+ rooms
Owner-occupied
Renter-occupied
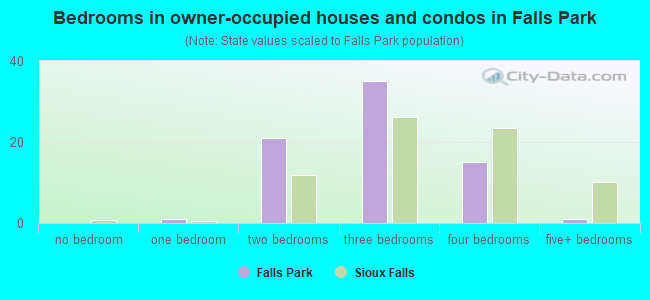
- Bedrooms in owner-occupied houses and condos in Falls Park
- 0no bedroom
- 11 bedroom
- 212 bedrooms
- 353 bedrooms
- 154 bedrooms
- 15+ bedrooms
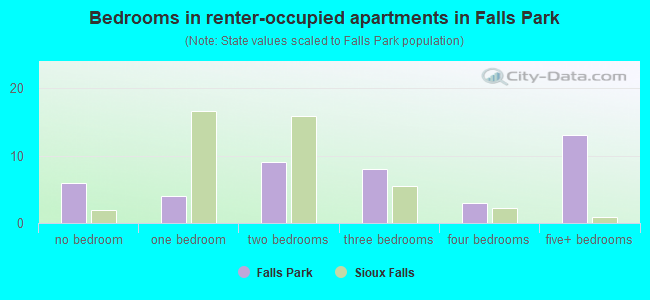
- Bedrooms in renter-occupied apartments in Falls Park
- 6no bedroom
- 41 bedroom
- 92 bedrooms
- 83 bedrooms
- 34 bedrooms
- 135+ bedrooms
Average number of cars or other vehicles available in houses/condos:
Average number of cars or other vehicles available in apartments:
| This neighborhood: | 2.6 |
| Sioux Falls: | 2.1 |
Average number of cars or other vehicles available in apartments:
| Here: | 2.0 |
| city: | 1.3 |
Percentage of units with a mortgage:
| Falls Park: | 71.7% |
| Sioux Falls: | 67.3% |
Housing prices:
- Average estimated value of detached houses in 2022 (65.9% of all units):
Falls Park: $120,613 South Dakota: $303,134
- Average estimated value of mobile home in 2022 (31.8% of all units):
Falls Park: $70,767 South Dakota: $82,732
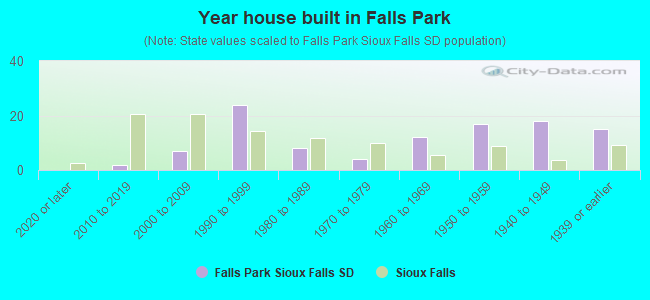
- Year house built in Falls Park
- 02020 or later
- 22010 to 2019
- 72000 to 2009
- 241990 to 1999
- 81980 to 1989
- 41970 to 1979
- 121960 to 1969
- 171950 to 1959
- 181940 to 1949
- 151939 or earlier
City-data.com crime index for city in 2020 (higher means more crime):
| City: | 324.5 |
| U.S. average: | 219.5 |
Travel time to work (commute)
![Travel time to work (commute)]()
- 6Less than 5 minutes
- 295 to 9 minutes
- 3110 to 14 minutes
- 2015 to 19 minutes
- 1420 to 24 minutes
- 325 to 29 minutes
- 830 to 34 minutes
- 140 to 44 minutes
- 145 to 59 minutes

Means of transportation to work
![Means of transportation to work]()
- 85.8%98Drove a car alone
- 4.4%5Carpooled
- 10.5%12Bus
- 3.5%4Motorcycle
- 0.9%1Walked
- 2.6%3Other means
- 12.3%14Worked at home

Time leaving home to go to work
![Time leaving home to go to work]()
- 1012:00 a.m. to 4:59 a.m.
- 35:00 a.m. to 5:29 a.m.
- 85:30 a.m. to 5:59 a.m.
- 86:00 a.m. to 6:29 a.m.
- 106:30 a.m. to 6:59 a.m.
- 127:00 a.m. to 7:29 a.m.
- 207:30 a.m. to 7:59 a.m.
- 78:00 a.m. to 8:29 a.m.
- 38:30 a.m. to 8:59 a.m.
- 19:00 a.m. to 9:59 a.m.
- 210:00 a.m. to 10:59 a.m.
- 211:00 a.m. to 11:59 a.m.
- 1912:00 p.m. to 3:59 p.m.
- 84:00 p.m. to 11:59 p.m.

Occupations of males:
- Percentage of males in management occupations (except farmers):
Here: 9.2% city: 12.4%
- Percentage of males in business and financial operations occupations:
Here: 2.9% city: 4.8%
- Percentage of males in service occupations:
Here: 5.1% city: 12.3%
- Percentage of males in sales and office occupations:
Here: 16.8% city: 16.6%
- Percentage of males in farming, fishing, and forestry occupations:
Here: 2.1% city: 0.7%
- Percentage of males in construction, extraction, and maintenance occupations:
Here: 12.7% city: 7.8%
- Percentage of males in production occupations:
Here: 23.4% city: 9.0%
- Percentage of males in transportation occupations:
Here: 6.8% city: 6.2%
- Percentage of males in material moving occupations:
Here: 9.0% city: 6.3%
Occupations of females:
- Percentage of females in management occupations (except farmers):
Here: 4.0% city: 8.4%
- Percentage of females in business and financial operations occupations:
Here: 9.7% city: 6.2%
- Percentage of females in computer and mathematical occupations:
Here: 6.4% city: 2.1%
- Percentage of females in community and social services occupations:
Here: 1.0% city: 2.7%
- Percentage of females in education, training, and library occupations:
Here: 13.5% city: 7.4%
- Percentage of females in arts, design, entertainment, sports, and media occupations:
Here: 3.8% city: 1.8%
- Percentage of females in healthcare practitioners and technical occupations:
Here: 6.6% city: 14.9%
- Percentage of females in service occupations:
Here: 14.7% city: 20.9%
- Percentage of females in sales and office occupations:
Here: 14.7% city: 26.5%
- Percentage of females in farming, fishing, and forestry occupations:
Here: 1.9% city: 0.2%
- Percentage of females in production occupations:
Here: 19.2% city: 4.3%
- Percentage of females in transportation occupations:
Here: 5.8% city: 0.5%
- Percentage of females in material moving occupations:
Here: 8.4% city: 1.6%
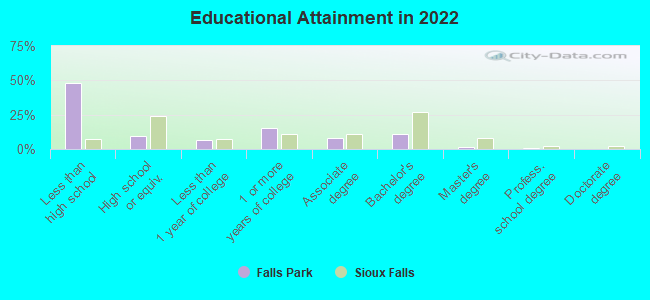
Education in this neighborhood (subdivision or community):
- Percentage of people 3 years and older in K-12 schools:
Falls Park: 10.4% Sioux Falls: 17.5%
- Percentage of people 3 years and older in undergraduate colleges:
Falls Park: 1.7% Sioux Falls: 4.1%
- Percentage of people 3 years and older in grad. or professional schools:
Falls Park: 0.0% Sioux Falls: 1.4%
- Percentage of students K-12 enrolled in private schools:
Falls Park: 9.7% Sioux Falls: 15.2%
Percentage of population below poverty level:
| Falls Park: | 20.2% |
| Sioux Falls: | 10.1% |
Percentage of married-couple families with both working:
| Falls Park: | 108.2% |
| Sioux Falls: | 85.2% |
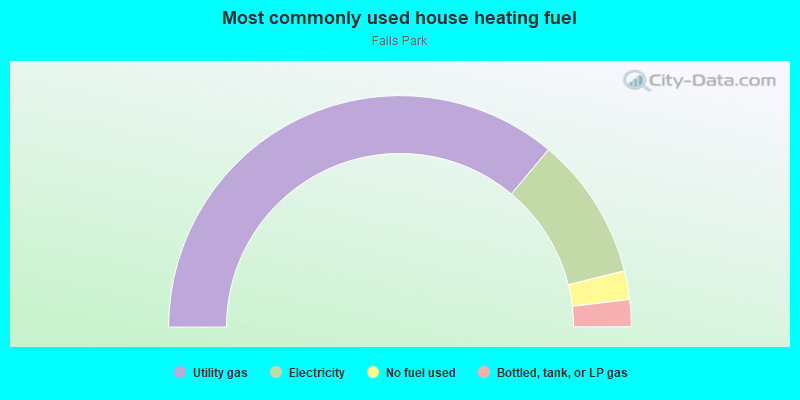
- 72.2%Utility gas
- 20.0%Electricity
- 4.0%No fuel used
- 3.8%Bottled, tank, or LP gas
Roads and streets:
E Falls Park Dr
Length: 0.55 miles
Directions: E-W, N-S, SW-NE
Address range: 100 to 1099
Directions: E-W, N-S, SW-NE
Address range: 100 to 1099
N 1st Ave
Length: 0.13 miles
Direction: N-S
Address range: 1000 to 1199
Direction: N-S
Address range: 1000 to 1199
E 3rd St
Length: 0.09 miles
Direction: E-W
Address range: 500 to 581
Direction: E-W
Address range: 500 to 581
E McClellan St
Length: 0.09 miles
Direction: E-W
Address range: 100 to 199
Direction: E-W
Address range: 100 to 199
N 2nd Ave
Length: 0.07 miles
Direction: N-S
Direction: N-S
N Phillips Ave
Length: 0.06 miles
Direction: N-S
Address range: 940 to 1121
Direction: N-S
Address range: 940 to 1121
Railroad features:
Burlington Northern Santa Fe Rlwy
Length: 1.05 miles
Directions: N-S, SE-NW, SW-NE
Directions: N-S, SE-NW, SW-NE
Burlington Northern Santa Fe Rlwy (South Dakota State RR)
Length: 0.40 miles
Direction: SE-NW
Direction: SE-NW
Other features:
Big Sioux Riv
Length: 0.45 miles
Directions: E-W, N-S, SE-NW, SW-NE
Directions: E-W, N-S, SE-NW, SW-NE