Fritters Lane neighborhood in Stafford, Virginia (VA), 22554 detailed profile
Settings
X


Area: 0.081 square miles
Population: 200
Population density: 2,462 people per square mile

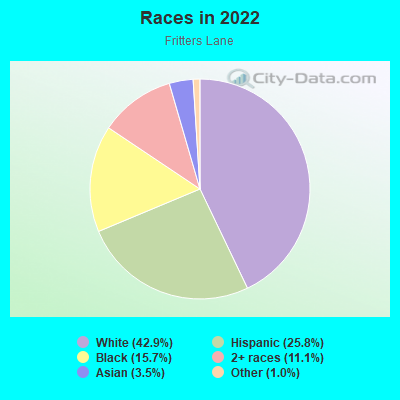
- 8542.9%White
- 5125.8%Hispanic or Latino
- 3115.7%Black
- 2211.1%Two or more races
- 73.5%Asian
- 21.0%Some other race
Median household income in 2022:
| Fritters Lane: | $151,071 |
| Virginia: | $85,873 |
Distribution of median household income
![Distribution of median household income]()
- 1Less than $10,000
- 2$10,000 to $19,999
- 2$20,000 to $29,999
- 7$30,000 to $39,999
- 4$40,000 to $49,999
- 5$50,000 to $59,999
- 2$60,000 to $74,999
- 8$75,000 to $99,999
- 8$100,000 to $124,999
- 4$125,000 to $149,999
- 10$150,000 to $199,999
- 20$200,000 or more

Distribution of owner-occupied house/condo value
![Distribution of owner-occupied house/condo value]()
- 2Less than $50,000
- 1$150,000 to $199,999
- 3$200,000 to $249,999
- 3$250,000 to $299,999
- 14$300,000 to $399,999
- 27$400,000 to $499,999
- 7$500,000 to $749,999
- 1$750,000 to $999,999

Distribution of rent paid by renters
![Distribution of rent paid by renters]()
- 3$1,250 to $1,499
- 4$1,500 to $1,999
- 3$2,000 or more

Median rent in 2022:
| Fritters Lane: | $1,954 |
| Virginia: | $1,270 |
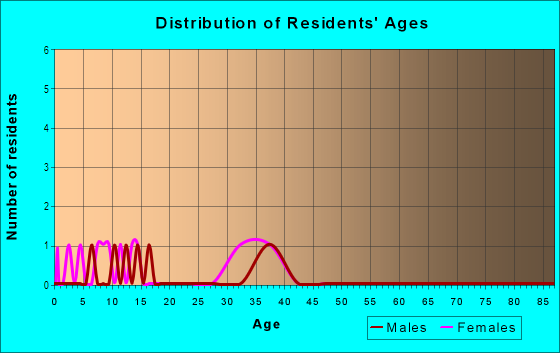
| Males: | 104 |
| Females: | 96 |
| Males: | 27.0 years |
| Females: | 40.1 years |
Average household size:
| Fritters Lane: | 3.6 people |
| Virginia: | 2.5 people |
Percentage of family households:
| Fritters Lane: | 69.1% |
| Virginia: | 45.8% |
| Here: | 65.5% |
| Virginia: | 48.6% |
Percentage of married-couple families with children (among all households):
| Fritters Lane: | 22.2% |
| Virginia: | 54.3% |
Percentage of single-mother households (among all households):
| Fritters Lane: | 5.9% |
| Virginia: | 8.2% |
Percentage of never married males 15 years old and over:
Percentage of never married females 15 years old and over:
| Fritters Lane: | 15.8% |
| Virginia: | 17.6% |
Percentage of never married females 15 years old and over:
| Fritters Lane: | 6.4% |
| Virginia: | 15.6% |
Percentage of people that speak English not well or not at all:
| Fritters Lane: | 5.7% |
| Virginia: | 2.6% |
Percentage of people born in this state:
Percentage of people born in another U.S. state:
Percentage of native residents but born outside the U.S.:
Percentage of foreign born residents:
| Here: | 37.7% |
| Virginia: | 48.7% |
Percentage of people born in another U.S. state:
| Fritters Lane: | 39.1% |
| Virginia: | 36.4% |
Percentage of native residents but born outside the U.S.:
| Here: | 4.6% |
| Virginia: | 2.1% |
Percentage of foreign born residents:
| Here: | 18.7% |
| Virginia: | 12.7% |
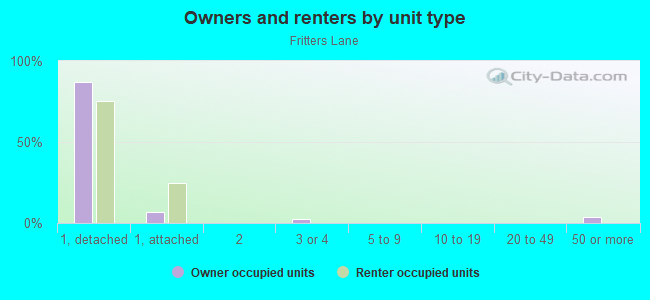
Owner-occupied
Renter-occupied

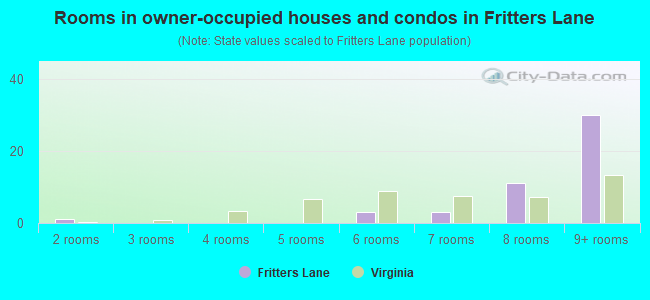
- Rooms in owner-occupied houses and condos in Fritters Lane
- 01 room
- 12 rooms
- 03 rooms
- 04 rooms
- 05 rooms
- 36 rooms
- 37 rooms
- 118 rooms
- 309+ rooms
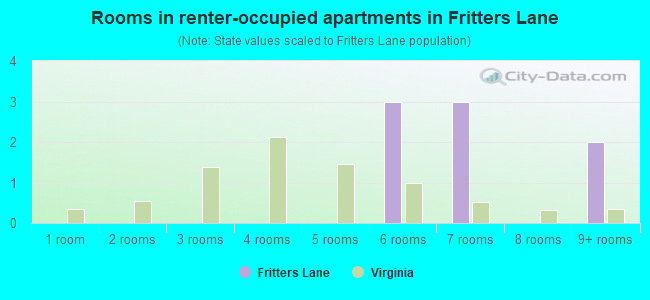
- Rooms in renter-occupied apartments in Fritters Lane
- 01 room
- 02 rooms
- 03 rooms
- 04 rooms
- 05 rooms
- 36 rooms
- 37 rooms
- 08 rooms
- 29+ rooms
Owner-occupied
Renter-occupied
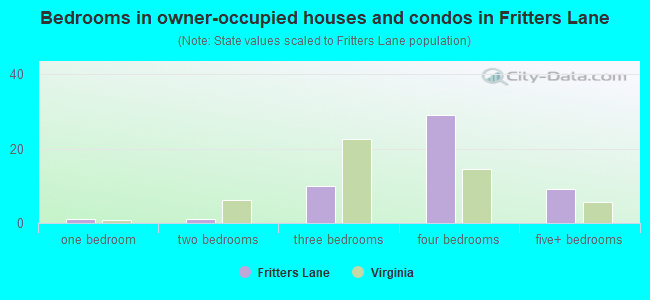
- Bedrooms in owner-occupied houses and condos in Fritters Lane
- 0no bedroom
- 11 bedroom
- 12 bedrooms
- 103 bedrooms
- 294 bedrooms
- 95+ bedrooms
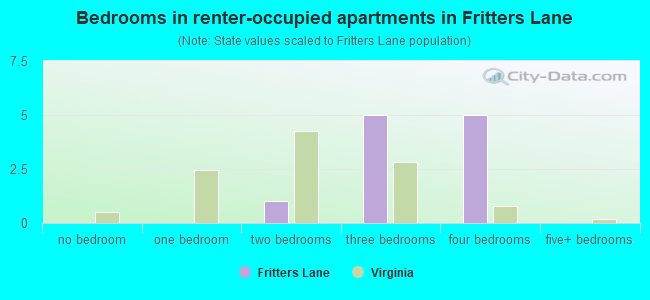
- Bedrooms in renter-occupied apartments in Fritters Lane
- 0no bedroom
- 01 bedroom
- 12 bedrooms
- 53 bedrooms
- 54 bedrooms
- 05+ bedrooms
Average number of cars or other vehicles available in houses/condos:
Average number of cars or other vehicles available in apartments:
| This neighborhood: | 2.5 |
| Virginia: | 2.2 |
Average number of cars or other vehicles available in apartments:
| Here: | 2.4 |
| Virginia: | 1.4 |
Percentage of units with a mortgage:
| Fritters Lane: | 87.2% |
| Virginia: | 66.9% |
Housing prices:
- Average estimated value of detached houses in 2022 (91.1% of all units):
Fritters Lane: $437,656 Virginia: $472,865
- Average estimated value of townhouses or other attached units in 2022 (8.9% of all units):
This neighborhood: $367,915 Virginia: $457,437
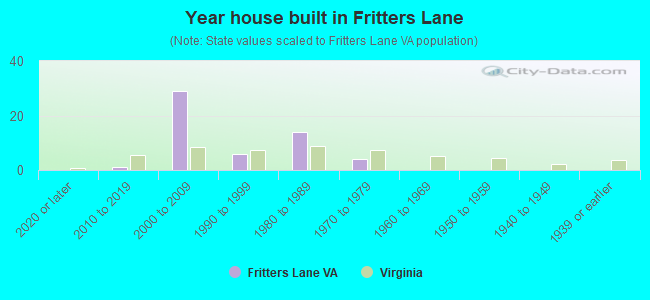
- Year house built in Fritters Lane
- 02020 or later
- 12010 to 2019
- 292000 to 2009
- 61990 to 1999
- 141980 to 1989
- 41970 to 1979
- 01960 to 1969
- 01950 to 1959
- 01940 to 1949
- 01939 or earlier
Travel time to work (commute)
![Travel time to work (commute)]()
- 1Less than 5 minutes
- 75 to 9 minutes
- 610 to 14 minutes
- 915 to 19 minutes
- 920 to 24 minutes
- 425 to 29 minutes
- 1230 to 34 minutes
- 235 to 39 minutes
- 740 to 44 minutes
- 1145 to 59 minutes
- 1860 to 89 minutes
- 790 or more minutes

Means of transportation to work
![Means of transportation to work]()
- 63.4%68Drove a car alone
- 16.8%18Carpooled
- 17.7%19Worked at home

Time leaving home to go to work
![Time leaving home to go to work]()
- 1112:00 a.m. to 4:59 a.m.
- 85:00 a.m. to 5:29 a.m.
- 65:30 a.m. to 5:59 a.m.
- 106:00 a.m. to 6:29 a.m.
- 96:30 a.m. to 6:59 a.m.
- 107:00 a.m. to 7:29 a.m.
- 57:30 a.m. to 7:59 a.m.
- 68:00 a.m. to 8:29 a.m.
- 88:30 a.m. to 8:59 a.m.
- 59:00 a.m. to 9:59 a.m.
- 310:00 a.m. to 10:59 a.m.
- 1112:00 p.m. to 3:59 p.m.
- 44:00 p.m. to 11:59 p.m.

Occupations of males:
- Percentage of males in management occupations (except farmers):
Here: 19.4% Virginia: 13.4%
- Percentage of males in business and financial operations occupations:
Here: 4.6% Virginia: 6.5%
- Percentage of males in computer and mathematical occupations:
Here: 9.5% Virginia: 8.6%
- Percentage of males in architecture and engineering occupations:
Here: 3.1% Virginia: 3.7%
- Percentage of males in life, physical, and social science occupations:
Here: 2.2% Virginia: 1.3%
- Percentage of males in legal occupations:
Here: 2.1% Virginia: 1.6%
- Percentage of males in education, training, and library occupations:
Here: 11.5% Virginia: 3.3%
- Percentage of males in arts, design, entertainment, sports, and media occupations:
Here: 1.2% Virginia: 1.9%
- Percentage of males in service occupations:
Here: 7.9% Virginia: 13.3%
- Percentage of males in sales and office occupations:
Here: 10.1% Virginia: 13.4%
- Percentage of males in construction, extraction, and maintenance occupations:
Here: 2.9% Virginia: 8.2%
- Percentage of males in production occupations:
Here: 1.9% Virginia: 5.5%
- Percentage of males in transportation occupations:
Here: 14.6% Virginia: 5.5%
- Percentage of males in material moving occupations:
Here: 1.0% Virginia: 4.3%
Occupations of females:
- Percentage of females in management occupations (except farmers):
Here: 9.0% Virginia: 10.8%
- Percentage of females in business and financial operations occupations:
Here: 14.9% Virginia: 8.3%
- Percentage of females in computer and mathematical occupations:
Here: 5.3% Virginia: 3.6%
- Percentage of females in architecture and engineering occupations:
Here: 3.5% Virginia: 0.8%
- Percentage of females in life, physical, and social science occupations:
Here: 1.3% Virginia: 1.3%
- Percentage of females in community and social services occupations:
Here: 6.1% Virginia: 2.7%
- Percentage of females in education, training, and library occupations:
Here: 13.3% Virginia: 10.1%
- Percentage of females in healthcare practitioners and technical occupations:
Here: 9.0% Virginia: 9.1%
- Percentage of females in service occupations:
Here: 19.6% Virginia: 18.5%
- Percentage of females in sales and office occupations:
Here: 15.1% Virginia: 24.7%
- Percentage of females in transportation occupations:
Here: 1.3% Virginia: 1.2%
- Percentage of females in material moving occupations:
Here: 6.4% Virginia: 1.7%
Percentage of people 16-64 in Armed Forces:
| Fritters Lane: | 1.7% |
| Virginia: | 2.5% |
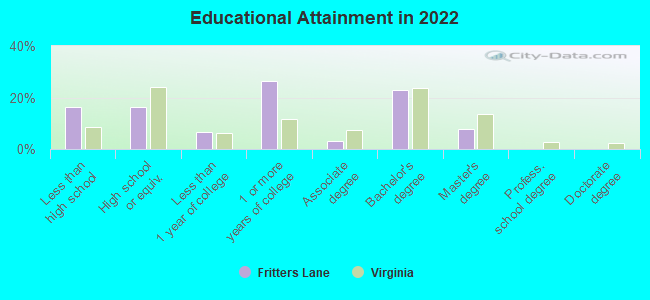
Education in this neighborhood (subdivision or community):
- Percentage of people 3 years and older in K-12 schools:
Fritters Lane: 31.1% Virginia: 16.3%
- Percentage of people 3 years and older in undergraduate colleges:
Fritters Lane: 3.1% Virginia: 5.4%
- Percentage of people 3 years and older in grad. or professional schools:
Fritters Lane: 1.5% Virginia: 1.8%
- Percentage of students K-12 enrolled in private schools:
Fritters Lane: 6.6% Virginia: 12.5%
Percentage of population below poverty level:
| Fritters Lane: | 7.5% |
| Virginia: | 10.6% |
Median year owner moved in (as recorded in 2022):
Median year renter moved in (as recorded in 2022):
| Fritters Lane: | 2012 |
| Virginia: | 2011 |
Median year renter moved in (as recorded in 2022):
| Fritters Lane: | 2018 |
| Virginia: | 2020 |
Percentage of married-couple families with both working:
| Fritters Lane: | 55.2% |
| Virginia: | 73.3% |
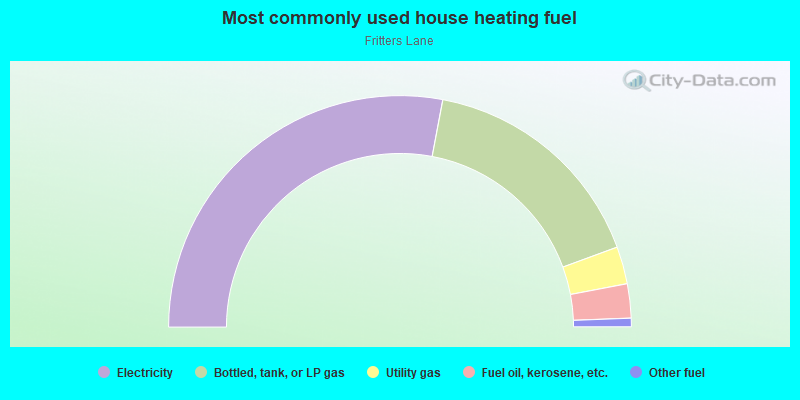
- 56.0%Electricity
- 32.9%Bottled, tank, or LP gas
- 5.2%Utility gas
- 4.8%Fuel oil, kerosene, etc.
- 1.2%Other fuel
Roads and streets:
Glendale Dr
Length: 0.21 miles
Directions: E-W, N-S, SE-NW, SW-NE
Address range: 47 to 99
Directions: E-W, N-S, SE-NW, SW-NE
Address range: 47 to 99