Grant Park neighborhood in Tampa, Florida (FL), 33619 detailed profile
Settings
X

Business Search - 14 Million verified businesses
Area: 0.335 square miles
Population: 1,472
Population density:
| Grant Park: | 4,391 people per square mile |
| Tampa: | 3,553 people per square mile |

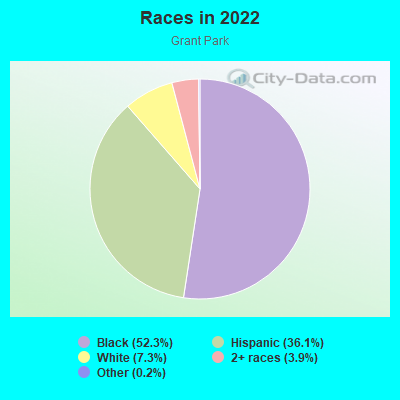
- 77352.3%Black
- 53336.1%Hispanic or Latino
- 1087.3%White
- 583.9%Two or more races
- 30.2%Some other race
- 10.07%American Indian
- 10.07%Asian
Distribution of median household income
![Distribution of median household income]()
- 101Less than $10,000
- 229$10,000 to $19,999
- 131$20,000 to $29,999
- 70$30,000 to $39,999
- 34$40,000 to $49,999
- 120$50,000 to $59,999
- 55$60,000 to $74,999
- 40$75,000 to $99,999
- 30$100,000 to $124,999
- 5$125,000 to $149,999
- 26$150,000 to $199,999
- 6$200,000 or more

Distribution of owner-occupied house/condo value
![Distribution of owner-occupied house/condo value]()
- 74Less than $50,000
- 153$50,000 to $99,999
- 62$100,000 to $149,999
- 288$150,000 to $199,999
- 87$200,000 to $249,999
- 38$250,000 to $299,999
- 17$300,000 to $399,999
- 28$750,000 to $999,999
- 2$1,000,000 or more

Distribution of rent paid by renters
![Distribution of rent paid by renters]()
- 7Less than $100
- 7$200 to $299
- 3$400 to $499
- 45$600 to $699
- 2$700 to $799
- 18$800 to $899
- 22$900 to $999
- 55$1,000 to $1,249
- 39$1,250 to $1,499
- 5$1,500 to $1,999
- 2$2,000 or more

Median rent in 2022:
| Grant Park: | $1,088 |
| Tampa: | $1,444 |
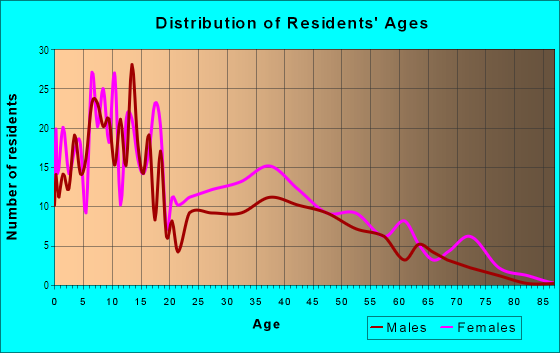
| Males: | 547 |
| Females: | 925 |
Males:
| This neighborhood: | 40.5 years |
| Whole city: | 35.5 years |
| This neighborhood: | 45.2 years |
| Whole city: | 35.1 years |
Average household size:
| Grant Park: | 2.4 people |
| Tampa: | 2.3 people |
Percentage of family households:
| Grant Park: | 33.0% |
| Tampa: | 39.9% |
| Here: | 22.8% |
| Tampa: | 35.4% |
Percentage of married-couple families with children (among all households):
| Grant Park: | 25.1% |
| Tampa: | 25.1% |
Percentage of single-mother households (among all households):
| Grant Park: | 28.8% |
| Tampa: | 12.2% |
Percentage of never married males 15 years old and over:
Percentage of never married females 15 years old and over:
| Grant Park: | 13.5% |
| Tampa: | 23.6% |
Percentage of never married females 15 years old and over:
| Grant Park: | 24.3% |
| city: | 20.9% |
Percentage of people that speak English not well or not at all:
| Grant Park: | 2.4% |
| Tampa: | 6.4% |
Percentage of people born in this state:
Percentage of people born in another U.S. state:
Percentage of native residents but born outside the U.S.:
Percentage of foreign born residents:
| Here: | 62.1% |
| Tampa: | 39.7% |
Percentage of people born in another U.S. state:
| Grant Park: | 19.3% |
| Tampa: | 35.7% |
Percentage of native residents but born outside the U.S.:
| Here: | 3.6% |
| city: | 4.6% |
Percentage of foreign born residents:
| Here: | 15.1% |
| Tampa: | 20.0% |
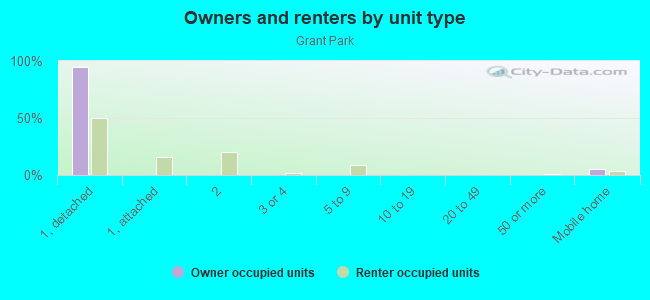
Owner-occupied
Renter-occupied

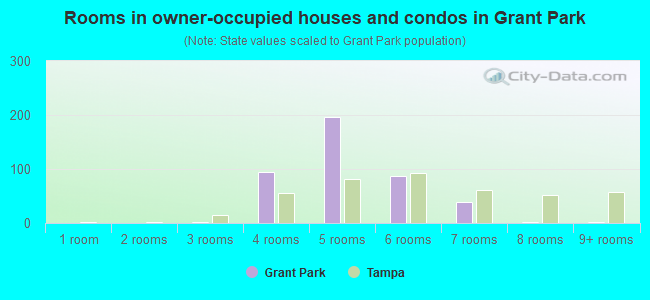
- Rooms in owner-occupied houses and condos in Grant Park
- 01 room
- 02 rooms
- 13 rooms
- 954 rooms
- 1975 rooms
- 876 rooms
- 397 rooms
- 28 rooms
- 19+ rooms
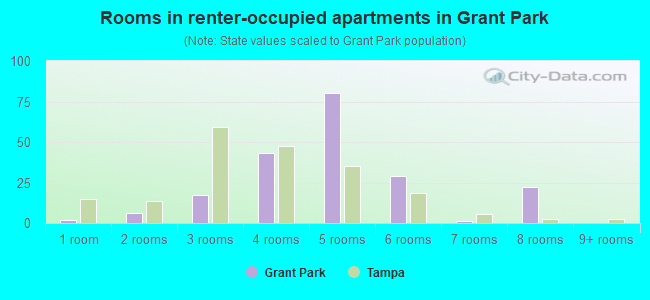
- Rooms in renter-occupied apartments in Grant Park
- 21 room
- 62 rooms
- 173 rooms
- 434 rooms
- 805 rooms
- 296 rooms
- 17 rooms
- 228 rooms
- 09+ rooms
Owner-occupied
Renter-occupied
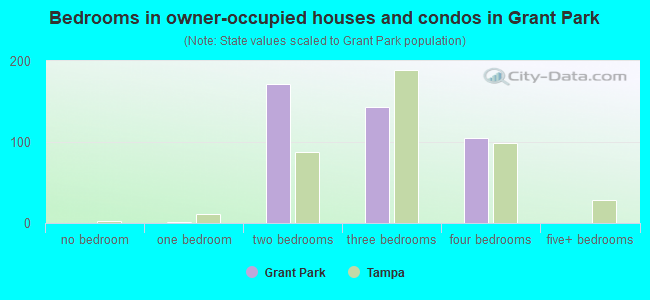
- Bedrooms in owner-occupied houses and condos in Grant Park
- 0no bedroom
- 11 bedroom
- 1712 bedrooms
- 1433 bedrooms
- 1054 bedrooms
- 05+ bedrooms
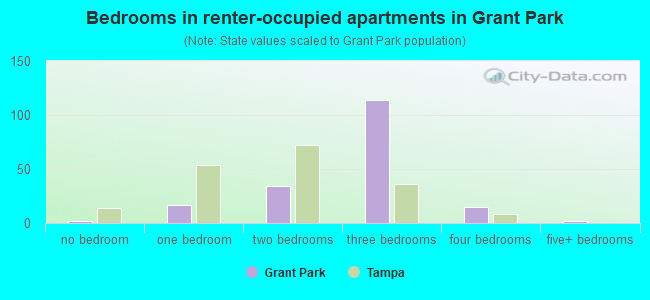
- Bedrooms in renter-occupied apartments in Grant Park
- 2no bedroom
- 171 bedroom
- 342 bedrooms
- 1143 bedrooms
- 154 bedrooms
- 25+ bedrooms
Average number of cars or other vehicles available in houses/condos:
Average number of cars or other vehicles available in apartments:
| This neighborhood: | 1.2 |
| Tampa: | 1.9 |
Average number of cars or other vehicles available in apartments:
| Here: | 1.5 |
| city: | 1.3 |
Percentage of units with a mortgage:
| Grant Park: | 80.7% |
| Tampa: | 65.8% |
Average estimated value of detached houses in 2022 (87.3% of all units):
| Grant Park: | $180,788 |
| Tampa: | $505,567 |
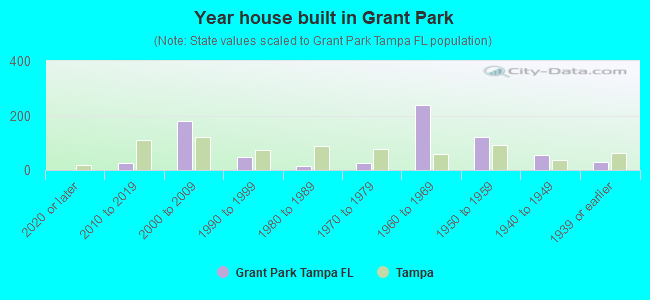
- Year house built in Grant Park
- 02020 or later
- 262010 to 2019
- 1792000 to 2009
- 471990 to 1999
- 151980 to 1989
- 241970 to 1979
- 2401960 to 1969
- 1201950 to 1959
- 551940 to 1949
- 291939 or earlier
City-data.com crime index for city in 2020 (higher means more crime):
| City: | 212.7 |
| U.S. average: | 219.5 |
Travel time to work (commute)
![Travel time to work (commute)]()
- 465 to 9 minutes
- 5310 to 14 minutes
- 8415 to 19 minutes
- 11620 to 24 minutes
- 1925 to 29 minutes
- 9230 to 34 minutes
- 635 to 39 minutes
- 2640 to 44 minutes
- 4645 to 59 minutes
- 6660 to 89 minutes
- 3390 or more minutes

Means of transportation to work
![Means of transportation to work]()
- 60.0%314Drove a car alone
- 15.1%79Carpooled
- 11.5%60Bus
- 1.3%7Bicycle
- 2.9%15Walked
- 4.2%22Other means
- 11.1%58Worked at home

Time leaving home to go to work
![Time leaving home to go to work]()
- 1612:00 a.m. to 4:59 a.m.
- 145:00 a.m. to 5:29 a.m.
- 205:30 a.m. to 5:59 a.m.
- 536:00 a.m. to 6:29 a.m.
- 1066:30 a.m. to 6:59 a.m.
- 1227:00 a.m. to 7:29 a.m.
- 327:30 a.m. to 7:59 a.m.
- 1208:00 a.m. to 8:29 a.m.
- 328:30 a.m. to 8:59 a.m.
- 69:00 a.m. to 9:59 a.m.
- 1410:00 a.m. to 10:59 a.m.
- 111:00 a.m. to 11:59 a.m.
- 1012:00 p.m. to 3:59 p.m.
- 604:00 p.m. to 11:59 p.m.

Occupations of males:
- Percentage of males in education, training, and library occupations:
Here: 1.6% city: 2.2%
- Percentage of males in service occupations:
Here: 26.6% city: 13.7%
- Percentage of males in sales and office occupations:
Here: 2.9% city: 16.3%
- Percentage of males in construction, extraction, and maintenance occupations:
Here: 18.9% city: 8.2%
- Percentage of males in production occupations:
Here: 6.4% city: 3.7%
- Percentage of males in transportation occupations:
Here: 21.1% city: 5.8%
Occupations of females:
- Percentage of females in management occupations (except farmers):
Here: 5.3% city: 10.9%
- Percentage of females in business and financial operations occupations:
Here: 10.7% city: 8.5%
- Percentage of females in community and social services occupations:
Here: 5.2% city: 2.1%
- Percentage of females in legal occupations:
Here: 1.7% city: 2.7%
- Percentage of females in education, training, and library occupations:
Here: 4.3% city: 7.2%
- Percentage of females in arts, design, entertainment, sports, and media occupations:
Here: 4.2% city: 2.1%
- Percentage of females in healthcare practitioners and technical occupations:
Here: 7.5% city: 10.3%
- Percentage of females in service occupations:
Here: 30.5% city: 19.1%
- Percentage of females in sales and office occupations:
Here: 23.4% city: 27.1%
- Percentage of females in farming, fishing, and forestry occupations:
Here: 2.2% city: 0.1%
- Percentage of females in production occupations:
Here: 2.3% city: 2.0%
- Percentage of females in material moving occupations:
Here: 4.8% city: 1.4%
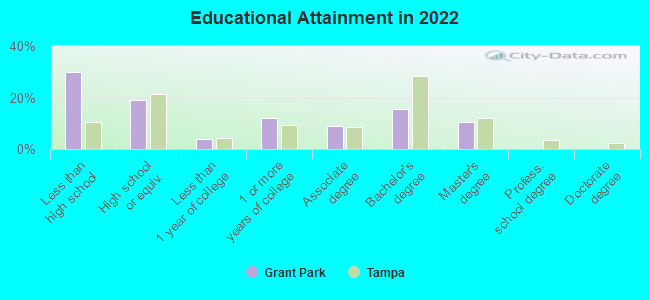
Education in this neighborhood (subdivision or community):
- Percentage of people 3 years and older in K-12 schools:
Grant Park: 30.0% Tampa: 14.3%
- Percentage of people 3 years and older in undergraduate colleges:
Grant Park: 3.4% Tampa: 7.8%
- Percentage of people 3 years and older in grad. or professional schools:
Grant Park: 0.0% Tampa: 2.0%
- Percentage of students K-12 enrolled in private schools:
Grant Park: 16.6% Tampa: 12.5%
Percentage of population below poverty level:
| Grant Park: | 29.5% |
| Tampa: | 16.3% |
Median year owner moved in (as recorded in 2022):
Median year renter moved in (as recorded in 2022):
| Grant Park: | 1997 |
| Tampa: | 2013 |
Median year renter moved in (as recorded in 2022):
| Grant Park: | 2014 |
| Tampa: | 2020 |
Percentage of married-couple families with both working:
| Grant Park: | 18.5% |
| Tampa: | 70.4% |
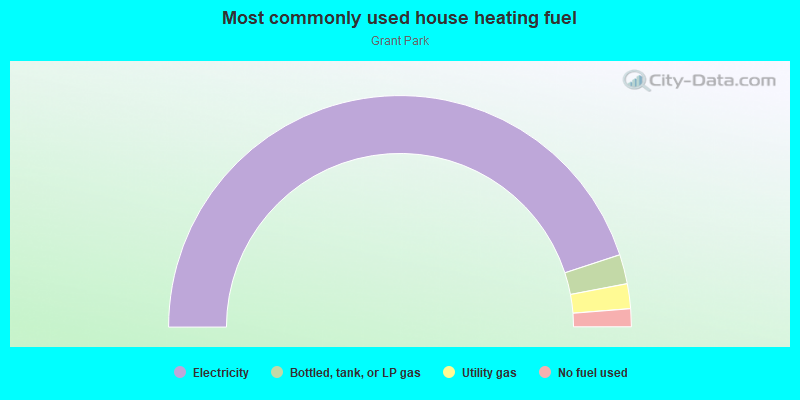
- 89.9%Electricity
- 4.1%Bottled, tank, or LP gas
- 3.5%Utility gas
- 2.5%No fuel used
Roads and streets:
E 32nd Ave
Length: 0.79 miles
Direction: E-W
Address range: 5000 to 5899
Direction: E-W
Address range: 5000 to 5899
E 30th Ave
Length: 0.77 miles
Direction: E-W
Address range: 5000 to 5899
Direction: E-W
Address range: 5000 to 5899
E 28th Ave
Length: 0.51 miles
Direction: E-W
Address range: 5000 to 5599
Direction: E-W
Address range: 5000 to 5599
E 26th Ave
Length: 0.45 miles
Direction: E-W
Address range: 2598 to 5499
Direction: E-W
Address range: 2598 to 5499
N Whittier St
Length: 0.38 miles
Direction: N-S
Address range: 3400 to 3799
Direction: N-S
Address range: 3400 to 3799
N 54th St
Length: 0.37 miles
Direction: N-S
Address range: 3400 to 3799
Direction: N-S
Address range: 3400 to 3799
N 53rd St
Length: 0.37 miles
Direction: N-S
Address range: 3400 to 3799
Direction: N-S
Address range: 3400 to 3799
Phillips St
Length: 0.37 miles
Direction: N-S
Address range: 3400 to 3799
Direction: N-S
Address range: 3400 to 3799
N 51st St
Length: 0.37 miles
Direction: N-S
Address range: 3400 to 3799
Direction: N-S
Address range: 3400 to 3799
N Garrison St
Length: 0.37 miles
Direction: N-S
Address range: 3400 to 3799
Direction: N-S
Address range: 3400 to 3799
Temple St
Length: 0.37 miles
Direction: N-S
Address range: 3400 to 3799
Direction: N-S
Address range: 3400 to 3799
N 52nd St
Length: 0.37 miles
Direction: N-S
Address range: 3400 to 3799
Direction: N-S
Address range: 3400 to 3799
N 55th St
Length: 0.37 miles
Direction: N-S
Address range: 3400 to 3799
Direction: N-S
Address range: 3400 to 3799
N 56th St
Length: 0.33 miles
Direction: N-S
Address range: 3301 to 3799
Direction: N-S
Address range: 3301 to 3799
N 58th St
Length: 0.26 miles
Direction: N-S
Address range: 3700 to 3899
Direction: N-S
Address range: 3700 to 3899
Terra Ceia Dr
Length: 0.19 miles
Directions: E-W, N-S, SW-NE
Address range: 5600 to 5699
Directions: E-W, N-S, SW-NE
Address range: 5600 to 5699
Carroway St
Length: 0.18 miles
Directions: N-S, SW-NE
Address range: 3600 to 3799
Directions: N-S, SW-NE
Address range: 3600 to 3799
E 29th Ave
Length: 0.16 miles
Direction: E-W
Address range: 5600 to 5699
Direction: E-W
Address range: 5600 to 5699
Wiggings Leaf St
Length: 0.15 miles
Direction: N-S
Address range: 3718 to 3808
Direction: N-S
Address range: 3718 to 3808
Smith Tree St
Length: 0.14 miles
Direction: N-S
Address range: 3700 to 3899
Direction: N-S
Address range: 3700 to 3899
N 57th St
Length: 0.12 miles
Direction: N-S
Address range: 3700 to 3799
Direction: N-S
Address range: 3700 to 3799