Hill Crest Acres neighborhood in Midland, Texas (TX), 79703 detailed profile
Settings
X

Business Search - 14 Million verified businesses
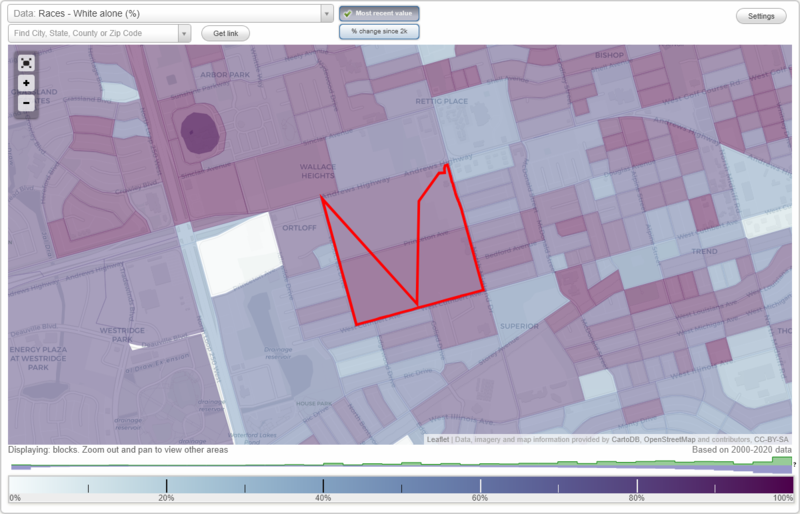
Area: 0.243 square miles
Population: 677
Population density:
| Hill Crest Acres: | 2,781 people per square mile |
| Midland: | 2,018 people per square mile |

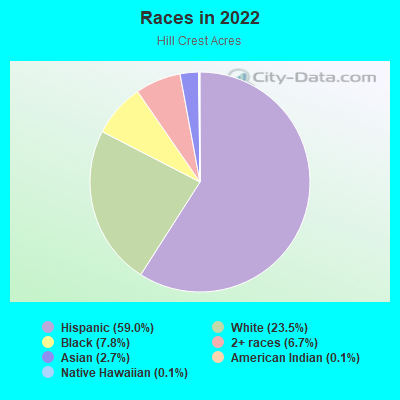
- 39959.0%Hispanic or Latino
- 15923.5%White
- 537.8%Black
- 456.7%Two or more races
- 182.7%Asian
- 10.1%American Indian
- 10.1%Native Hawaiian and Other
Pacific Islander
Median household income in 2022:
| Hill Crest Acres: | $94,036 |
| Midland: | $80,235 |
Distribution of median household income
![Distribution of median household income]()
- 9Less than $10,000
- 10$10,000 to $19,999
- 26$20,000 to $29,999
- 28$30,000 to $39,999
- 15$40,000 to $49,999
- 20$50,000 to $59,999
- 9$60,000 to $74,999
- 44$75,000 to $99,999
- 79$100,000 to $124,999
- 42$125,000 to $149,999
- 9$150,000 to $199,999
- 14$200,000 or more

Distribution of owner-occupied house/condo value
![Distribution of owner-occupied house/condo value]()
- 2Less than $50,000
- 12$50,000 to $99,999
- 23$100,000 to $149,999
- 38$150,000 to $199,999
- 67$200,000 to $249,999
- 21$250,000 to $299,999
- 18$300,000 to $399,999
- 6$400,000 to $499,999

Distribution of rent paid by renters
![Distribution of rent paid by renters]()
- 2$400 to $499
- 3$600 to $699
- 6$700 to $799
- 5$800 to $899
- 3$900 to $999
- 4$1,000 to $1,249
- 22$1,250 to $1,499
- 38$1,500 to $1,999
- 10$2,000 or more

Median rent in 2022:
| Hill Crest Acres: | $1,609 |
| Midland: | $1,135 |
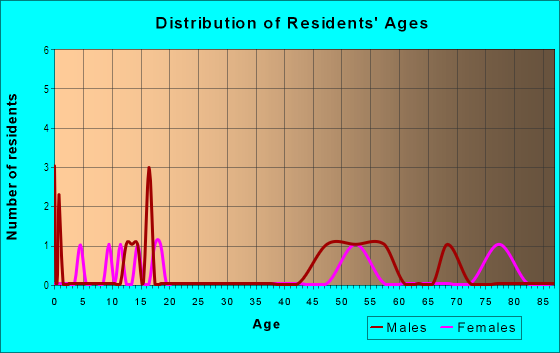
| Males: | 403 |
| Females: | 274 |
Males:
| This neighborhood: | 33.7 years |
| Whole city: | 32.3 years |
| This neighborhood: | 36.0 years |
| Whole city: | 33.3 years |
Average household size:
| Hill Crest Acres: | 2.3 people |
| Midland: | 2.4 people |
Percentage of family households:
| Hill Crest Acres: | 47.2% |
| Midland: | 52.0% |
| Here: | 40.9% |
| Midland: | 46.4% |
Percentage of married-couple families with children (among all households):
| Hill Crest Acres: | 29.4% |
| Midland: | 30.9% |
Percentage of single-mother households (among all households):
| Hill Crest Acres: | 4.2% |
| Midland: | 8.1% |
Percentage of never married males 15 years old and over:
Percentage of never married females 15 years old and over:
| Hill Crest Acres: | 14.1% |
| Midland: | 15.2% |
Percentage of never married females 15 years old and over:
| Hill Crest Acres: | 0.6% |
| city: | 14.9% |
Percentage of people that speak English not well or not at all:
| Hill Crest Acres: | 1.3% |
| Midland: | 5.7% |
Percentage of people born in this state:
Percentage of people born in another U.S. state:
Percentage of native residents but born outside the U.S.:
Percentage of foreign born residents:
| Here: | 77.3% |
| Midland: | 69.5% |
Percentage of people born in another U.S. state:
| Hill Crest Acres: | 16.1% |
| Midland: | 18.2% |
Percentage of native residents but born outside the U.S.:
| Here: | 0.8% |
| city: | 1.2% |
Percentage of foreign born residents:
| Here: | 5.9% |
| Midland: | 11.2% |
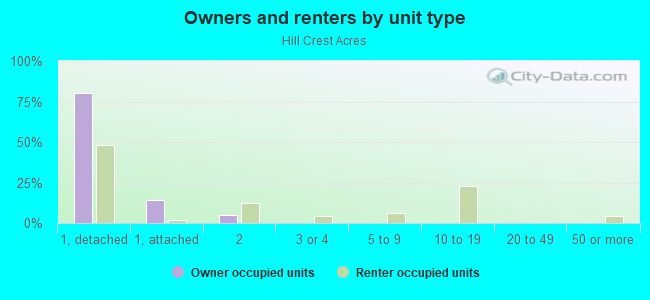
Owner-occupied
Renter-occupied

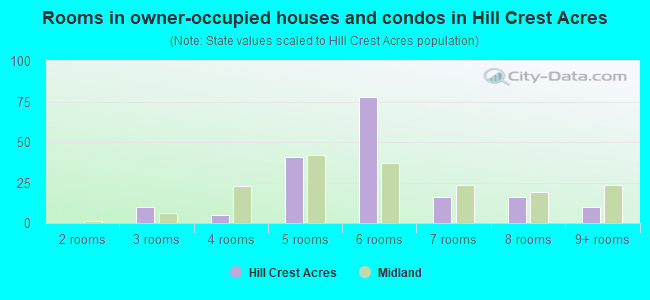
- Rooms in owner-occupied houses and condos in Hill Crest Acres
- 01 room
- 02 rooms
- 103 rooms
- 54 rooms
- 415 rooms
- 786 rooms
- 167 rooms
- 168 rooms
- 109+ rooms
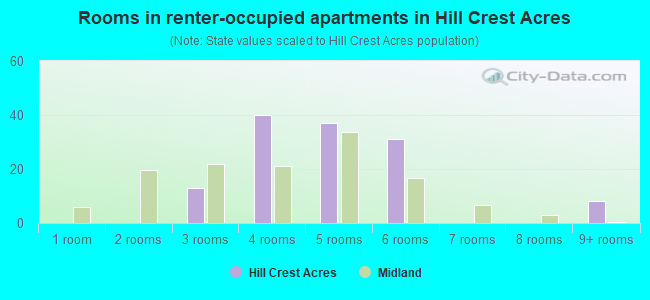
- Rooms in renter-occupied apartments in Hill Crest Acres
- 01 room
- 02 rooms
- 133 rooms
- 404 rooms
- 375 rooms
- 316 rooms
- 07 rooms
- 08 rooms
- 89+ rooms
Owner-occupied
Renter-occupied
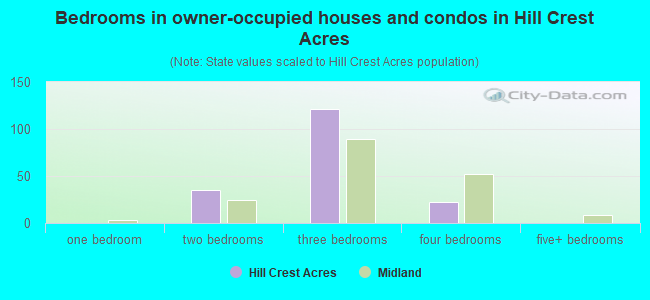
- Bedrooms in owner-occupied houses and condos in Hill Crest Acres
- 0no bedroom
- 01 bedroom
- 352 bedrooms
- 1213 bedrooms
- 224 bedrooms
- 05+ bedrooms
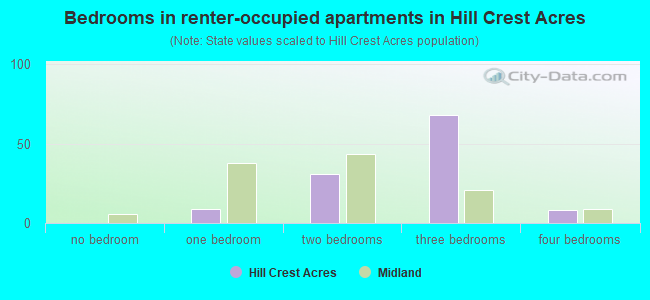
- Bedrooms in renter-occupied apartments in Hill Crest Acres
- 0no bedroom
- 91 bedroom
- 312 bedrooms
- 683 bedrooms
- 84 bedrooms
- 05+ bedrooms
Average number of cars or other vehicles available in houses/condos:
Average number of cars or other vehicles available in apartments:
| This neighborhood: | 1.6 |
| Midland: | 2.1 |
Average number of cars or other vehicles available in apartments:
| Here: | 2.1 |
| city: | 1.4 |
Percentage of units with a mortgage:
| Hill Crest Acres: | 57.1% |
| Midland: | 58.2% |
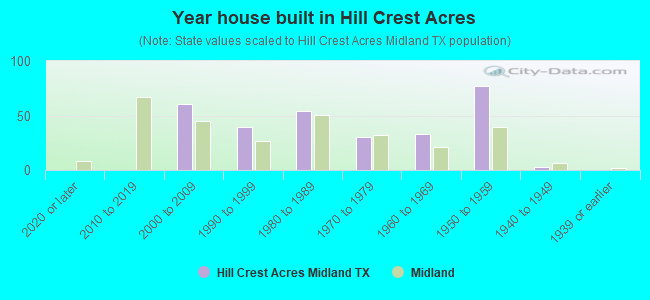
- Year house built in Hill Crest Acres
- 02020 or later
- 02010 to 2019
- 612000 to 2009
- 391990 to 1999
- 541980 to 1989
- 301970 to 1979
- 331960 to 1969
- 771950 to 1959
- 31940 to 1949
- 01939 or earlier
City-data.com crime index for city in 2020 (higher means more crime):
| City: | 223.8 |
| U.S. average: | 219.5 |
Travel time to work (commute)
![Travel time to work (commute)]()
- 11Less than 5 minutes
- 715 to 9 minutes
- 9110 to 14 minutes
- 5915 to 19 minutes
- 6520 to 24 minutes
- 425 to 29 minutes
- 4830 to 34 minutes
- 440 to 44 minutes
- 1945 to 59 minutes
- 560 to 89 minutes
- 190 or more minutes

Means of transportation to work
![Means of transportation to work]()
- 85.7%285Drove a car alone
- 13.2%44Carpooled
- 0.3%1Other means

Time leaving home to go to work
![Time leaving home to go to work]()
- 2112:00 a.m. to 4:59 a.m.
- 65:00 a.m. to 5:29 a.m.
- 75:30 a.m. to 5:59 a.m.
- 496:00 a.m. to 6:29 a.m.
- 146:30 a.m. to 6:59 a.m.
- 517:00 a.m. to 7:29 a.m.
- 947:30 a.m. to 7:59 a.m.
- 328:00 a.m. to 8:29 a.m.
- 318:30 a.m. to 8:59 a.m.
- 159:00 a.m. to 9:59 a.m.
- 510:00 a.m. to 10:59 a.m.
- 3012:00 p.m. to 3:59 p.m.
- 114:00 p.m. to 11:59 p.m.

Occupations of males:
- Percentage of males in management occupations (except farmers):
Here: 10.6% city: 14.6%
- Percentage of males in business and financial operations occupations:
Here: 5.5% city: 3.8%
- Percentage of males in computer and mathematical occupations:
Here: 4.8% city: 1.9%
- Percentage of males in architecture and engineering occupations:
Here: 16.9% city: 7.5%
- Percentage of males in community and social services occupations:
Here: 4.8% city: 0.8%
- Percentage of males in legal occupations:
Here: 1.7% city: 1.2%
- Percentage of males in education, training, and library occupations:
Here: 6.5% city: 2.5%
- Percentage of males in service occupations:
Here: 14.6% city: 9.5%
- Percentage of males in sales and office occupations:
Here: 18.1% city: 14.8%
- Percentage of males in construction, extraction, and maintenance occupations:
Here: 11.8% city: 15.1%
- Percentage of males in production occupations:
Here: 1.8% city: 7.5%
- Percentage of males in transportation occupations:
Here: 2.3% city: 5.1%
Occupations of females:
- Percentage of females in management occupations (except farmers):
Here: 26.8% city: 11.6%
- Percentage of females in business and financial operations occupations:
Here: 3.5% city: 6.9%
- Percentage of females in life, physical, and social science occupations:
Here: 6.2% city: 0.8%
- Percentage of females in education, training, and library occupations:
Here: 32.0% city: 11.2%
- Percentage of females in healthcare practitioners and technical occupations:
Here: 11.4% city: 6.8%
- Percentage of females in service occupations:
Here: 2.0% city: 16.8%
- Percentage of females in sales and office occupations:
Here: 17.6% city: 33.2%
- Percentage of females in production occupations:
Here: 1.3% city: 2.0%
- Percentage of females in transportation occupations:
Here: 3.9% city: 0.7%
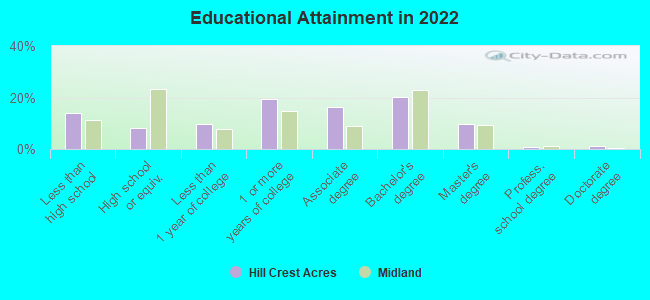
Education in this neighborhood (subdivision or community):
- Percentage of people 3 years and older in K-12 schools:
Hill Crest Acres: 25.0% Midland: 22.4%
- Percentage of people 3 years and older in undergraduate colleges:
Hill Crest Acres: 4.1% Midland: 3.0%
- Percentage of people 3 years and older in grad. or professional schools:
Hill Crest Acres: 1.7% Midland: 1.8%
- Percentage of students K-12 enrolled in private schools:
Hill Crest Acres: 16.9% Midland: 16.2%
Percentage of population below poverty level:
| Hill Crest Acres: | 4.1% |
| Midland: | 11.7% |
Median year owner moved in (as recorded in 2022):
Median year renter moved in (as recorded in 2022):
| Hill Crest Acres: | 2011 |
| Midland: | 2015 |
Median year renter moved in (as recorded in 2022):
| Hill Crest Acres: | 2014 |
| Midland: | 2022 |
Percentage of married-couple families with both working:
| Hill Crest Acres: | 105.5% |
| Midland: | 63.2% |
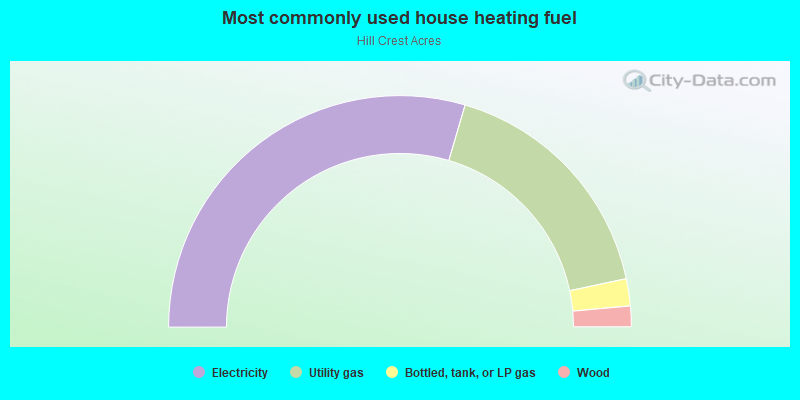
- 59.1%Electricity
- 34.2%Utility gas
- 3.8%Bottled, tank, or LP gas
- 2.9%Wood