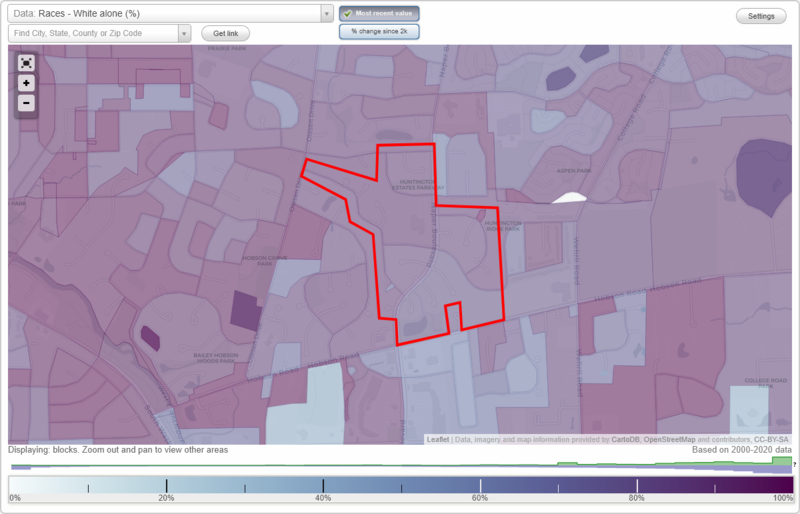
Huntington Estates neighborhood in Naperville, Illinois (IL), 60540 detailed profile
Settings
X

Business Search - 14 Million verified businesses
Area: 0.234 square miles
Population: 698
Population density:
| Huntington Estates: | 2,985 people per square mile |
| Naperville: | 4,198 people per square mile |

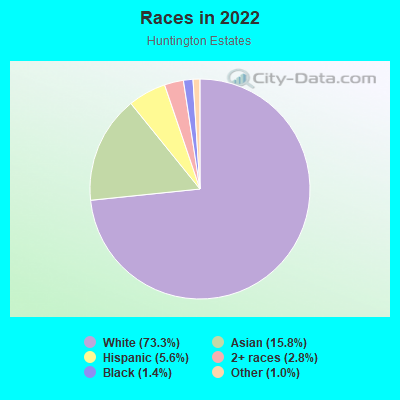
- 52073.3%White
- 11215.8%Asian
- 405.6%Hispanic or Latino
- 202.8%Two or more races
- 101.4%Black
- 71.0%Some other race
Median household income in 2022:
| Huntington Estates: | $197,849 |
| Naperville: | $140,831 |
Distribution of median household income
![Distribution of median household income]()
- 6Less than $10,000
- 3$10,000 to $19,999
- 18$20,000 to $29,999
- 8$30,000 to $39,999
- 5$40,000 to $49,999
- 6$50,000 to $59,999
- 10$60,000 to $74,999
- 18$75,000 to $99,999
- 15$100,000 to $124,999
- 16$125,000 to $149,999
- 40$150,000 to $199,999
- 107$200,000 or more

Distribution of owner-occupied house/condo value
![Distribution of owner-occupied house/condo value]()
- 4Less than $50,000
- 8$50,000 to $99,999
- 5$100,000 to $149,999
- 10$150,000 to $199,999
- 6$200,000 to $249,999
- 29$250,000 to $299,999
- 12$300,000 to $399,999
- 60$400,000 to $499,999
- 94$500,000 to $749,999
- 8$750,000 to $999,999
- 8$1,000,000 or more

Distribution of rent paid by renters
![Distribution of rent paid by renters]()
- 3$200 to $299
- 6$1,000 to $1,249
- 11$1,250 to $1,499
- 43$1,500 to $1,999
- 68$2,000 or more

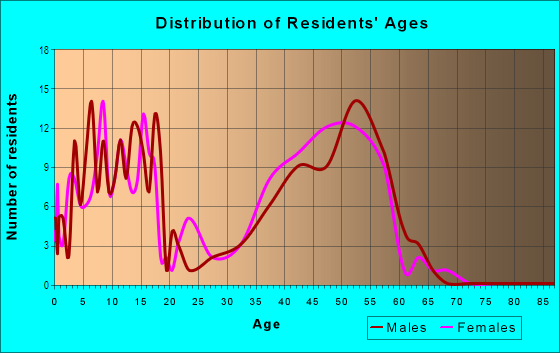
| Males: | 384 |
| Females: | 313 |
Males:
| This neighborhood: | 36.9 years |
| Whole city: | 39.6 years |
| This neighborhood: | 43.9 years |
| Whole city: | 42.4 years |
Average household size:
| Huntington Estates: | 3.2 people |
| Naperville: | 2.7 people |
Percentage of family households:
| Huntington Estates: | 58.2% |
| Naperville: | 57.7% |
| Here: | 69.5% |
| Naperville: | 66.6% |
Percentage of married-couple families with children (among all households):
| Huntington Estates: | 23.1% |
| Naperville: | 31.4% |
Percentage of single-mother households (among all households):
| Huntington Estates: | 0.8% |
| Naperville: | 4.5% |
Percentage of never married males 15 years old and over:
Percentage of never married females 15 years old and over:
| Huntington Estates: | 11.2% |
| Naperville: | 14.0% |
Percentage of never married females 15 years old and over:
| Huntington Estates: | 9.5% |
| city: | 12.1% |
Percentage of people that speak English not well or not at all:
| Huntington Estates: | 1.5% |
| Naperville: | 2.5% |
Percentage of people born in this state:
Percentage of people born in another U.S. state:
Percentage of native residents but born outside the U.S.:
Percentage of foreign born residents:
| Here: | 57.4% |
| Naperville: | 53.1% |
Percentage of people born in another U.S. state:
| Huntington Estates: | 22.9% |
| Naperville: | 23.5% |
Percentage of native residents but born outside the U.S.:
| Here: | 1.7% |
| city: | 1.4% |
Percentage of foreign born residents:
| Here: | 17.9% |
| Naperville: | 22.0% |
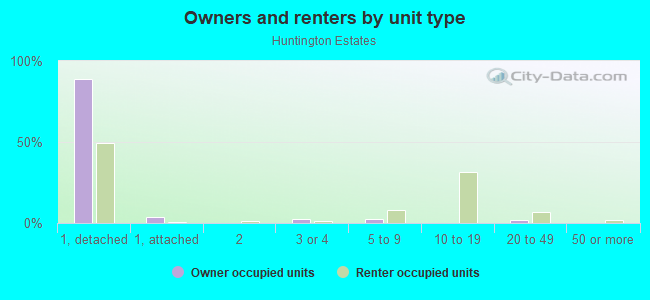
Owner-occupied
Renter-occupied

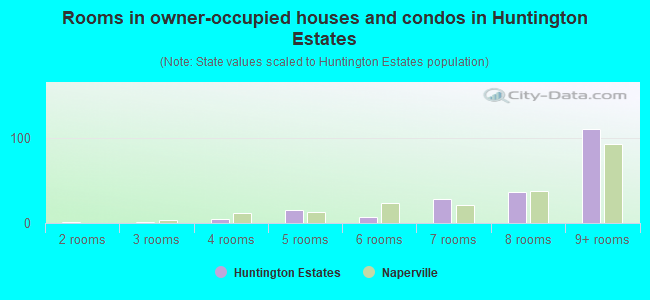
- Rooms in owner-occupied houses and condos in Huntington Estates
- 01 room
- 12 rooms
- 13 rooms
- 54 rooms
- 155 rooms
- 76 rooms
- 287 rooms
- 368 rooms
- 1109+ rooms
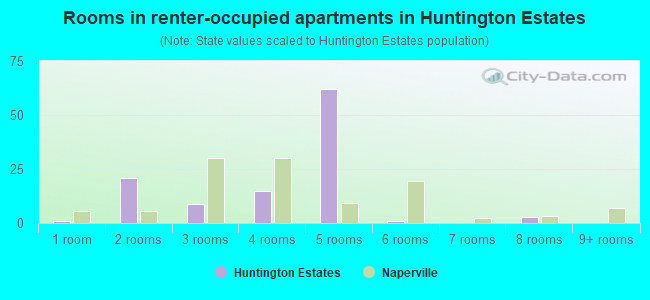
- Rooms in renter-occupied apartments in Huntington Estates
- 11 room
- 212 rooms
- 93 rooms
- 154 rooms
- 625 rooms
- 16 rooms
- 07 rooms
- 38 rooms
- 09+ rooms
Owner-occupied
Renter-occupied
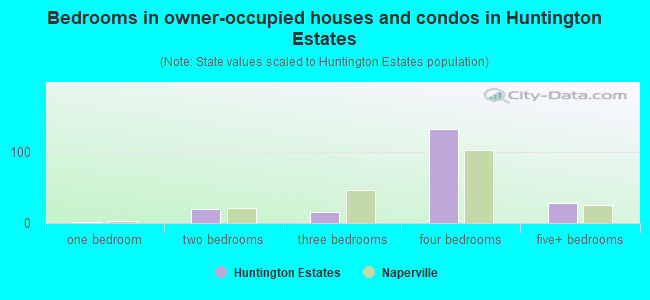
- Bedrooms in owner-occupied houses and condos in Huntington Estates
- 0no bedroom
- 11 bedroom
- 202 bedrooms
- 163 bedrooms
- 1334 bedrooms
- 295+ bedrooms
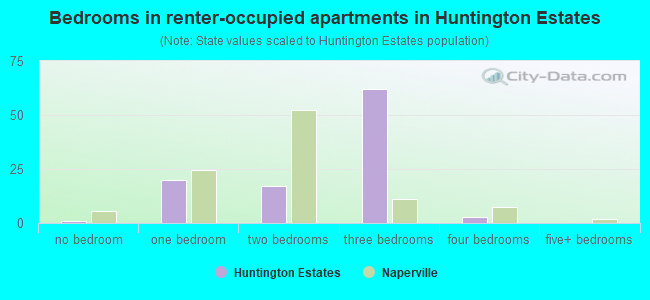
- Bedrooms in renter-occupied apartments in Huntington Estates
- 1no bedroom
- 201 bedroom
- 172 bedrooms
- 623 bedrooms
- 34 bedrooms
- 05+ bedrooms
Average number of cars or other vehicles available in houses/condos:
Average number of cars or other vehicles available in apartments:
| This neighborhood: | 1.9 |
| Naperville: | 2.1 |
Average number of cars or other vehicles available in apartments:
| Here: | |
| city: |
Percentage of units with a mortgage:
| Huntington Estates: | 70.8% |
| Naperville: | 62.5% |
Average estimated value of detached houses in 2022 (99.1% of all units):
| Huntington Estates: | $599,067 |
| Naperville: | $552,530 |
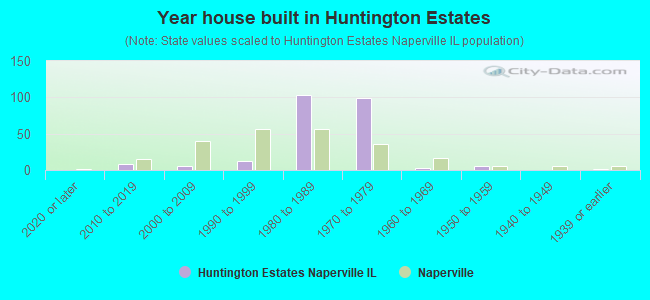
- Year house built in Huntington Estates
- 02020 or later
- 82010 to 2019
- 52000 to 2009
- 131990 to 1999
- 1031980 to 1989
- 991970 to 1979
- 31960 to 1969
- 51950 to 1959
- 01940 to 1949
- 11939 or earlier
City-data.com crime index for city in 2020 (higher means more crime):
| City: | 122.2 |
| U.S. average: | 219.5 |
Travel time to work (commute)
![Travel time to work (commute)]()
- 6Less than 5 minutes
- 175 to 9 minutes
- 2510 to 14 minutes
- 2115 to 19 minutes
- 2820 to 24 minutes
- 1225 to 29 minutes
- 2030 to 34 minutes
- 1335 to 39 minutes
- 640 to 44 minutes
- 2145 to 59 minutes
- 2760 to 89 minutes
- 890 or more minutes

Means of transportation to work
![Means of transportation to work]()
- 53.9%179Drove a car alone
- 1.5%5Carpooled
- 0.6%2Subway or elevated rail
- 3.9%13Long-distance train or commuter rail
- 0.3%1Light rail, streetcar or trolley
- 3.6%12Walked
- 39.2%130Worked at home

Time leaving home to go to work
![Time leaving home to go to work]()
- 212:00 a.m. to 4:59 a.m.
- 145:00 a.m. to 5:29 a.m.
- 75:30 a.m. to 5:59 a.m.
- 326:00 a.m. to 6:29 a.m.
- 266:30 a.m. to 6:59 a.m.
- 307:00 a.m. to 7:29 a.m.
- 217:30 a.m. to 7:59 a.m.
- 298:00 a.m. to 8:29 a.m.
- 118:30 a.m. to 8:59 a.m.
- 169:00 a.m. to 9:59 a.m.
- 710:00 a.m. to 10:59 a.m.
- 1012:00 p.m. to 3:59 p.m.
- 154:00 p.m. to 11:59 p.m.

Occupations of males:
- Percentage of males in management occupations (except farmers):
Here: 33.5% city: 21.9%
- Percentage of males in business and financial operations occupations:
Here: 13.8% city: 11.0%
- Percentage of males in computer and mathematical occupations:
Here: 4.8% city: 12.3%
- Percentage of males in architecture and engineering occupations:
Here: 5.6% city: 6.1%
- Percentage of males in legal occupations:
Here: 1.1% city: 2.2%
- Percentage of males in education, training, and library occupations:
Here: 17.5% city: 3.6%
- Percentage of males in healthcare practitioners and technical occupations:
Here: 1.8% city: 3.6%
- Percentage of males in service occupations:
Here: 5.7% city: 6.2%
- Percentage of males in sales and office occupations:
Here: 13.6% city: 16.9%
- Percentage of males in production occupations:
Here: 2.3% city: 2.5%
- Percentage of males in transportation occupations:
Here: 1.5% city: 3.9%
- Percentage of males in material moving occupations:
Here: 1.0% city: 1.9%
Occupations of females:
- Percentage of females in management occupations (except farmers):
Here: 25.2% city: 13.7%
- Percentage of females in business and financial operations occupations:
Here: 14.4% city: 10.1%
- Percentage of females in computer and mathematical occupations:
Here: 3.7% city: 4.5%
- Percentage of females in community and social services occupations:
Here: 4.0% city: 2.5%
- Percentage of females in legal occupations:
Here: 1.4% city: 1.8%
- Percentage of females in education, training, and library occupations:
Here: 19.8% city: 11.8%
- Percentage of females in arts, design, entertainment, sports, and media occupations:
Here: 3.7% city: 2.6%
- Percentage of females in healthcare practitioners and technical occupations:
Here: 1.5% city: 11.4%
- Percentage of females in service occupations:
Here: 16.7% city: 12.4%
- Percentage of females in sales and office occupations:
Here: 9.6% city: 22.7%
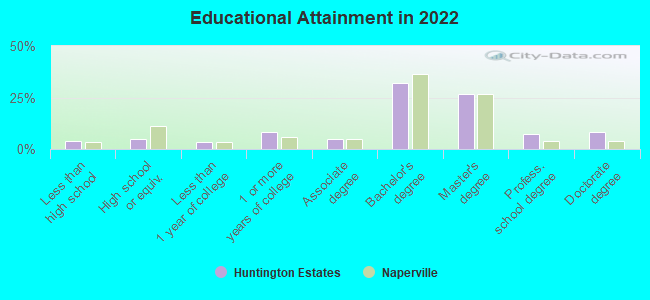
Education in this neighborhood (subdivision or community):
- Percentage of people 3 years and older in K-12 schools:
Huntington Estates: 30.2% Naperville: 19.5%
- Percentage of people 3 years and older in undergraduate colleges:
Huntington Estates: 4.5% Naperville: 3.6%
- Percentage of people 3 years and older in grad. or professional schools:
Huntington Estates: 2.9% Naperville: 1.7%
- Percentage of students K-12 enrolled in private schools:
Huntington Estates: 33.2% Naperville: 14.4%
Percentage of population below poverty level:
| Huntington Estates: | 2.9% |
| Naperville: | 4.1% |
Median year owner moved in (as recorded in 2022):
| Huntington Estates: | 2008 |
| Naperville: | 2010 |
Percentage of married-couple families with both working:
| Huntington Estates: | 81.5% |
| Naperville: | 73.0% |
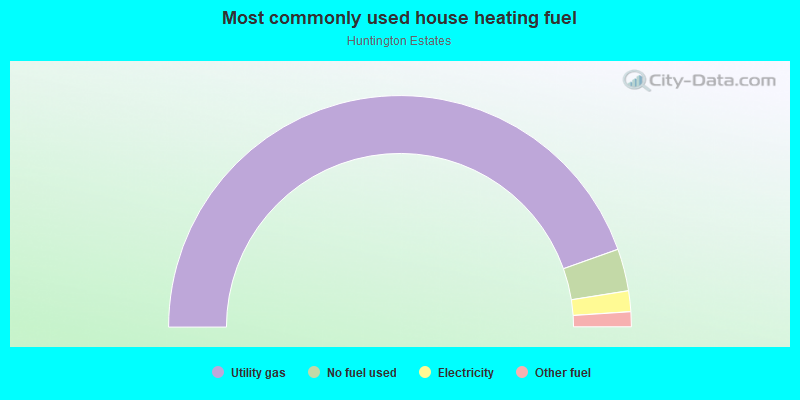
- 89.1%Utility gas
- 5.9%No fuel used
- 2.9%Electricity
- 2.1%Other fuel
Roads and streets:
S Naper Blvd (Naper Blvd)
Length: 0.60 miles
Directions: N-S, SW-NE
Address range: 800 to 1153
Directions: N-S, SW-NE
Address range: 800 to 1153
Collingwood Dr
Length: 0.55 miles
Directions: E-W, N-S, SE-NW, SW-NE
Address range: 900 to 1199
Directions: E-W, N-S, SE-NW, SW-NE
Address range: 900 to 1199
Huntleigh Dr
Length: 0.53 miles
Directions: E-W, N-S, SE-NW, SW-NE
Address range: 834 to 1199
Directions: E-W, N-S, SE-NW, SW-NE
Address range: 834 to 1199
Culpepper Dr
Length: 0.40 miles
Directions: E-W, SE-NW
Address range: 1300 to 1436
Directions: E-W, SE-NW
Address range: 1300 to 1436
Rockbridge Dr (Rockbridge Rd)
Length: 0.32 miles
Directions: E-W, N-S, SE-NW
Address range: 800 to 899
Directions: E-W, N-S, SE-NW
Address range: 800 to 899
E Gartner Rd
Length: 0.21 miles
Direction: E-W
Address range: 1366 to 1499
Direction: E-W
Address range: 1366 to 1499
Hobson Rd
Length: 0.16 miles
Direction: E-W
Address range: 1400 to 1499
Direction: E-W
Address range: 1400 to 1499
Barcroft Ct
Length: 0.14 miles
Directions: E-W, SE-NW
Address range: 1100 to 1199
Directions: E-W, SE-NW
Address range: 1100 to 1199
Glenmore Ct
Length: 0.13 miles
Directions: E-W, N-S, SE-NW
Address range: 800 to 899
Directions: E-W, N-S, SE-NW
Address range: 800 to 899
Dartford Ct
Length: 0.13 miles
Direction: E-W
Address range: 1300 to 1399
Direction: E-W
Address range: 1300 to 1399
Overton Ct
Length: 0.11 miles
Directions: E-W, SE-NW
Address range: 1100 to 1199
Directions: E-W, SE-NW
Address range: 1100 to 1199
Bankfield Ct
Length: 0.10 miles
Directions: N-S, SW-NE
Address range: 900 to 1099
Directions: N-S, SW-NE
Address range: 900 to 1099
Rossmere Ct
Length: 0.09 miles
Directions: N-S, SE-NW, SW-NE
Address range: 800 to 999
Directions: N-S, SE-NW, SW-NE
Address range: 800 to 999
Wickham Ct
Length: 0.08 miles
Directions: SE-NW, SW-NE
Address range: 1000 to 1199
Directions: SE-NW, SW-NE
Address range: 1000 to 1199
Wydown Ct
Length: 0.07 miles
Directions: E-W, N-S, SE-NW
Address range: 1100 to 1199
Directions: E-W, N-S, SE-NW
Address range: 1100 to 1199
Ridgely Ct
Length: 0.05 miles
Direction: E-W
Address range: 1400 to 1499
Direction: E-W
Address range: 1400 to 1499
Woodbine Ct
Length: 0.05 miles
Directions: E-W, SW-NE
Address range: 800 to 899
Directions: E-W, SW-NE
Address range: 800 to 899
Alton Ct
Length: 0.05 miles
Directions: E-W, N-S
Address range: 1000 to 1099
Directions: E-W, N-S
Address range: 1000 to 1099
Wexford Ct
Length: 0.02 miles
Direction: SW-NE
Address range: 800 to 899
Direction: SW-NE
Address range: 800 to 899