Huron Green neighborhood in Denver, Colorado (CO), 80260 detailed profile
Settings
X

Business Search - 14 Million verified businesses
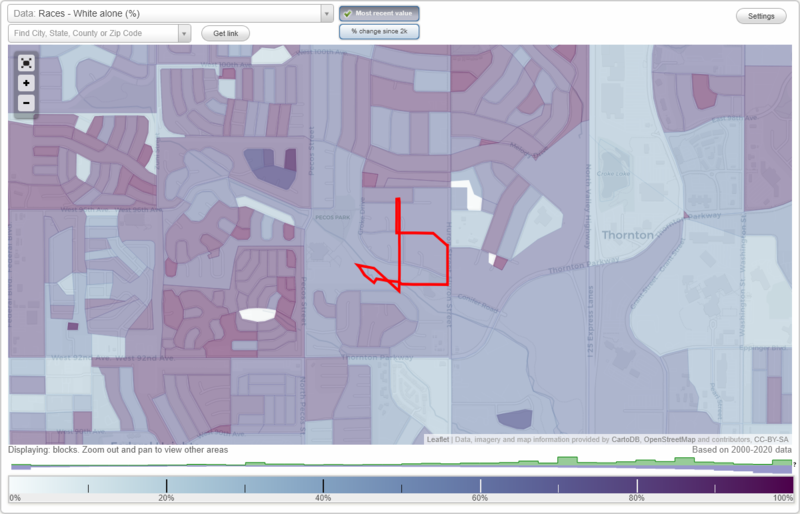
Area: 0.066 square miles
Population: 352
Population density:
| Huron Green: | 5,322 people per square mile |
| Denver: | 4,651 people per square mile |

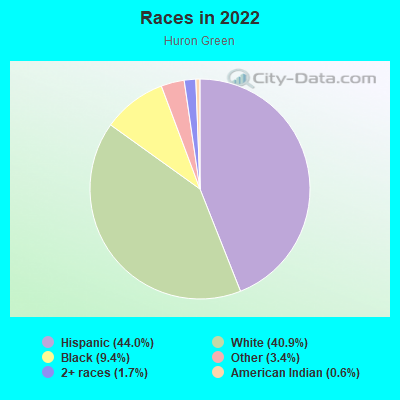
- 15544.0%Hispanic or Latino
- 14440.9%White
- 339.4%Black
- 123.4%Some other race
- 61.7%Two or more races
- 20.6%American Indian
Median household income in 2022:
| Huron Green: | $72,957 |
| Denver: | $88,213 |
Distribution of median household income
![Distribution of median household income]()
- 1Less than $10,000
- 11$10,000 to $19,999
- 11$20,000 to $29,999
- 17$30,000 to $39,999
- 11$40,000 to $49,999
- 8$50,000 to $59,999
- 27$60,000 to $74,999
- 10$75,000 to $99,999
- 18$100,000 to $124,999
- 10$125,000 to $149,999
- 3$150,000 to $199,999
- 17$200,000 or more

Distribution of owner-occupied house/condo value
![Distribution of owner-occupied house/condo value]()
- 26Less than $50,000
- 60$50,000 to $99,999
- 12$100,000 to $149,999
- 2$150,000 to $199,999
- 3$200,000 to $249,999
- 19$300,000 to $399,999
- 16$400,000 to $499,999
- 2$500,000 to $749,999
- 3$750,000 to $999,999

Distribution of rent paid by renters
![Distribution of rent paid by renters]()
- 1$1,000 to $1,249
- 10$1,250 to $1,499
- 12$1,500 to $1,999

Median rent in 2022:
| Huron Green: | $1,545 |
| Denver: | $1,623 |
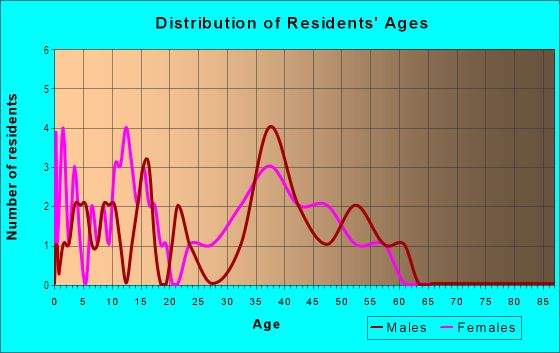
| Males: | 189 |
| Females: | 162 |
Males:
| This neighborhood: | 41.9 years |
| Whole city: | 35.2 years |
| This neighborhood: | 33.4 years |
| Whole city: | 35.1 years |
Average household size:
| Huron Green: | 3.0 people |
| Denver: | 28.0 people |
Percentage of family households:
| Huron Green: | 50.9% |
| Denver: | 35.1% |
| Here: | 45.3% |
| Denver: | 32.5% |
Percentage of married-couple families with children (among all households):
| Huron Green: | 25.8% |
| Denver: | 32.4% |
Percentage of single-mother households (among all households):
| Huron Green: | 7.8% |
| Denver: | 10.3% |
Percentage of never married males 15 years old and over:
Percentage of never married females 15 years old and over:
| Huron Green: | 23.3% |
| Denver: | 25.0% |
Percentage of never married females 15 years old and over:
| Huron Green: | 20.4% |
| city: | 20.8% |
Percentage of people that speak English not well or not at all:
| Huron Green: | 5.6% |
| Denver: | 3.9% |
Percentage of people born in this state:
Percentage of people born in another U.S. state:
Percentage of native residents but born outside the U.S.:
Percentage of foreign born residents:
| Here: | 55.1% |
| Denver: | 38.5% |
Percentage of people born in another U.S. state:
| Huron Green: | 16.1% |
| Denver: | 46.1% |
Percentage of native residents but born outside the U.S.:
| Here: | 1.0% |
| city: | 1.7% |
Percentage of foreign born residents:
| Here: | 27.8% |
| Denver: | 13.8% |
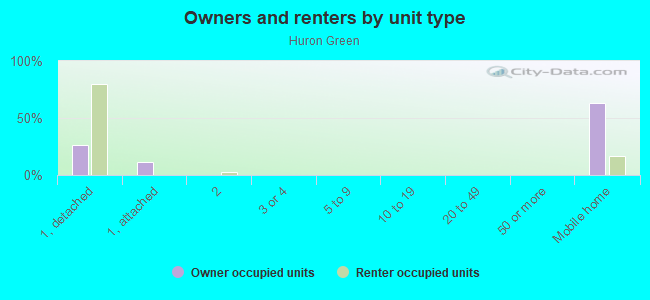
Owner-occupied
Renter-occupied

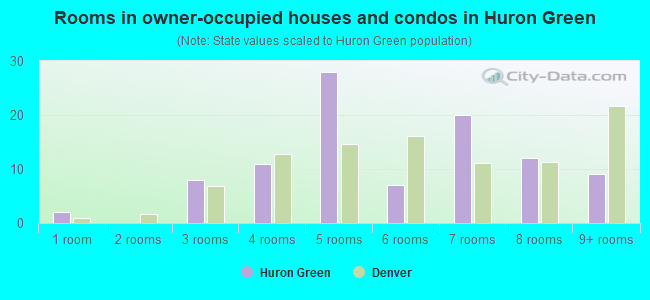
- Rooms in owner-occupied houses and condos in Huron Green
- 21 room
- 02 rooms
- 83 rooms
- 114 rooms
- 285 rooms
- 76 rooms
- 207 rooms
- 128 rooms
- 99+ rooms
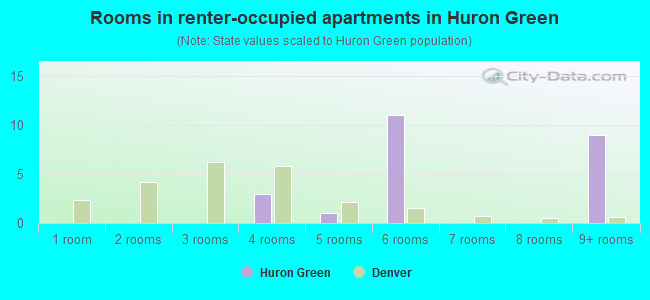
- Rooms in renter-occupied apartments in Huron Green
- 01 room
- 02 rooms
- 03 rooms
- 34 rooms
- 15 rooms
- 116 rooms
- 07 rooms
- 08 rooms
- 99+ rooms
Owner-occupied
Renter-occupied
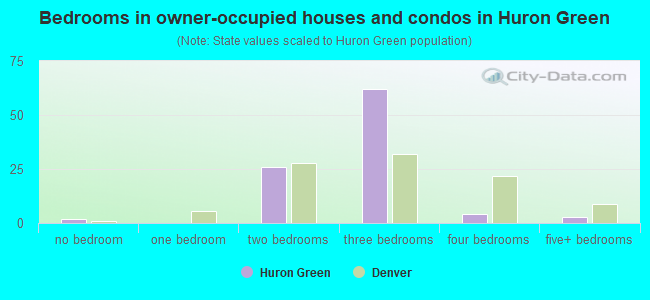
- Bedrooms in owner-occupied houses and condos in Huron Green
- 2no bedroom
- 01 bedroom
- 262 bedrooms
- 623 bedrooms
- 44 bedrooms
- 35+ bedrooms
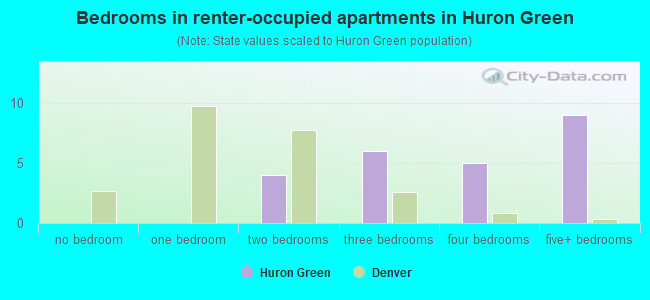
- Bedrooms in renter-occupied apartments in Huron Green
- 0no bedroom
- 01 bedroom
- 42 bedrooms
- 63 bedrooms
- 54 bedrooms
- 95+ bedrooms
Average number of cars or other vehicles available in houses/condos:
Average number of cars or other vehicles available in apartments:
| This neighborhood: | 2.8 |
| Denver: | 1.9 |
Average number of cars or other vehicles available in apartments:
| Here: | 1.7 |
| city: | 1.3 |
Percentage of units with a mortgage:
| Huron Green: | 33.1% |
| Denver: | 75.6% |
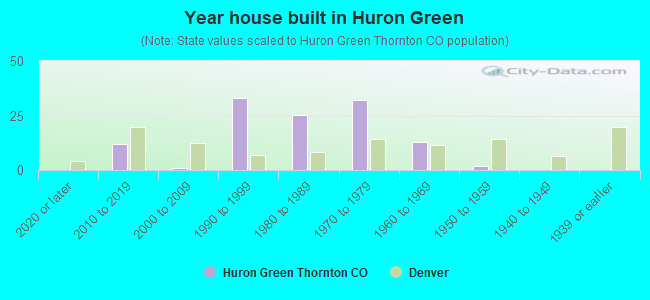
- Year house built in Huron Green
- 02020 or later
- 122010 to 2019
- 12000 to 2009
- 331990 to 1999
- 251980 to 1989
- 321970 to 1979
- 131960 to 1969
- 21950 to 1959
- 01940 to 1949
- 01939 or earlier
City-data.com crime index for city in 2020 (higher means more crime):
| City: | 519.0 |
| U.S. average: | 219.5 |
Travel time to work (commute)
![Travel time to work (commute)]()
- 55 to 9 minutes
- 3110 to 14 minutes
- 1015 to 19 minutes
- 2820 to 24 minutes
- 625 to 29 minutes
- 1530 to 34 minutes
- 340 to 44 minutes
- 3445 to 59 minutes
- 760 to 89 minutes
- 490 or more minutes

Means of transportation to work
![Means of transportation to work]()
- 78.9%143Drove a car alone
- 17.1%31Carpooled
- 1.7%3Bus
- 0.6%1Bicycle
- 3.3%6Worked at home

Time leaving home to go to work
![Time leaving home to go to work]()
- 912:00 a.m. to 4:59 a.m.
- 75:00 a.m. to 5:29 a.m.
- 65:30 a.m. to 5:59 a.m.
- 206:00 a.m. to 6:29 a.m.
- 166:30 a.m. to 6:59 a.m.
- 237:00 a.m. to 7:29 a.m.
- 87:30 a.m. to 7:59 a.m.
- 58:00 a.m. to 8:29 a.m.
- 98:30 a.m. to 8:59 a.m.
- 810:00 a.m. to 10:59 a.m.
- 211:00 a.m. to 11:59 a.m.
- 1312:00 p.m. to 3:59 p.m.
- 94:00 p.m. to 11:59 p.m.

Occupations of males:
- Percentage of males in management occupations (except farmers):
Here: 3.6% city: 15.4%
- Percentage of males in business and financial operations occupations:
Here: 3.1% city: 8.3%
- Percentage of males in computer and mathematical occupations:
Here: 6.0% city: 7.4%
- Percentage of males in education, training, and library occupations:
Here: 1.6% city: 3.1%
- Percentage of males in service occupations:
Here: 19.4% city: 11.9%
- Percentage of males in sales and office occupations:
Here: 14.0% city: 15.4%
- Percentage of males in farming, fishing, and forestry occupations:
Here: 1.2% city: 0.3%
- Percentage of males in construction, extraction, and maintenance occupations:
Here: 12.3% city: 8.0%
- Percentage of males in production occupations:
Here: 4.4% city: 3.2%
- Percentage of males in transportation occupations:
Here: 18.6% city: 4.2%
- Percentage of males in material moving occupations:
Here: 2.6% city: 3.5%
Occupations of females:
- Percentage of females in management occupations (except farmers):
Here: 6.8% city: 14.0%
- Percentage of females in business and financial operations occupations:
Here: 4.2% city: 10.0%
- Percentage of females in computer and mathematical occupations:
Here: 1.8% city: 2.9%
- Percentage of females in education, training, and library occupations:
Here: 5.4% city: 7.9%
- Percentage of females in healthcare practitioners and technical occupations:
Here: 5.0% city: 10.2%
- Percentage of females in service occupations:
Here: 44.5% city: 16.2%
- Percentage of females in sales and office occupations:
Here: 39.5% city: 21.4%
- Percentage of females in production occupations:
Here: 3.0% city: 1.7%
- Percentage of females in material moving occupations:
Here: 7.1% city: 1.4%
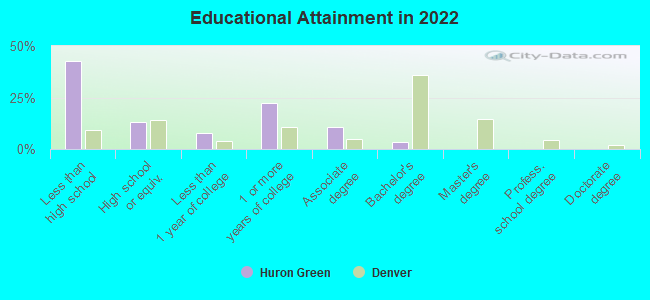
Education in this neighborhood (subdivision or community):
- Percentage of people 3 years and older in K-12 schools:
Huron Green: 11.6% Denver: 12.7%
- Percentage of people 3 years and older in undergraduate colleges:
Huron Green: 3.7% Denver: 4.1%
- Percentage of people 3 years and older in grad. or professional schools:
Huron Green: 0.0% Denver: 2.2%
- Percentage of students K-12 enrolled in private schools:
Huron Green: 9.8% Denver: 11.0%
Percentage of population below poverty level:
| Huron Green: | 11.7% |
| Denver: | 11.8% |
Median year owner moved in (as recorded in 2022):
Median year renter moved in (as recorded in 2022):
| Huron Green: | 2007 |
| Denver: | 2014 |
Median year renter moved in (as recorded in 2022):
| Huron Green: | 2011 |
| Denver: | 2021 |
Percentage of married-couple families with both working:
| Huron Green: | 51.1% |
| Denver: | 74.1% |
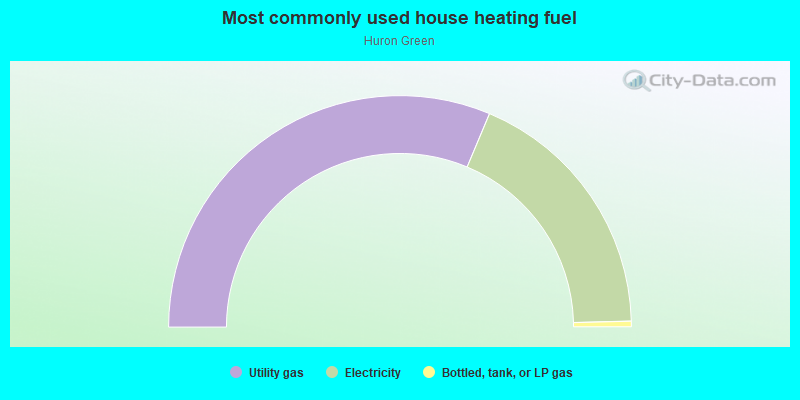
- 62.6%Utility gas
- 36.5%Electricity
- 0.8%Bottled, tank, or LP gas
Roads and streets:
Croke Dr
Length: 0.39 miles
Directions: E-W, N-S, SE-NW, SW-NE
Address range: 951 to 9621
Directions: E-W, N-S, SE-NW, SW-NE
Address range: 951 to 9621
W 95th Pl
Length: 0.22 miles
Directions: E-W, N-S, SE-NW
Address range: 1020 to 1199
Directions: E-W, N-S, SE-NW
Address range: 1020 to 1199
Inca Ct
Length: 0.08 miles
Directions: N-S, SE-NW, SW-NE
Address range: 9400 to 9499
Directions: N-S, SE-NW, SW-NE
Address range: 9400 to 9499
Jason Way
Length: 0.07 miles
Direction: N-S
Address range: 9400 to 9499
Direction: N-S
Address range: 9400 to 9499
Kalamath Ct
Length: 0.06 miles
Directions: N-S, SE-NW
Address range: 9400 to 9499
Directions: N-S, SE-NW
Address range: 9400 to 9499
Jason Ct
Length: 0.05 miles
Directions: N-S, SE-NW, SW-NE
Address range: 9500 to 9599
Directions: N-S, SE-NW, SW-NE
Address range: 9500 to 9599
Kalamath Cir
Length: 0.05 miles
Directions: N-S, SE-NW
Address range: 9500 to 9599
Directions: N-S, SE-NW
Address range: 9500 to 9599
W 95th Cir
Length: 0.03 miles
Directions: E-W, SE-NW
Address range: 1100 to 1199
Directions: E-W, SE-NW
Address range: 1100 to 1199