Jordan neighborhood in Minneapolis, Minnesota (MN), 55411 detailed profile
Settings
X

Business Search - 14 Million verified businesses
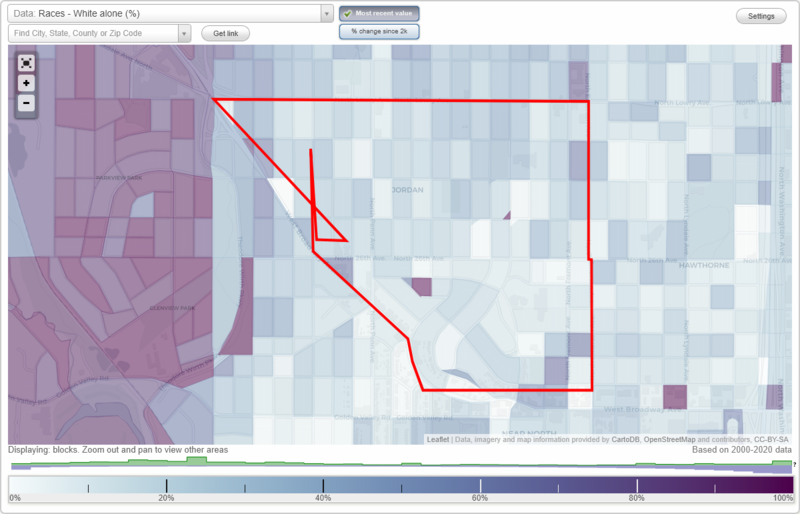
Area: 0.772 square miles
Population: 7,884
Population density:
| Jordan: | 10,217 people per square mile |
| Minneapolis: | 7,744 people per square mile |

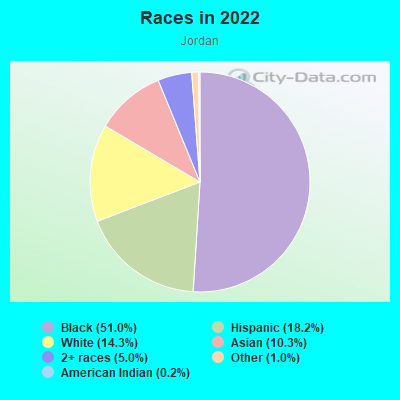
- 4,21951.0%Black
- 1,50518.2%Hispanic or Latino
- 1,18214.3%White
- 85010.3%Asian
- 4135.0%Two or more races
- 811.0%Some other race
- 170.2%American Indian
Distribution of median household income
![Distribution of median household income]()
- 233Less than $10,000
- 475$10,000 to $19,999
- 302$20,000 to $29,999
- 475$30,000 to $39,999
- 376$40,000 to $49,999
- 200$50,000 to $59,999
- 359$60,000 to $74,999
- 275$75,000 to $99,999
- 75$100,000 to $124,999
- 169$125,000 to $149,999
- 151$150,000 to $199,999
- 480$200,000 or more

Distribution of owner-occupied house/condo value
![Distribution of owner-occupied house/condo value]()
- 162Less than $50,000
- 212$50,000 to $99,999
- 300$100,000 to $149,999
- 496$150,000 to $199,999
- 462$200,000 to $249,999
- 134$250,000 to $299,999
- 86$300,000 to $399,999
- 120$400,000 to $499,999
- 35$500,000 to $749,999
- 29$750,000 to $999,999
- 33$1,000,000 or more

Distribution of rent paid by renters
![Distribution of rent paid by renters]()
- 159Less than $100
- 160$100 to $199
- 189$200 to $299
- 24$300 to $399
- 107$400 to $499
- 233$500 to $599
- 197$600 to $699
- 453$700 to $799
- 206$800 to $899
- 154$900 to $999
- 268$1,000 to $1,249
- 173$1,250 to $1,499
- 373$1,500 to $1,999
- 201$2,000 or more

Median rent in 2022:
| Jordan: | $937 |
| Minneapolis: | $1,159 |
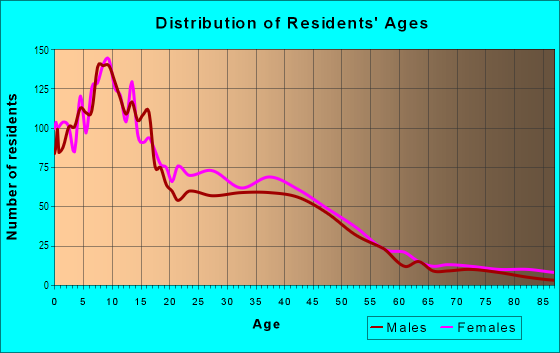
| Males: | 3,751 |
| Females: | 4,133 |
Males:
| This neighborhood: | 31.5 years |
| Whole city: | 33.3 years |
| This neighborhood: | 29.0 years |
| Whole city: | 33.2 years |
Average household size:
| Jordan: | 2.9 people |
| Minneapolis: | 2.1 people |
Percentage of family households:
| Jordan: | 49.9% |
| Minneapolis: | 34.1% |
| Here: | 18.7% |
| Minneapolis: | 29.8% |
Percentage of married-couple families with children (among all households):
| Jordan: | 14.1% |
| Minneapolis: | 31.8% |
Percentage of single-mother households (among all households):
| Jordan: | 14.7% |
| Minneapolis: | 10.5% |
Percentage of never married males 15 years old and over:
Percentage of never married females 15 years old and over:
| Jordan: | 27.0% |
| Minneapolis: | 27.0% |
Percentage of never married females 15 years old and over:
| Jordan: | 27.1% |
| city: | 25.4% |
Percentage of people that speak English not well or not at all:
| Jordan: | 8.3% |
| Minneapolis: | 3.8% |
Percentage of people born in this state:
Percentage of people born in another U.S. state:
Percentage of native residents but born outside the U.S.:
Percentage of foreign born residents:
| Here: | 47.5% |
| Minneapolis: | 51.9% |
Percentage of people born in another U.S. state:
| Jordan: | 32.0% |
| Minneapolis: | 31.8% |
Percentage of native residents but born outside the U.S.:
| Here: | 0.4% |
| city: | 1.5% |
Percentage of foreign born residents:
| Here: | 20.0% |
| Minneapolis: | 14.7% |
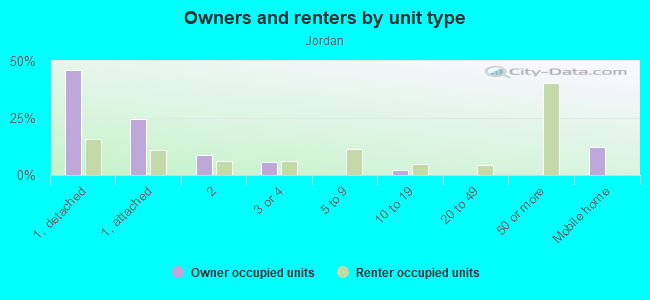
Owner-occupied
Renter-occupied

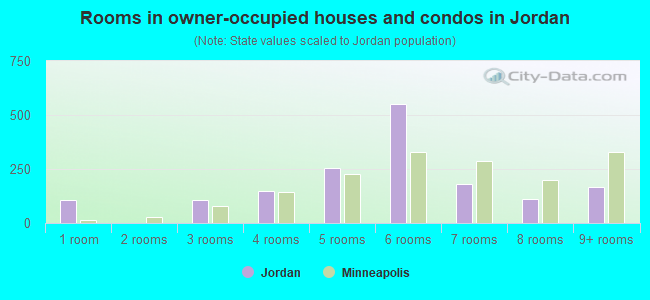
- Rooms in owner-occupied houses and condos in Jordan
- 1061 room
- 02 rooms
- 1063 rooms
- 1464 rooms
- 2565 rooms
- 5536 rooms
- 1807 rooms
- 1138 rooms
- 1669+ rooms
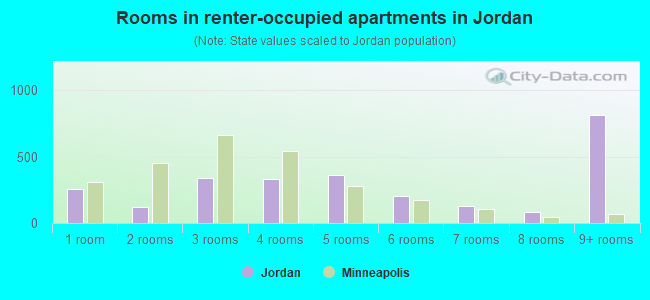
- Rooms in renter-occupied apartments in Jordan
- 2571 room
- 1192 rooms
- 3373 rooms
- 3344 rooms
- 3625 rooms
- 2046 rooms
- 1267 rooms
- 848 rooms
- 8159+ rooms
Owner-occupied
Renter-occupied
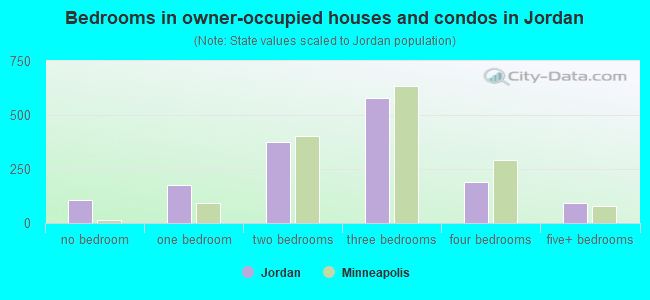
- Bedrooms in owner-occupied houses and condos in Jordan
- 106no bedroom
- 1751 bedroom
- 3742 bedrooms
- 5813 bedrooms
- 1894 bedrooms
- 925+ bedrooms
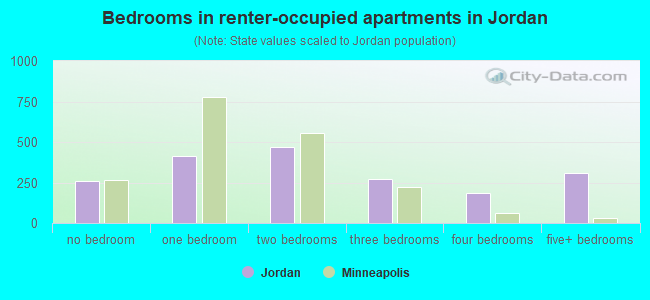
- Bedrooms in renter-occupied apartments in Jordan
- 257no bedroom
- 4151 bedroom
- 4722 bedrooms
- 2733 bedrooms
- 1844 bedrooms
- 3105+ bedrooms
Average number of cars or other vehicles available in houses/condos:
Average number of cars or other vehicles available in apartments:
| This neighborhood: | 1.8 |
| Minneapolis: | 1.6 |
Average number of cars or other vehicles available in apartments:
| Here: | 1.4 |
| city: | 1.1 |
Percentage of units with a mortgage:
| Jordan: | 86.4% |
| Minneapolis: | 71.8% |
Average estimated value of detached houses in 2022 (54.7% of all units):
| Jordan: | $175,271 |
| Minnesota: | $374,552 |
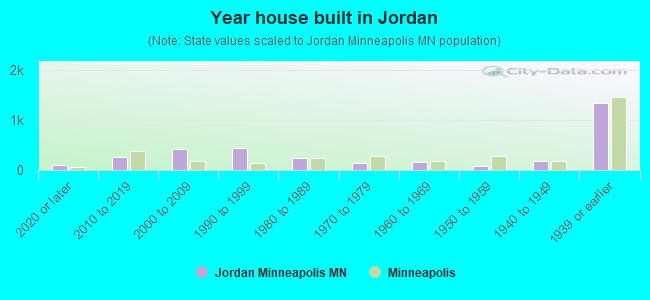
- Year house built in Jordan
- 1002020 or later
- 2682010 to 2019
- 4112000 to 2009
- 4491990 to 1999
- 2351980 to 1989
- 1481970 to 1979
- 1691960 to 1969
- 871950 to 1959
- 1841940 to 1949
- 1,3451939 or earlier
City-data.com crime index for city in 2020 (higher means more crime):
| City: | 600.2 |
| U.S. average: | 219.5 |
Travel time to work (commute)
![Travel time to work (commute)]()
- 42Less than 5 minutes
- 745 to 9 minutes
- 40310 to 14 minutes
- 35015 to 19 minutes
- 45720 to 24 minutes
- 27925 to 29 minutes
- 56930 to 34 minutes
- 13635 to 39 minutes
- 25140 to 44 minutes
- 23045 to 59 minutes
- 16260 to 89 minutes
- 6990 or more minutes

Means of transportation to work
![Means of transportation to work]()
- 57.8%1,784Drove a car alone
- 13.8%427Carpooled
- 17.3%534Bus
- 1.2%38Taxi
- 1.4%43Bicycle
- 6.3%193Walked
- 5.8%180Other means
- 6.7%206Worked at home

Time leaving home to go to work
![Time leaving home to go to work]()
- 14512:00 a.m. to 4:59 a.m.
- 1205:00 a.m. to 5:29 a.m.
- 725:30 a.m. to 5:59 a.m.
- 2576:00 a.m. to 6:29 a.m.
- 1196:30 a.m. to 6:59 a.m.
- 3407:00 a.m. to 7:29 a.m.
- 717:30 a.m. to 7:59 a.m.
- 4228:00 a.m. to 8:29 a.m.
- 1798:30 a.m. to 8:59 a.m.
- 2169:00 a.m. to 9:59 a.m.
- 6410:00 a.m. to 10:59 a.m.
- 4311:00 a.m. to 11:59 a.m.
- 52312:00 p.m. to 3:59 p.m.
- 3434:00 p.m. to 11:59 p.m.

Occupations of males:
- Percentage of males in management occupations (except farmers):
Here: 1.2% city: 12.1%
- Percentage of males in business and financial operations occupations:
Here: 10.7% city: 9.1%
- Percentage of males in computer and mathematical occupations:
Here: 6.5% city: 8.4%
- Percentage of males in architecture and engineering occupations:
Here: 1.7% city: 4.6%
- Percentage of males in arts, design, entertainment, sports, and media occupations:
Here: 2.2% city: 4.0%
- Percentage of males in healthcare practitioners and technical occupations:
Here: 1.5% city: 3.6%
- Percentage of males in service occupations:
Here: 22.4% city: 12.6%
- Percentage of males in sales and office occupations:
Here: 10.9% city: 15.3%
- Percentage of males in construction, extraction, and maintenance occupations:
Here: 5.8% city: 3.3%
- Percentage of males in production occupations:
Here: 23.4% city: 5.8%
- Percentage of males in transportation occupations:
Here: 5.6% city: 4.1%
- Percentage of males in material moving occupations:
Here: 3.8% city: 3.6%
Occupations of females:
- Percentage of females in management occupations (except farmers):
Here: 6.4% city: 11.4%
- Percentage of females in community and social services occupations:
Here: 3.8% city: 3.8%
- Percentage of females in legal occupations:
Here: 1.3% city: 2.3%
- Percentage of females in education, training, and library occupations:
Here: 10.4% city: 10.6%
- Percentage of females in arts, design, entertainment, sports, and media occupations:
Here: 1.0% city: 5.6%
- Percentage of females in healthcare practitioners and technical occupations:
Here: 5.1% city: 8.3%
- Percentage of females in service occupations:
Here: 27.0% city: 17.8%
- Percentage of females in sales and office occupations:
Here: 28.1% city: 18.7%
- Percentage of females in construction, extraction, and maintenance occupations:
Here: 3.6% city: 0.2%
- Percentage of females in production occupations:
Here: 7.4% city: 2.7%
- Percentage of females in transportation occupations:
Here: 3.5% city: 0.9%
- Percentage of females in material moving occupations:
Here: 2.3% city: 1.5%
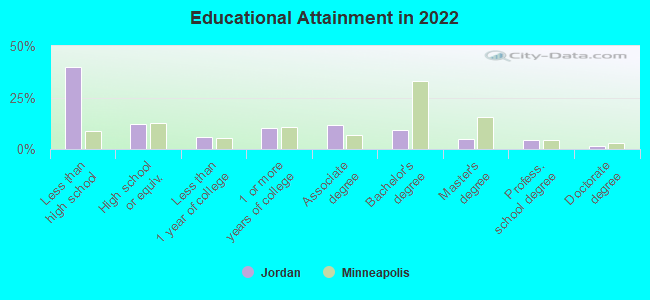
Education in this neighborhood (subdivision or community):
- Percentage of people 3 years and older in K-12 schools:
Jordan: 29.8% Minneapolis: 14.0%
- Percentage of people 3 years and older in undergraduate colleges:
Jordan: 5.0% Minneapolis: 8.6%
- Percentage of people 3 years and older in grad. or professional schools:
Jordan: 2.5% Minneapolis: 2.9%
- Percentage of students K-12 enrolled in private schools:
Jordan: 34.8% Minneapolis: 14.1%
Percentage of population below poverty level:
| Jordan: | 35.0% |
| Minneapolis: | 17.2% |
Median year owner moved in (as recorded in 2022):
Median year renter moved in (as recorded in 2022):
| Jordan: | 2006 |
| Minneapolis: | 2012 |
Median year renter moved in (as recorded in 2022):
| Jordan: | 2013 |
| Minneapolis: | 2021 |
Percentage of married-couple families with both working:
| Jordan: | 75.2% |
| Minneapolis: | 73.9% |
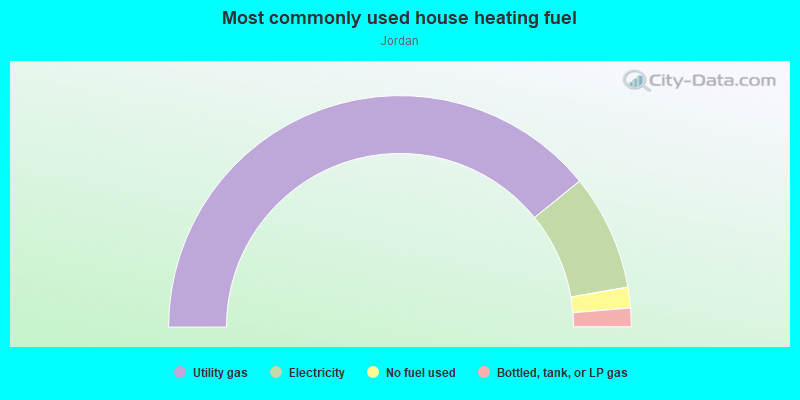
- 78.3%Utility gas
- 16.2%Electricity
- 2.9%No fuel used
- 2.6%Bottled, tank, or LP gas
Roads and streets:
30th Ave N
Length: 1.49 miles
Direction: E-W
Address range: 1200 to 2799
Direction: E-W
Address range: 1200 to 2799
27th Ave N
Length: 1.46 miles
Directions: E-W, N-S, SW-NE
Address range: 1200 to 2729
Directions: E-W, N-S, SW-NE
Address range: 1200 to 2729
29th Ave N
Length: 1.35 miles
Direction: E-W
Address range: 1200 to 2699
Direction: E-W
Address range: 1200 to 2699
26th Ave N
Length: 1.18 miles
Direction: E-W
Address range: 1151 to 2409
Direction: E-W
Address range: 1151 to 2409
James Ave N
Length: 1.15 miles
Directions: E-W, N-S, SE-NW, SW-NE
Address range: 2100 to 2999
Directions: E-W, N-S, SE-NW, SW-NE
Address range: 2100 to 2999
25th Ave N
Length: 0.96 miles
Directions: E-W, SE-NW, SW-NE
Address range: 1100 to 2199
Directions: E-W, SE-NW, SW-NE
Address range: 1100 to 2199
Irving Ave N
Length: 0.80 miles
Directions: N-S, SE-NW, SW-NE
Address range: 2100 to 2999
Directions: N-S, SE-NW, SW-NE
Address range: 2100 to 2999
Fremont Ave N
Length: 0.76 miles
Direction: N-S
Address range: 2100 to 2999
Direction: N-S
Address range: 2100 to 2999
Logan Ave N
Length: 0.64 miles
Directions: N-S, SE-NW, SW-NE
Address range: 2315 to 2999
Directions: N-S, SE-NW, SW-NE
Address range: 2315 to 2999
Girard Ave N
Length: 0.61 miles
Direction: N-S
Address range: 2100 to 2999
Direction: N-S
Address range: 2100 to 2999
22nd Ave N
Length: 0.57 miles
Directions: E-W, SE-NW, SW-NE
Address range: 1100 to 1699
Directions: E-W, SE-NW, SW-NE
Address range: 1100 to 1699
Hillside Ave N
Length: 0.55 miles
Directions: E-W, SE-NW
Address range: 1500 to 2099
Directions: E-W, SE-NW
Address range: 1500 to 2099
Co Rd 2 (Penn Ave N)
Length: 0.52 miles
Direction: N-S
Address range: 2418 to 2999
Direction: N-S
Address range: 2418 to 2999
23rd Ave N
Length: 0.52 miles
Directions: E-W, N-S, SE-NW
Address range: 1100 to 1399
Directions: E-W, N-S, SE-NW
Address range: 1100 to 1399
Morgan Ave N
Length: 0.49 miles
Direction: N-S
Address range: 2400 to 2999
Direction: N-S
Address range: 2400 to 2999
Newton Ave N
Length: 0.47 miles
Directions: N-S, SW-NE
Address range: 2400 to 2999
Directions: N-S, SW-NE
Address range: 2400 to 2999
Queen Ave N
Length: 0.47 miles
Direction: N-S
Address range: 2400 to 2999
Direction: N-S
Address range: 2400 to 2999
Humboldt Ave N
Length: 0.45 miles
Direction: N-S
Address range: 2500 to 2999
Direction: N-S
Address range: 2500 to 2999
Ilion Ave N
Length: 0.40 miles
Directions: E-W, N-S, SW-NE
Address range: 2100 to 2499
Directions: E-W, N-S, SW-NE
Address range: 2100 to 2499
Oliver Ave N
Length: 0.37 miles
Direction: N-S
Address range: 2657 to 2952
Direction: N-S
Address range: 2657 to 2952
Emerson Ave N
Length: 0.37 miles
Direction: N-S
Address range: 2652 to 2999
Direction: N-S
Address range: 2652 to 2999
Knox Ave N
Length: 0.33 miles
Direction: N-S
Address range: 2601 to 2999
Direction: N-S
Address range: 2601 to 2999
21st Ave N
Length: 0.33 miles
Direction: E-W
Address range: 1100 to 1499
Direction: E-W
Address range: 1100 to 1499
Co Rd 81 (W Broadway Ave)
Length: 0.32 miles
Direction: SE-NW
Address range: 1866 to 2399
Direction: SE-NW
Address range: 1866 to 2399
Russell Ave N
Length: 0.31 miles
Direction: N-S
Address range: 2600 to 2999
Direction: N-S
Address range: 2600 to 2999
24th Ave N
Length: 0.28 miles
Direction: E-W
Address range: 1100 to 1999
Direction: E-W
Address range: 1100 to 1999
N Willow Ave
Length: 0.25 miles
Direction: SE-NW
Address range: 1900 to 2199
Direction: SE-NW
Address range: 1900 to 2199
Thomas Ave N
Length: 0.25 miles
Direction: N-S
Address range: 2759 to 2999
Direction: N-S
Address range: 2759 to 2999
Sheridan Ave N
Length: 0.25 miles
Direction: N-S
Address range: 2759 to 2999
Direction: N-S
Address range: 2759 to 2999
Upton Ave N
Length: 0.12 miles
Direction: N-S
Address range: 2900 to 2999
Direction: N-S
Address range: 2900 to 2999