Lee (Lee Business District) neighborhood in Des Plaines, Illinois (IL), 60018, 60016 detailed profile
Settings
X

Business Search - 14 Million verified businesses
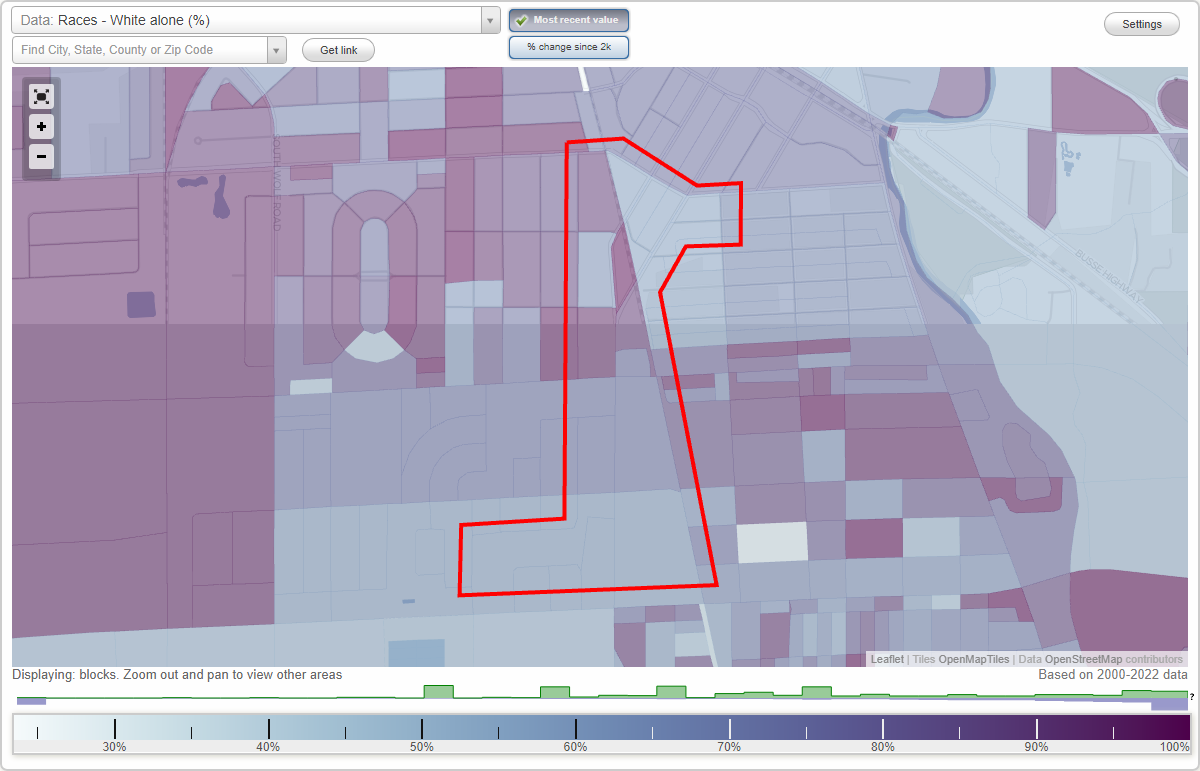
Area: 0.310 square miles
Population: 1,351
Population density:
| Lee (Lee Business District): | 4,363 people per square mile |
| Des Plaines: | 4,166 people per square mile |

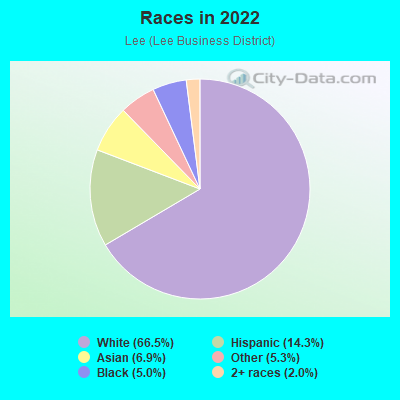
- 97466.5%White
- 21014.3%Hispanic or Latino
- 1016.9%Asian
- 785.3%Some other race
- 735.0%Black
- 292.0%Two or more races
Median household income in 2022:
| Lee (Lee Business District): | $108,678 |
| Des Plaines: | $86,552 |
Distribution of median household income
![Distribution of median household income]()
- 44Less than $10,000
- 33$10,000 to $19,999
- 26$20,000 to $29,999
- 13$30,000 to $39,999
- 21$40,000 to $49,999
- 51$50,000 to $59,999
- 46$60,000 to $74,999
- 61$75,000 to $99,999
- 48$100,000 to $124,999
- 71$125,000 to $149,999
- 50$150,000 to $199,999
- 96$200,000 or more

Distribution of owner-occupied house/condo value
![Distribution of owner-occupied house/condo value]()
- 10Less than $50,000
- 5$50,000 to $99,999
- 8$100,000 to $149,999
- 27$150,000 to $199,999
- 31$200,000 to $249,999
- 121$250,000 to $299,999
- 138$300,000 to $399,999
- 91$400,000 to $499,999
- 17$500,000 to $749,999
- 22$750,000 to $999,999

Distribution of rent paid by renters
![Distribution of rent paid by renters]()
- 20$600 to $699
- 13$700 to $799
- 35$800 to $899
- 44$900 to $999
- 14$1,000 to $1,249
- 42$1,250 to $1,499
- 33$1,500 to $1,999
- 27$2,000 or more

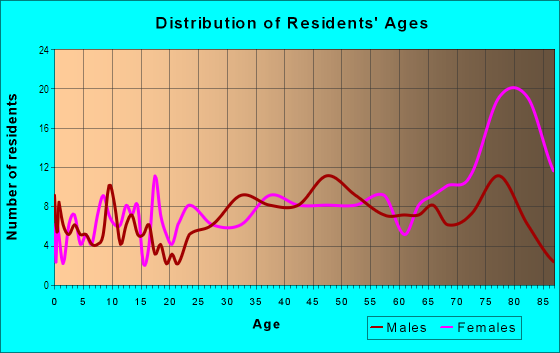
| Males: | 760 |
| Females: | 590 |
Males:
| This neighborhood: | 46.5 years |
| Whole city: | 40.9 years |
| This neighborhood: | 40.6 years |
| Whole city: | 44.5 years |
Average household size:
| Lee (Lee Business District): | 2.8 people |
| Des Plaines: | 2.6 people |
Percentage of family households:
| Lee (Lee Business District): | 55.6% |
| Des Plaines: | 45.8% |
| Here: | 63.1% |
| Des Plaines: | 50.9% |
Percentage of married-couple families with children (among all households):
| Lee (Lee Business District): | 27.7% |
| Des Plaines: | 29.6% |
Percentage of single-mother households (among all households):
| Lee (Lee Business District): | 1.5% |
| Des Plaines: | 5.6% |
Percentage of never married males 15 years old and over:
Percentage of never married females 15 years old and over:
| Lee (Lee Business District): | 14.3% |
| Des Plaines: | 17.1% |
Percentage of never married females 15 years old and over:
| Lee (Lee Business District): | 13.7% |
| city: | 14.2% |
Percentage of people that speak English not well or not at all:
| Lee (Lee Business District): | 2.5% |
| Des Plaines: | 7.9% |
Percentage of people born in this state:
Percentage of people born in another U.S. state:
Percentage of native residents but born outside the U.S.:
Percentage of foreign born residents:
| Here: | 71.7% |
| Des Plaines: | 59.2% |
Percentage of people born in another U.S. state:
| Lee (Lee Business District): | 10.4% |
| Des Plaines: | 8.7% |
Percentage of native residents but born outside the U.S.:
| Here: | 0.5% |
| city: | 1.3% |
Percentage of foreign born residents:
| Here: | 17.5% |
| Des Plaines: | 30.8% |
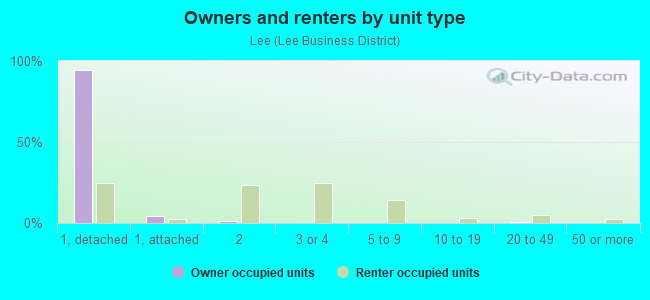
Owner-occupied
Renter-occupied

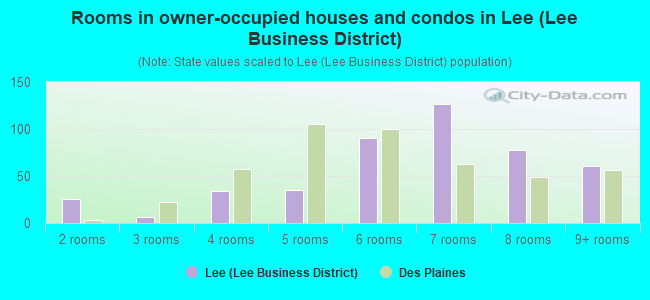
- Rooms in owner-occupied houses and condos in Lee <
> - 01 room
- 262 rooms
- 63 rooms
- 344 rooms
- 355 rooms
- 906 rooms
- 1277 rooms
- 788 rooms
- 619+ rooms
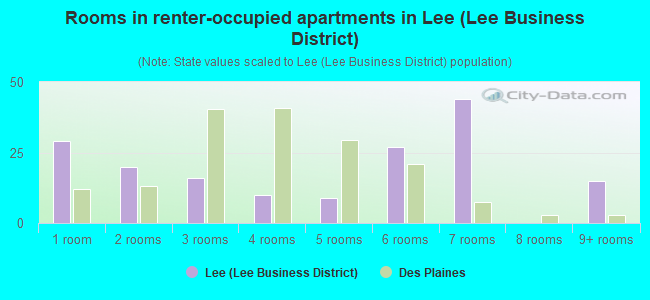
- Rooms in renter-occupied apartments in Lee <
> - 291 room
- 202 rooms
- 163 rooms
- 104 rooms
- 95 rooms
- 276 rooms
- 447 rooms
- 08 rooms
- 159+ rooms
Owner-occupied
Renter-occupied
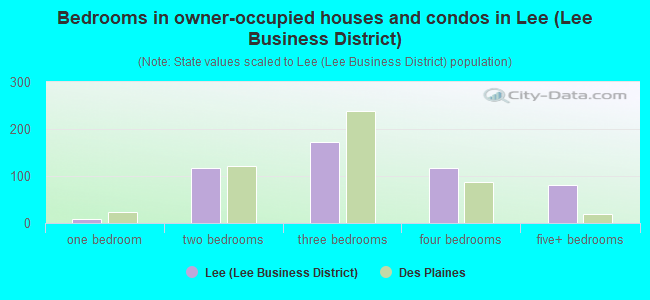
- Bedrooms in owner-occupied houses and condos in Lee <
> - 0no bedroom
- 81 bedroom
- 1162 bedrooms
- 1723 bedrooms
- 1174 bedrooms
- 815+ bedrooms
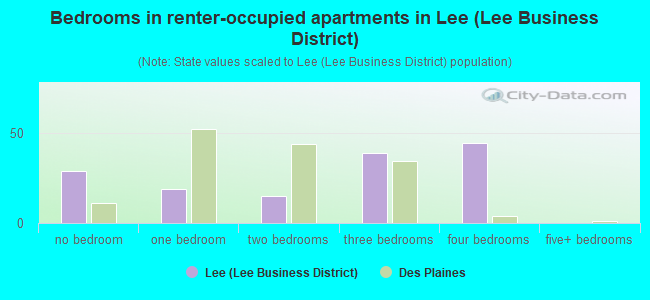
- Bedrooms in renter-occupied apartments in Lee <
> - 29no bedroom
- 191 bedroom
- 152 bedrooms
- 393 bedrooms
- 444 bedrooms
- 05+ bedrooms
Average number of cars or other vehicles available in houses/condos:
Average number of cars or other vehicles available in apartments:
| This neighborhood: | 2.5 |
| Des Plaines: | 1.9 |
Average number of cars or other vehicles available in apartments:
| Here: | 2.2 |
| city: | 1.4 |
Percentage of units with a mortgage:
| Lee (Lee Business District): | 58.4% |
| Des Plaines: | 61.5% |
Average estimated value of detached houses in 2022 (90.2% of all units):
| Lee (Lee Business District): | $304,468 |
| Des Plaines: | $346,047 |
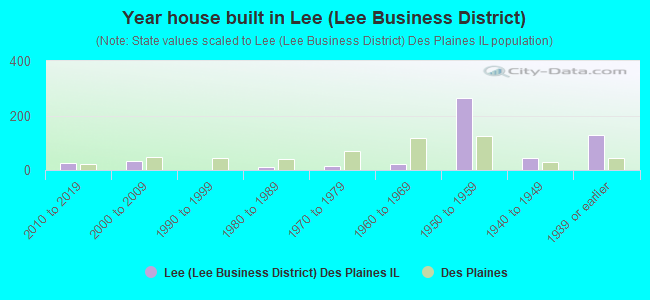
- Year house built in Lee <
> - 02020 or later
- 252010 to 2019
- 322000 to 2009
- 11990 to 1999
- 111980 to 1989
- 131970 to 1979
- 231960 to 1969
- 2641950 to 1959
- 431940 to 1949
- 1291939 or earlier
City-data.com crime index for city in 2020 (higher means more crime):
| City: | 77.8 |
| U.S. average: | 219.5 |
Travel time to work (commute)
![Travel time to work (commute)]()
- 13Less than 5 minutes
- 765 to 9 minutes
- 7410 to 14 minutes
- 10515 to 19 minutes
- 9020 to 24 minutes
- 5025 to 29 minutes
- 12530 to 34 minutes
- 2835 to 39 minutes
- 4040 to 44 minutes
- 2045 to 59 minutes
- 9760 to 89 minutes
- 990 or more minutes

Means of transportation to work
![Means of transportation to work]()
- 64.5%458Drove a car alone
- 3.9%28Carpooled
- 2.4%17Bus
- 0.6%4Subway or elevated rail
- 13.0%92Long-distance train or commuter rail
- 1.8%13Light rail, streetcar or trolley
- 1.3%9Motorcycle
- 1.8%13Bicycle
- 2.8%20Walked
- 0.7%5Other means
- 16.1%114Worked at home

Time leaving home to go to work
![Time leaving home to go to work]()
- 1612:00 a.m. to 4:59 a.m.
- 275:00 a.m. to 5:29 a.m.
- 455:30 a.m. to 5:59 a.m.
- 986:00 a.m. to 6:29 a.m.
- 906:30 a.m. to 6:59 a.m.
- 1177:00 a.m. to 7:29 a.m.
- 1037:30 a.m. to 7:59 a.m.
- 1028:00 a.m. to 8:29 a.m.
- 528:30 a.m. to 8:59 a.m.
- 319:00 a.m. to 9:59 a.m.
- 1410:00 a.m. to 10:59 a.m.
- 1011:00 a.m. to 11:59 a.m.
- 2612:00 p.m. to 3:59 p.m.
- 484:00 p.m. to 11:59 p.m.

Occupations of males:
- Percentage of males in management occupations (except farmers):
Here: 20.9% city: 9.6%
- Percentage of males in business and financial operations occupations:
Here: 14.8% city: 5.7%
- Percentage of males in computer and mathematical occupations:
Here: 3.8% city: 6.1%
- Percentage of males in architecture and engineering occupations:
Here: 1.6% city: 3.1%
- Percentage of males in education, training, and library occupations:
Here: 3.8% city: 3.4%
- Percentage of males in arts, design, entertainment, sports, and media occupations:
Here: 1.3% city: 1.1%
- Percentage of males in healthcare practitioners and technical occupations:
Here: 2.6% city: 4.4%
- Percentage of males in service occupations:
Here: 10.4% city: 9.2%
- Percentage of males in sales and office occupations:
Here: 27.1% city: 16.6%
- Percentage of males in construction, extraction, and maintenance occupations:
Here: 2.3% city: 8.8%
- Percentage of males in production occupations:
Here: 1.6% city: 7.4%
- Percentage of males in transportation occupations:
Here: 6.0% city: 8.1%
- Percentage of males in material moving occupations:
Here: 3.2% city: 7.7%
Occupations of females:
- Percentage of females in management occupations (except farmers):
Here: 7.7% city: 10.3%
- Percentage of females in business and financial operations occupations:
Here: 2.8% city: 7.4%
- Percentage of females in computer and mathematical occupations:
Here: 3.7% city: 2.2%
- Percentage of females in life, physical, and social science occupations:
Here: 3.6% city: 0.7%
- Percentage of females in community and social services occupations:
Here: 3.0% city: 2.7%
- Percentage of females in education, training, and library occupations:
Here: 14.7% city: 8.5%
- Percentage of females in arts, design, entertainment, sports, and media occupations:
Here: 5.7% city: 1.3%
- Percentage of females in healthcare practitioners and technical occupations:
Here: 11.3% city: 10.3%
- Percentage of females in service occupations:
Here: 17.9% city: 22.8%
- Percentage of females in sales and office occupations:
Here: 32.6% city: 25.2%
- Percentage of females in production occupations:
Here: 1.3% city: 3.4%
Percentage of people 16-64 in Armed Forces:
| Lee (Lee Business District): | 0.4% |
| Des Plaines: | 0.1% |
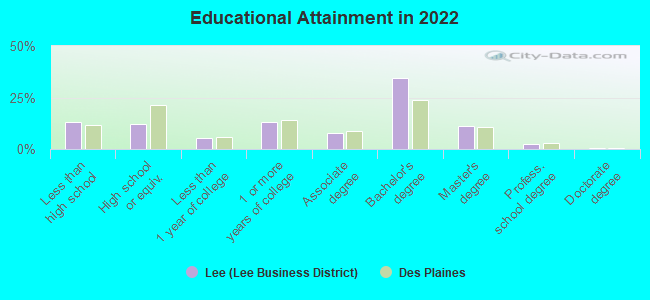
Education in this neighborhood (subdivision or community):
- Percentage of people 3 years and older in K-12 schools:
Lee (Lee Business District): 24.8% Des Plaines: 15.6%
- Percentage of people 3 years and older in undergraduate colleges:
Lee (Lee Business District): 5.8% Des Plaines: 4.5%
- Percentage of people 3 years and older in grad. or professional schools:
Lee (Lee Business District): 1.1% Des Plaines: 1.8%
- Percentage of students K-12 enrolled in private schools:
Lee (Lee Business District): 4.2% Des Plaines: 12.4%
Percentage of population below poverty level:
| Lee (Lee Business District): | 5.5% |
| Des Plaines: | 7.4% |
Median year owner moved in (as recorded in 2022):
| Lee (Lee Business District): | 2003 |
| Des Plaines: | 2006 |
Percentage of married-couple families with both working:
| Lee (Lee Business District): | 126.2% |
| Des Plaines: | 63.5% |
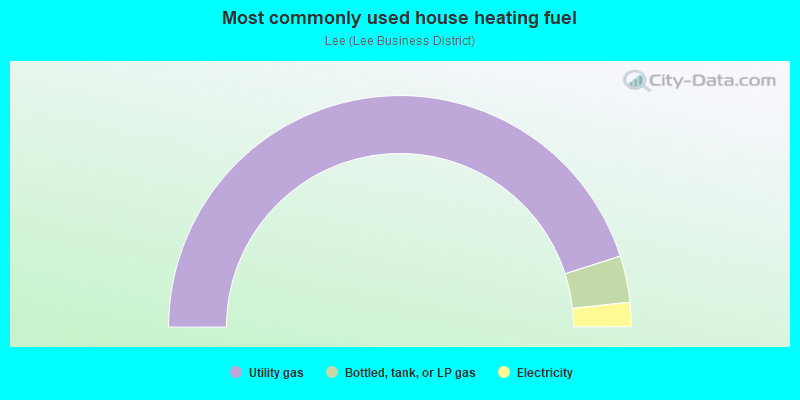
- 90.0%Utility gas
- 6.5%Bottled, tank, or LP gas
- 3.4%Electricity
Highways in this neighborhood:
Lee St (US Hwy 45, Mannheim Rd, US Hwy 12)
Length: 0.78 miles
Directions: N-S, SW-NE
Address range: 900 to 1499
Directions: N-S, SW-NE
Address range: 900 to 1499
Roads and streets:
Jeanette Ave (Jeannette Ave, Jeannette St)
Length: 0.50 miles
Direction: N-S
Address range: 800 to 1199
Direction: N-S
Address range: 800 to 1199
E Thacker St (E Dempster St, Thacker St)
Length: 0.36 miles
Directions: E-W, SE-NW
Address range: 1200 to 1403
Directions: E-W, SE-NW
Address range: 1200 to 1403
(Graceland Ave)
Length: 0.34 miles
Directions: N-S, SW-NE
Address range: 843 to 1099
Directions: N-S, SW-NE
Address range: 843 to 1099
Oakwood Ave
Length: 0.31 miles
Directions: E-W, N-S, SE-NW
Address range: 1107 to 1335
Directions: E-W, N-S, SE-NW
Address range: 1107 to 1335
Wicke Ave
Length: 0.30 miles
Directions: E-W, SW-NE
Address range: 900 to 1199
Directions: E-W, SW-NE
Address range: 900 to 1199
Forest Ave (E Forest Ave)
Length: 0.27 miles
Direction: E-W
Address range: 1110 to 1299
Direction: E-W
Address range: 1110 to 1299
E Algonquin Rd
Length: 0.25 miles
Direction: E-W
Address range: 1132 to 1249
Direction: E-W
Address range: 1132 to 1249
Jeannette St (Jeanette St)
Length: 0.24 miles
Directions: N-S, SW-NE
Address range: 1200 to 1499
Directions: N-S, SW-NE
Address range: 1200 to 1499
Ashland Ave
Length: 0.15 miles
Direction: E-W
Address range: 1200 to 1399
Direction: E-W
Address range: 1200 to 1399
Webster Ln
Length: 0.11 miles
Direction: N-S
Address range: 1462 to 1499
Direction: N-S
Address range: 1462 to 1499
E Walnut Ave
Length: 0.11 miles
Direction: E-W
Address range: 1101 to 1199
Direction: E-W
Address range: 1101 to 1199
Van Buren Ave
Length: 0.11 miles
Direction: E-W
Address range: 1123 to 1199
Direction: E-W
Address range: 1123 to 1199
Center St
Length: 0.10 miles
Direction: N-S
Address range: 900 to 986
Direction: N-S
Address range: 900 to 986
Executive Way
Length: 0.08 miles
Direction: E-W
Address range: 1062 to 1099
Direction: E-W
Address range: 1062 to 1099
E Thacker St (Dempster St)
Length: 0.08 miles
Direction: E-W
Address range: 1100 to 1199
Direction: E-W
Address range: 1100 to 1199
Deane St
Length: 0.06 miles
Directions: N-S, SE-NW
Directions: N-S, SE-NW
Railroad features:
Soo Line RR
Length: 0.95 miles
Direction: N-S
Direction: N-S