Lillard Addition neighborhood in Davis, California (CA), 95616 detailed profile
Settings
X

Business Search - 14 Million verified businesses
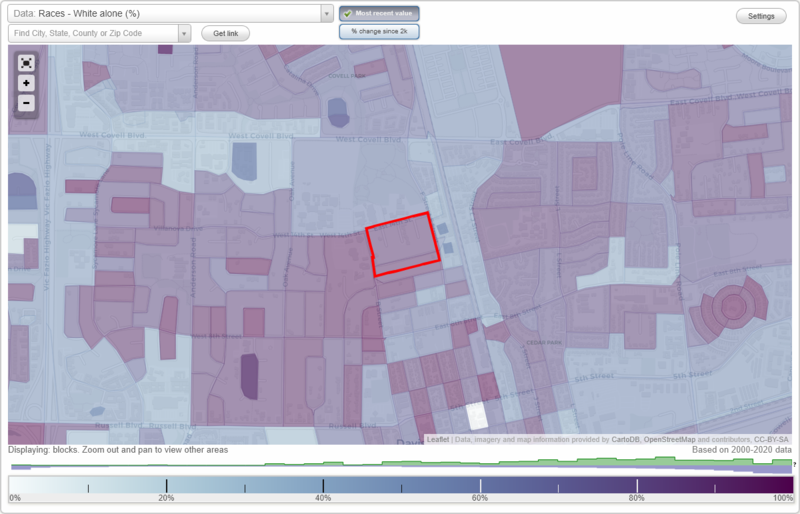
Area: 0.038 square miles
Population: 504
Population density:
| Lillard Addition: | 13,256 people per square mile |
| Davis: | 6,415 people per square mile |

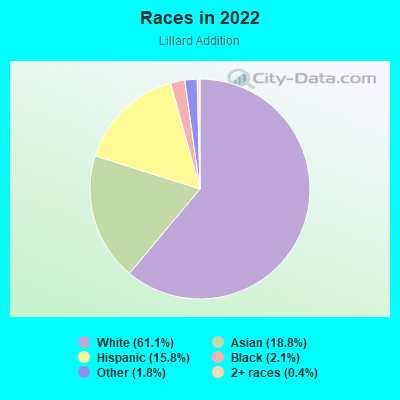
- 31361.1%White
- 9618.8%Asian
- 8115.8%Hispanic or Latino
- 112.1%Black
- 91.8%Some other race
- 20.4%Two or more races
Median household income in 2022:
| Lillard Addition: | $89,754 |
| Davis: | $67,373 |
Distribution of median household income
![Distribution of median household income]()
- 46Less than $10,000
- 11$10,000 to $19,999
- 24$20,000 to $29,999
- 16$30,000 to $39,999
- 15$40,000 to $49,999
- 21$50,000 to $59,999
- 6$60,000 to $74,999
- 62$75,000 to $99,999
- 10$100,000 to $124,999
- 25$125,000 to $149,999
- 27$150,000 to $199,999
- 12$200,000 or more

Distribution of owner-occupied house/condo value
![Distribution of owner-occupied house/condo value]()
- 4$50,000 to $99,999
- 1$400,000 to $499,999
- 19$500,000 to $749,999
- 36$750,000 to $999,999
- 9$1,000,000 or more

Distribution of rent paid by renters
![Distribution of rent paid by renters]()
- 9$500 to $599
- 5$900 to $999
- 15$1,000 to $1,249
- 29$1,250 to $1,499
- 123$1,500 to $1,999
- 9$2,000 or more

Median rent in 2022:
| Lillard Addition: | $1,661 |
| Davis: | $1,865 |
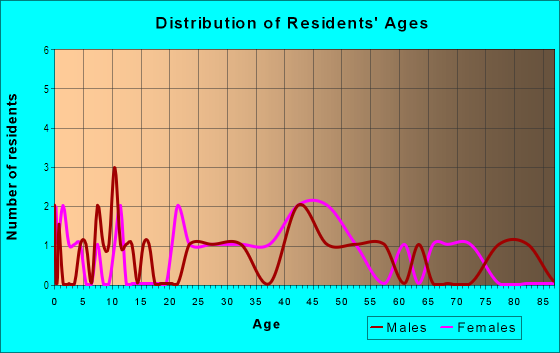
| Males: | 238 |
| Females: | 266 |
Males:
| This neighborhood: | 27.9 years |
| Whole city: | 24.9 years |
| This neighborhood: | 27.9 years |
| Whole city: | 26.5 years |
Average household size:
| Lillard Addition: | 2.1 people |
| Davis: | 2.5 people |
Percentage of family households:
| Lillard Addition: | 15.5% |
| Davis: | 31.5% |
| Here: | 28.1% |
| Davis: | 35.7% |
Percentage of married-couple families with children (among all households):
| Lillard Addition: | 46.9% |
| Davis: | 28.9% |
Percentage of single-mother households (among all households):
| Lillard Addition: | 4.0% |
| Davis: | 7.2% |
Percentage of never married males 15 years old and over:
Percentage of never married females 15 years old and over:
| Lillard Addition: | 30.5% |
| Davis: | 25.7% |
Percentage of never married females 15 years old and over:
| Lillard Addition: | 29.9% |
| city: | 29.9% |
Percentage of people that speak English not well or not at all:
| Lillard Addition: | 1.6% |
| Davis: | 2.8% |
Percentage of people born in this state:
Percentage of people born in another U.S. state:
Percentage of native residents but born outside the U.S.:
Percentage of foreign born residents:
| Here: | 60.7% |
| Davis: | 59.5% |
Percentage of people born in another U.S. state:
| Lillard Addition: | 21.8% |
| Davis: | 19.1% |
Percentage of native residents but born outside the U.S.:
| Here: | 1.9% |
| city: | 0.9% |
Percentage of foreign born residents:
| Here: | 15.6% |
| Davis: | 20.5% |
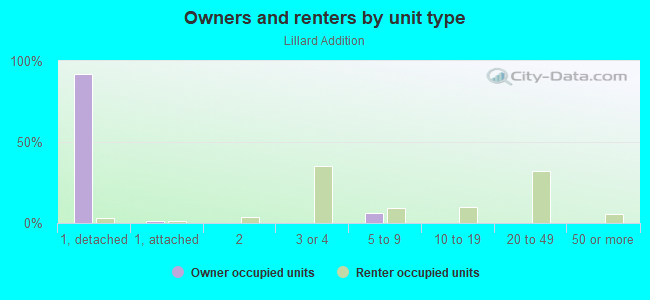
Owner-occupied
Renter-occupied

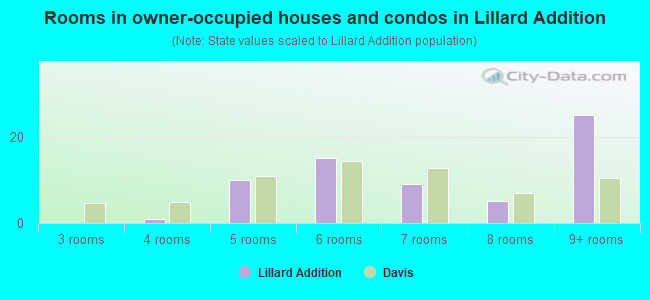
- Rooms in owner-occupied houses and condos in Lillard Addition
- 01 room
- 02 rooms
- 03 rooms
- 14 rooms
- 105 rooms
- 156 rooms
- 97 rooms
- 58 rooms
- 259+ rooms
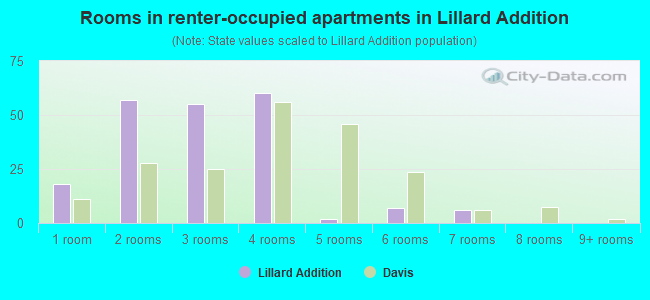
- Rooms in renter-occupied apartments in Lillard Addition
- 181 room
- 572 rooms
- 553 rooms
- 604 rooms
- 25 rooms
- 76 rooms
- 67 rooms
- 08 rooms
- 09+ rooms
Owner-occupied
Renter-occupied
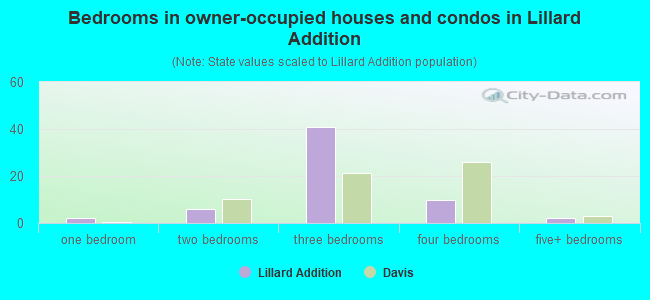
- Bedrooms in owner-occupied houses and condos in Lillard Addition
- 0no bedroom
- 21 bedroom
- 62 bedrooms
- 413 bedrooms
- 104 bedrooms
- 25+ bedrooms
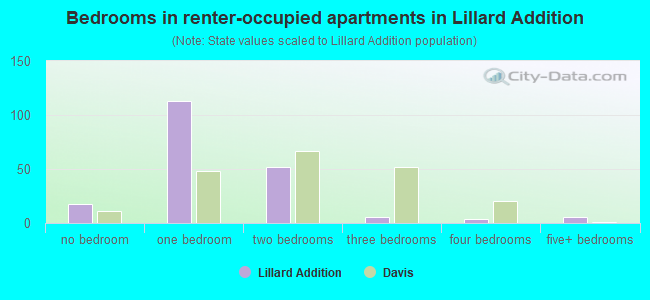
- Bedrooms in renter-occupied apartments in Lillard Addition
- 18no bedroom
- 1131 bedroom
- 522 bedrooms
- 63 bedrooms
- 44 bedrooms
- 65+ bedrooms
Average number of cars or other vehicles available in houses/condos:
Average number of cars or other vehicles available in apartments:
| This neighborhood: | 2.7 |
| Davis: | 2.0 |
Average number of cars or other vehicles available in apartments:
| Here: | 1.2 |
| city: | 1.7 |
Percentage of units with a mortgage:
| Lillard Addition: | 54.2% |
| Davis: | 61.8% |
Average estimated value of detached houses in 2022 (22.5% of all units):
| Lillard Addition: | $826,340 |
| Davis: | $1,006,726 |
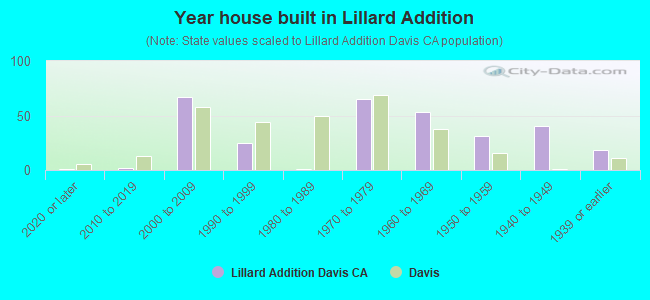
- Year house built in Lillard Addition
- 12020 or later
- 22010 to 2019
- 672000 to 2009
- 251990 to 1999
- 11980 to 1989
- 651970 to 1979
- 531960 to 1969
- 311950 to 1959
- 401940 to 1949
- 181939 or earlier
City-data.com crime index for city in 2020 (higher means more crime):
| City: | 213.3 |
| U.S. average: | 219.5 |
Travel time to work (commute)
![Travel time to work (commute)]()
- 13Less than 5 minutes
- 445 to 9 minutes
- 3810 to 14 minutes
- 2115 to 19 minutes
- 720 to 24 minutes
- 725 to 29 minutes
- 730 to 34 minutes
- 435 to 39 minutes
- 1340 to 44 minutes
- 1445 to 59 minutes
- 1560 to 89 minutes
- 390 or more minutes

Means of transportation to work
![Means of transportation to work]()
- 42.6%114Drove a car alone
- 5.6%15Carpooled
- 3.7%10Bus
- 22.8%61Bicycle
- 3.0%8Walked
- 21.7%58Worked at home

Time leaving home to go to work
![Time leaving home to go to work]()
- 1412:00 a.m. to 4:59 a.m.
- 15:30 a.m. to 5:59 a.m.
- 26:00 a.m. to 6:29 a.m.
- 96:30 a.m. to 6:59 a.m.
- 107:00 a.m. to 7:29 a.m.
- 257:30 a.m. to 7:59 a.m.
- 378:00 a.m. to 8:29 a.m.
- 178:30 a.m. to 8:59 a.m.
- 249:00 a.m. to 9:59 a.m.
- 510:00 a.m. to 10:59 a.m.
- 811:00 a.m. to 11:59 a.m.
- 912:00 p.m. to 3:59 p.m.
- 204:00 p.m. to 11:59 p.m.

Occupations of males:
- Percentage of males in business and financial operations occupations:
Here: 8.4% city: 5.9%
- Percentage of males in architecture and engineering occupations:
Here: 3.2% city: 5.7%
- Percentage of males in life, physical, and social science occupations:
Here: 34.3% city: 7.8%
- Percentage of males in legal occupations:
Here: 3.8% city: 2.7%
- Percentage of males in education, training, and library occupations:
Here: 18.4% city: 18.9%
- Percentage of males in arts, design, entertainment, sports, and media occupations:
Here: 1.8% city: 2.1%
- Percentage of males in service occupations:
Here: 3.8% city: 11.9%
- Percentage of males in sales and office occupations:
Here: 1.3% city: 10.8%
- Percentage of males in construction, extraction, and maintenance occupations:
Here: 2.8% city: 2.3%
- Percentage of males in production occupations:
Here: 2.0% city: 2.8%
- Percentage of males in transportation occupations:
Here: 22.5% city: 4.5%
- Percentage of males in material moving occupations:
Here: 3.1% city: 2.0%
Occupations of females:
- Percentage of females in management occupations (except farmers):
Here: 2.8% city: 7.9%
- Percentage of females in business and financial operations occupations:
Here: 4.3% city: 5.0%
- Percentage of females in computer and mathematical occupations:
Here: 1.9% city: 2.0%
- Percentage of females in community and social services occupations:
Here: 6.2% city: 2.7%
- Percentage of females in education, training, and library occupations:
Here: 28.0% city: 19.0%
- Percentage of females in arts, design, entertainment, sports, and media occupations:
Here: 3.6% city: 2.9%
- Percentage of females in healthcare practitioners and technical occupations:
Here: 2.7% city: 9.1%
- Percentage of females in service occupations:
Here: 28.3% city: 18.1%
- Percentage of females in sales and office occupations:
Here: 21.7% city: 16.0%
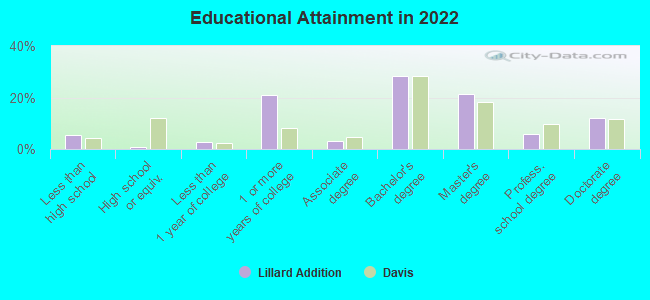
Education in this neighborhood (subdivision or community):
- Percentage of people 3 years and older in K-12 schools:
Lillard Addition: 4.8% Davis: 10.0%
- Percentage of people 3 years and older in undergraduate colleges:
Lillard Addition: 31.3% Davis: 24.3%
- Percentage of people 3 years and older in grad. or professional schools:
Lillard Addition: 9.0% Davis: 8.2%
- Percentage of students K-12 enrolled in private schools:
Lillard Addition: 29.2% Davis: 11.2%
Percentage of population below poverty level:
| Lillard Addition: | 30.9% |
| Davis: | 27.0% |
Median year owner moved in (as recorded in 2022):
Median year renter moved in (as recorded in 2022):
| Lillard Addition: | 1998 |
| Davis: | 2009 |
Median year renter moved in (as recorded in 2022):
| Lillard Addition: | 2019 |
| Davis: | 2022 |
Percentage of married-couple families with both working:
| Lillard Addition: | 72.3% |
| Davis: | 71.8% |
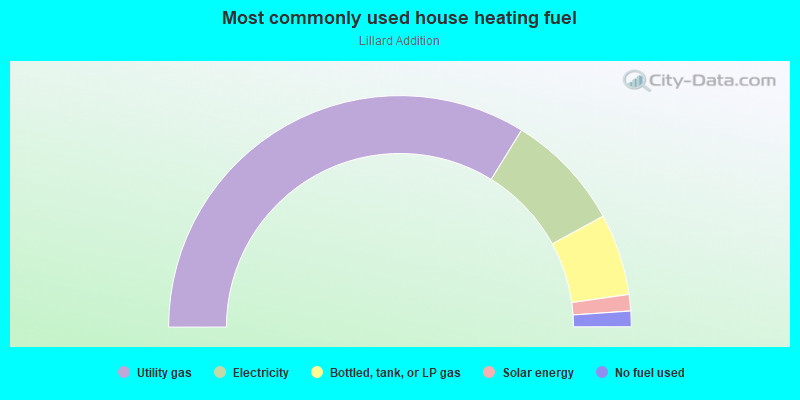
- 67.7%Utility gas
- 16.5%Electricity
- 11.4%Bottled, tank, or LP gas
- 2.3%Solar energy
- 2.2%No fuel used
Roads and streets:
E 14th St
Length: 0.15 miles
Direction: E-W
Address range: 400 to 599
Direction: E-W
Address range: 400 to 599
Aspen Pl
Length: 0.08 miles
Direction: N-S
Address range: 1200 to 1320
Direction: N-S
Address range: 1200 to 1320
Sequoia Pl
Length: 0.08 miles
Direction: N-S
Address range: 1212 to 1317
Direction: N-S
Address range: 1212 to 1317
Cedar Pl
Length: 0.07 miles
Direction: N-S
Address range: 1201 to 1319
Direction: N-S
Address range: 1201 to 1319