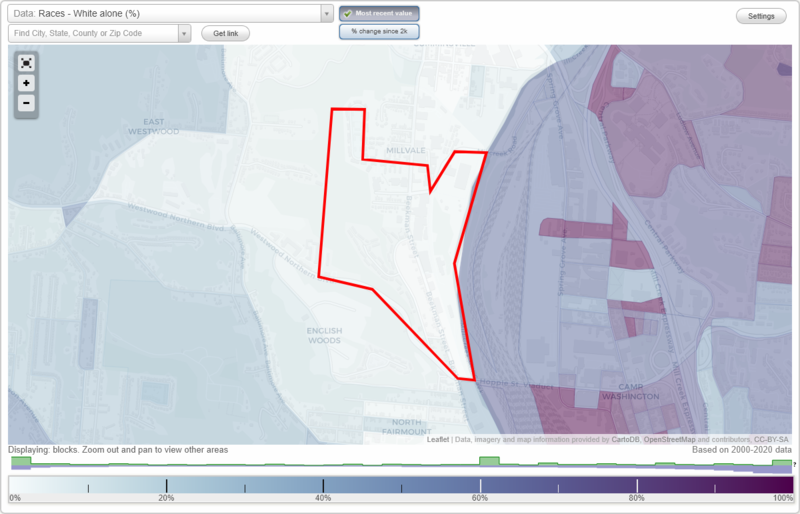
Millvale neighborhood in Cincinnati, Ohio (OH), 45225 detailed profile
Settings
X

Business Search - 14 Million verified businesses
Area: 0.290 square miles
Population: 1,038
Population density:
| Millvale: | 3,578 people per square mile |
| Cincinnati: | 3,970 people per square mile |

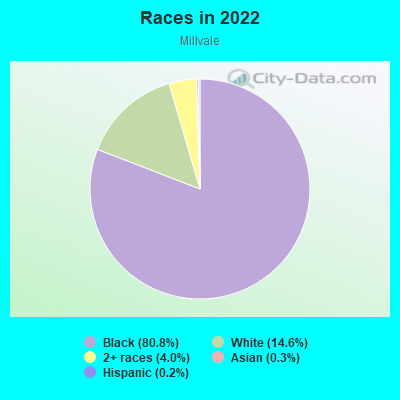
- 83980.8%Black
- 15214.6%White
- 424.0%Two or more races
- 30.3%Asian
- 20.2%Hispanic or Latino
Distribution of median household income
![Distribution of median household income]()
- 136Less than $10,000
- 141$10,000 to $19,999
- 114$20,000 to $29,999
- 56$30,000 to $39,999
- 46$40,000 to $49,999
- 19$50,000 to $59,999
- 36$60,000 to $74,999
- 16$75,000 to $99,999
- 11$100,000 to $124,999
- 7$125,000 to $149,999
- 15$150,000 to $199,999
- 11$200,000 or more

Distribution of owner-occupied house/condo value
![Distribution of owner-occupied house/condo value]()
- 104Less than $50,000
- 109$50,000 to $99,999
- 47$100,000 to $149,999
- 17$150,000 to $199,999
- 3$200,000 to $249,999
- 5$300,000 to $399,999
- 3$400,000 to $499,999

Distribution of rent paid by renters
![Distribution of rent paid by renters]()
- 109Less than $100
- 210$100 to $199
- 109$200 to $299
- 41$300 to $399
- 136$400 to $499
- 73$500 to $599
- 18$600 to $699
- 18$700 to $799
- 23$800 to $899
- 14$900 to $999
- 56$1,000 to $1,249
- 4$1,250 to $1,499
- 5$1,500 to $1,999

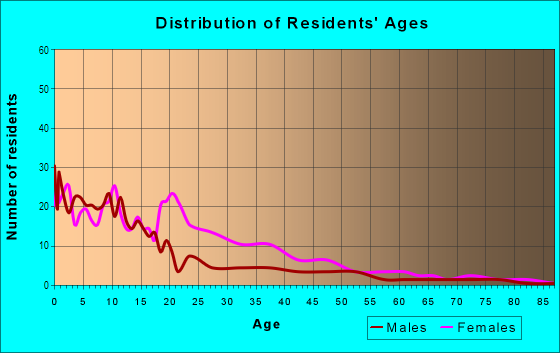
| Males: | 474 |
| Females: | 563 |
Males:
| This neighborhood: | 25.2 years |
| Whole city: | 32.7 years |
| This neighborhood: | 28.5 years |
| Whole city: | 34.2 years |
Average household size:
| Millvale: | 2.5 people |
| Cincinnati: | 23.0 people |
Percentage of family households:
| Millvale: | 56.3% |
| Cincinnati: | 33.3% |
| Here: | 10.2% |
| Cincinnati: | 23.1% |
Percentage of married-couple families with children (among all households):
| Millvale: | 1.8% |
| Cincinnati: | 22.2% |
Percentage of single-mother households (among all households):
| Millvale: | 35.2% |
| Cincinnati: | 22.0% |
Percentage of never married males 15 years old and over:
Percentage of never married females 15 years old and over:
| Millvale: | 31.8% |
| Cincinnati: | 27.2% |
Percentage of never married females 15 years old and over:
| Millvale: | 33.6% |
| city: | 29.6% |
Percentage of people that speak English not well or not at all:
| Millvale: | 1.3% |
| Cincinnati: | 1.5% |
Percentage of people born in this state:
Percentage of people born in another U.S. state:
Percentage of native residents but born outside the U.S.:
Percentage of foreign born residents:
| Here: | 78.4% |
| Cincinnati: | 69.3% |
Percentage of people born in another U.S. state:
| Millvale: | 16.6% |
| Cincinnati: | 23.5% |
Percentage of native residents but born outside the U.S.:
| Here: | 0.1% |
| city: | 1.0% |
Percentage of foreign born residents:
| Here: | 4.9% |
| Cincinnati: | 6.2% |
Owner-occupied
Renter-occupied

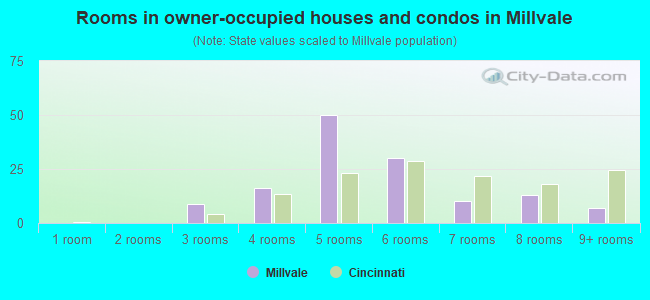
- Rooms in owner-occupied houses and condos in Millvale
- 01 room
- 02 rooms
- 93 rooms
- 164 rooms
- 505 rooms
- 306 rooms
- 107 rooms
- 138 rooms
- 79+ rooms
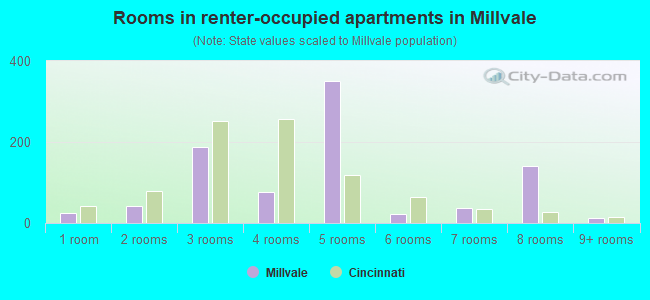
- Rooms in renter-occupied apartments in Millvale
- 241 room
- 412 rooms
- 1873 rooms
- 774 rooms
- 3515 rooms
- 236 rooms
- 377 rooms
- 1408 rooms
- 129+ rooms
Owner-occupied
Renter-occupied
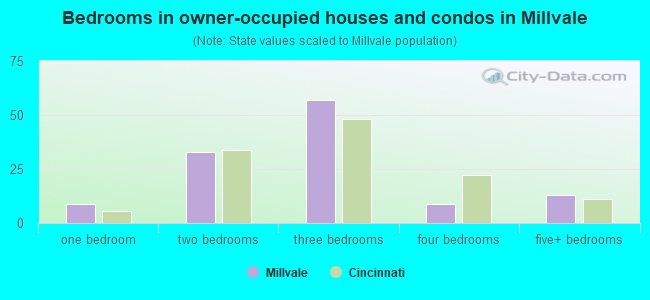
- Bedrooms in owner-occupied houses and condos in Millvale
- 0no bedroom
- 91 bedroom
- 332 bedrooms
- 573 bedrooms
- 94 bedrooms
- 135+ bedrooms
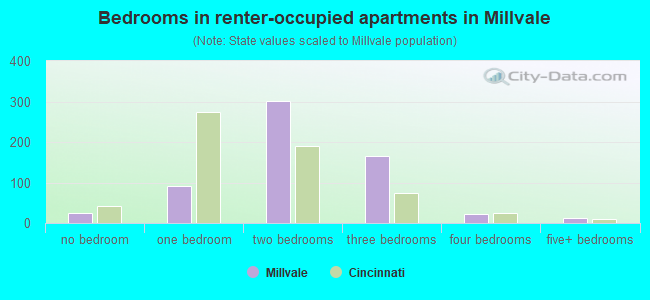
- Bedrooms in renter-occupied apartments in Millvale
- 24no bedroom
- 921 bedroom
- 3002 bedrooms
- 1653 bedrooms
- 224 bedrooms
- 125+ bedrooms
Average number of cars or other vehicles available in houses/condos:
Average number of cars or other vehicles available in apartments:
| This neighborhood: | 1.8 |
| Cincinnati: | 1.9 |
Average number of cars or other vehicles available in apartments:
| Here: | 0.5 |
| city: | 1.0 |
Percentage of units with a mortgage:
| Millvale: | 48.8% |
| Cincinnati: | 67.8% |
Average estimated value of detached houses in 2022 (27.2% of all units):
| Millvale: | $30,631 |
| Ohio: | $254,366 |
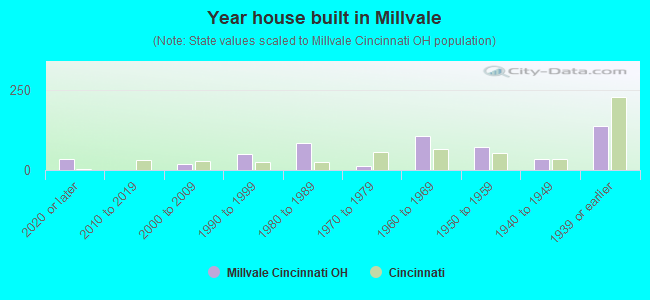
- Year house built in Millvale
- 362020 or later
- 02010 to 2019
- 182000 to 2009
- 491990 to 1999
- 851980 to 1989
- 131970 to 1979
- 1061960 to 1969
- 731950 to 1959
- 331940 to 1949
- 1381939 or earlier
City-data.com crime index for city in 2020 (higher means more crime):
| City: | 490.1 |
| U.S. average: | 219.5 |
Travel time to work (commute)
![Travel time to work (commute)]()
- 22Less than 5 minutes
- 55 to 9 minutes
- 2310 to 14 minutes
- 2015 to 19 minutes
- 4120 to 24 minutes
- 2325 to 29 minutes
- 1630 to 34 minutes
- 2235 to 39 minutes
- 2240 to 44 minutes
- 5345 to 59 minutes
- 290 or more minutes

Means of transportation to work
![Means of transportation to work]()
- 65.2%135Drove a car alone
- 29.5%61Carpooled
- 12.1%25Bus
- 3.9%8Bicycle
- 28.0%58Walked
- 12.6%26Other means
- 9.2%19Worked at home

Time leaving home to go to work
![Time leaving home to go to work]()
- 512:00 a.m. to 4:59 a.m.
- 25:00 a.m. to 5:29 a.m.
- 65:30 a.m. to 5:59 a.m.
- 456:00 a.m. to 6:29 a.m.
- 116:30 a.m. to 6:59 a.m.
- 67:00 a.m. to 7:29 a.m.
- 357:30 a.m. to 7:59 a.m.
- 258:00 a.m. to 8:29 a.m.
- 108:30 a.m. to 8:59 a.m.
- 179:00 a.m. to 9:59 a.m.
- 610:00 a.m. to 10:59 a.m.
- 3012:00 p.m. to 3:59 p.m.
- 194:00 p.m. to 11:59 p.m.

Occupations of males:
- Percentage of males in business and financial operations occupations:
Here: 3.1% city: 7.3%
- Percentage of males in service occupations:
Here: 36.0% city: 14.1%
- Percentage of males in sales and office occupations:
Here: 18.4% city: 15.7%
- Percentage of males in construction, extraction, and maintenance occupations:
Here: 13.7% city: 4.4%
- Percentage of males in production occupations:
Here: 10.4% city: 6.1%
- Percentage of males in transportation occupations:
Here: 5.2% city: 4.4%
- Percentage of males in material moving occupations:
Here: 12.2% city: 8.4%
Occupations of females:
- Percentage of females in management occupations (except farmers):
Here: 4.6% city: 9.5%
- Percentage of females in business and financial operations occupations:
Here: 2.7% city: 6.1%
- Percentage of females in healthcare practitioners and technical occupations:
Here: 7.9% city: 10.6%
- Percentage of females in service occupations:
Here: 20.3% city: 20.8%
- Percentage of females in sales and office occupations:
Here: 24.6% city: 23.8%
- Percentage of females in production occupations:
Here: 28.8% city: 4.0%
- Percentage of females in transportation occupations:
Here: 10.7% city: 1.4%
Percentage of people 16-64 in Armed Forces:
| Millvale: | 3.8% |
| Cincinnati: | 0.1% |
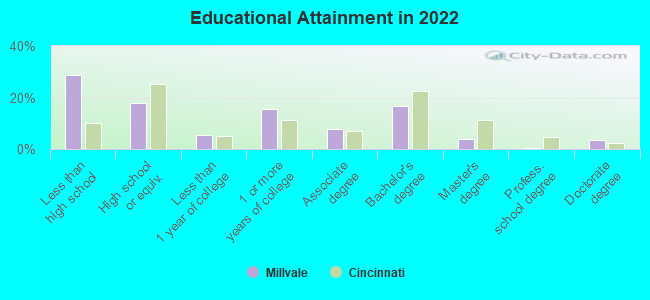
Education in this neighborhood (subdivision or community):
- Percentage of people 3 years and older in K-12 schools:
Millvale: 32.5% Cincinnati: 15.0%
- Percentage of people 3 years and older in undergraduate colleges:
Millvale: 7.6% Cincinnati: 10.0%
- Percentage of people 3 years and older in grad. or professional schools:
Millvale: 2.8% Cincinnati: 3.0%
- Percentage of students K-12 enrolled in private schools:
Millvale: 56.2% Cincinnati: 25.7%
Percentage of population below poverty level:
| Millvale: | 64.0% |
| Cincinnati: | 26.6% |
Median year owner moved in (as recorded in 2022):
Median year renter moved in (as recorded in 2022):
| Millvale: | 2000 |
| Cincinnati: | 2011 |
Median year renter moved in (as recorded in 2022):
| Millvale: | 2015 |
| Cincinnati: | 2020 |
Percentage of married-couple families with both working:
| Millvale: | 166.8% |
| Cincinnati: | 77.0% |
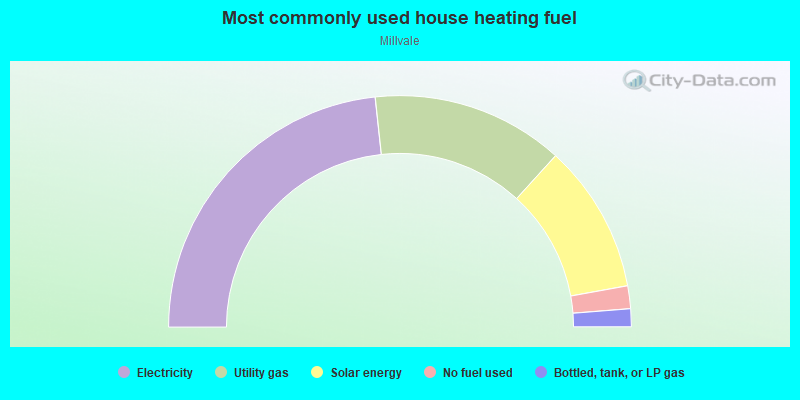
- 46.6%Electricity
- 26.9%Utility gas
- 20.8%Solar energy
- 3.2%No fuel used
- 2.5%Bottled, tank, or LP gas
Roads and streets:
Beekman St
Length: 0.53 miles
Directions: N-S, SE-NW
Address range: 3059 to 3299
Directions: N-S, SE-NW
Address range: 3059 to 3299
Moosewood Ave (Moosewood St)
Length: 0.42 miles
Directions: E-W, N-S, SE-NW, SW-NE
Address range: 3061 to 3399
Directions: E-W, N-S, SE-NW, SW-NE
Address range: 3061 to 3399
Mill Creek Rd
Length: 0.27 miles
Directions: N-S, SW-NE
Directions: N-S, SW-NE
Bowling Green Ct
Length: 0.20 miles
Directions: E-W, SE-NW
Address range: 3200 to 3399
Directions: E-W, SE-NW
Address range: 3200 to 3399
Millcreek Rd
Length: 0.16 miles
Direction: E-W
Address range: 3300 to 3399
Direction: E-W
Address range: 3300 to 3399
Neyer Ave
Length: 0.16 miles
Direction: E-W
Address range: 1900 to 1999
Direction: E-W
Address range: 1900 to 1999
Shetland St
Length: 0.13 miles
Direction: E-W
Direction: E-W
Yonkers Ave
Length: 0.11 miles
Direction: E-W
Address range: 1600 to 1629
Direction: E-W
Address range: 1600 to 1629
Fricke Rd
Length: 0.09 miles
Direction: E-W
Address range: 1824 to 1899
Direction: E-W
Address range: 1824 to 1899
Millvale Ct
Length: 0.04 miles
Directions: E-W, SE-NW
Address range: 2226 to 2399
Directions: E-W, SE-NW
Address range: 2226 to 2399
Austin Ave
Length: 0.03 miles
Direction: E-W
Direction: E-W
Hopple St
Length: 0.03 miles
Direction: E-W
Address range: 1500 to 1545
Direction: E-W
Address range: 1500 to 1545
Railroad features:
Csx RR
Length: 0.76 miles
Directions: N-S, SE-NW
Directions: N-S, SE-NW
Other features:
Mill Crk
Length: 0.22 miles
Directions: N-S, SE-NW
Directions: N-S, SE-NW