Nealtown Farms neighborhood in Greensboro, North Carolina (NC), 27405 detailed profile
Settings
X

Business Search - 14 Million verified businesses
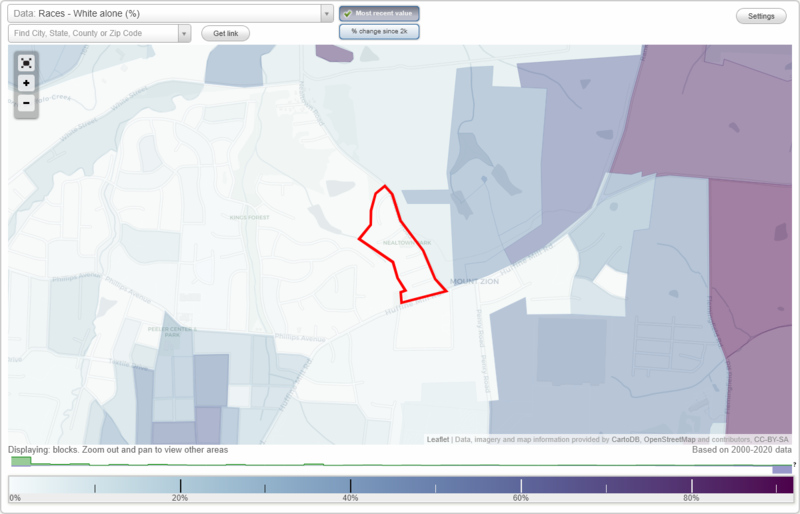
Area: 0.050 square miles
Population: 155
Population density:
| Nealtown Farms: | 3,100 people per square mile |
| Greensboro: | 2,876 people per square mile |

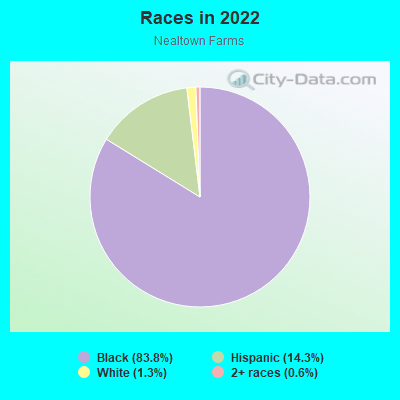
- 12983.8%Black
- 2214.3%Hispanic or Latino
- 21.3%White
- 10.6%Two or more races
Median household income in 2022:
| Nealtown Farms: | $47,644 |
| Greensboro: | $55,120 |
Distribution of median household income
![Distribution of median household income]()
- 3Less than $10,000
- 5$10,000 to $19,999
- 5$20,000 to $29,999
- 13$30,000 to $39,999
- 4$40,000 to $49,999
- 8$50,000 to $59,999
- 10$60,000 to $74,999
- 7$75,000 to $99,999
- 7$100,000 to $124,999
- 1$125,000 to $149,999
- 1$150,000 to $199,999
- 3$200,000 or more

Distribution of owner-occupied house/condo value
![Distribution of owner-occupied house/condo value]()
- 4Less than $50,000
- 15$50,000 to $99,999
- 21$100,000 to $149,999
- 6$150,000 to $199,999
- 5$200,000 to $249,999
- 1$250,000 to $299,999
- 2$300,000 to $399,999
- 1$500,000 to $749,999

Distribution of rent paid by renters
![Distribution of rent paid by renters]()
- 2Less than $100
- 2$100 to $199
- 3$200 to $299
- 1$300 to $399
- 1$400 to $499
- 1$500 to $599
- 2$600 to $699
- 1$700 to $799
- 5$800 to $899
- 1$900 to $999
- 3$1,000 to $1,249
- 1$1,500 to $1,999

Median rent in 2022:
| Nealtown Farms: | $852 |
| Greensboro: | $915 |
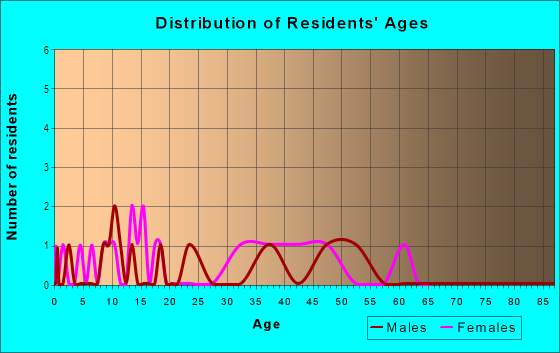
| Males: | 76 |
| Females: | 79 |
Males:
| This neighborhood: | 38.8 years |
| Whole city: | 32.4 years |
| This neighborhood: | 37.6 years |
| Whole city: | 35.3 years |
Average household size:
| Nealtown Farms: | 2.4 people |
| Greensboro: | 2.3 people |
Percentage of family households:
| Nealtown Farms: | 45.7% |
| Greensboro: | 43.6% |
| Here: | 31.7% |
| Greensboro: | 36.2% |
Percentage of married-couple families with children (among all households):
| Nealtown Farms: | 20.0% |
| Greensboro: | 22.4% |
Percentage of single-mother households (among all households):
| Nealtown Farms: | 10.6% |
| Greensboro: | 15.5% |
Percentage of never married males 15 years old and over:
Percentage of never married females 15 years old and over:
| Nealtown Farms: | 23.2% |
| Greensboro: | 20.8% |
Percentage of never married females 15 years old and over:
| Nealtown Farms: | 18.5% |
| city: | 23.9% |
Percentage of people that speak English not well or not at all:
| Nealtown Farms: | 2.7% |
| Greensboro: | 2.7% |
Percentage of people born in this state:
Percentage of people born in another U.S. state:
Percentage of native residents but born outside the U.S.:
Percentage of foreign born residents:
| Here: | 77.4% |
| Greensboro: | 52.7% |
Percentage of people born in another U.S. state:
| Nealtown Farms: | 15.8% |
| Greensboro: | 33.7% |
Percentage of native residents but born outside the U.S.:
| Here: | 0.5% |
| city: | 1.6% |
Percentage of foreign born residents:
| Here: | 6.3% |
| Greensboro: | 12.0% |
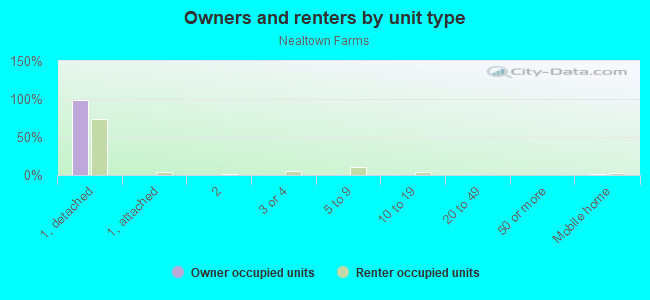
Owner-occupied
Renter-occupied

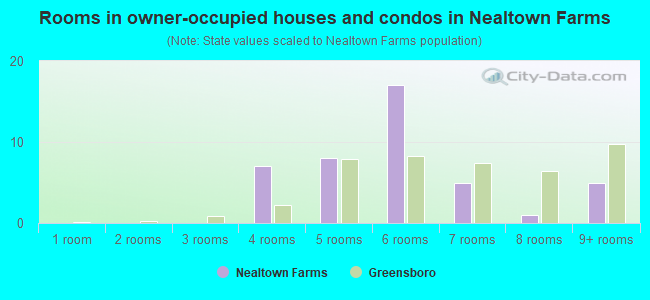
- Rooms in owner-occupied houses and condos in Nealtown Farms
- 01 room
- 02 rooms
- 03 rooms
- 74 rooms
- 85 rooms
- 176 rooms
- 57 rooms
- 18 rooms
- 59+ rooms
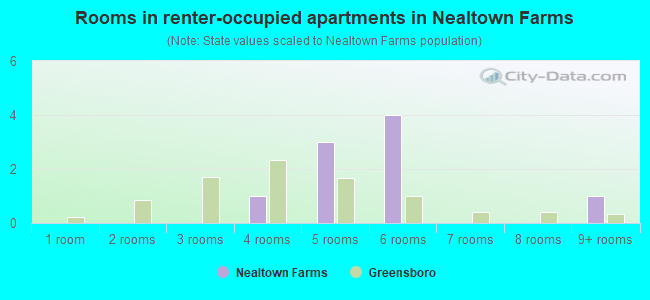
- Rooms in renter-occupied apartments in Nealtown Farms
- 01 room
- 02 rooms
- 03 rooms
- 14 rooms
- 35 rooms
- 46 rooms
- 07 rooms
- 08 rooms
- 19+ rooms
Owner-occupied
Renter-occupied
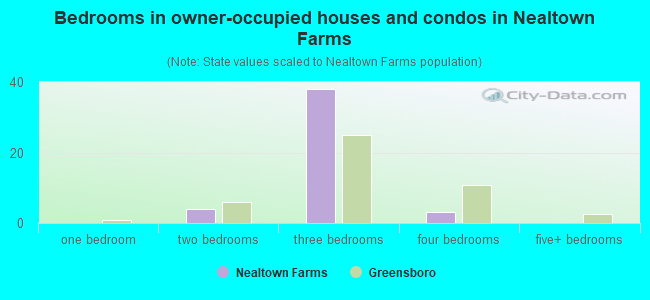
- Bedrooms in owner-occupied houses and condos in Nealtown Farms
- 0no bedroom
- 01 bedroom
- 42 bedrooms
- 383 bedrooms
- 34 bedrooms
- 05+ bedrooms
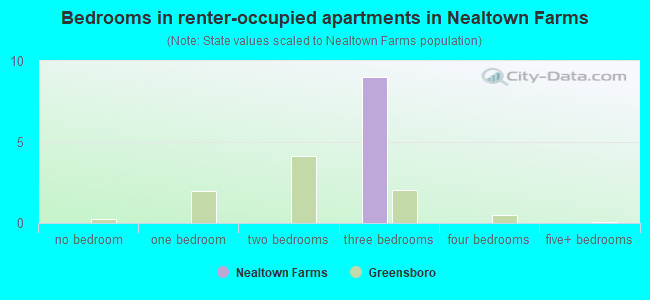
- Bedrooms in renter-occupied apartments in Nealtown Farms
- 0no bedroom
- 01 bedroom
- 02 bedrooms
- 93 bedrooms
- 04 bedrooms
- 05+ bedrooms
Average number of cars or other vehicles available in houses/condos:
Average number of cars or other vehicles available in apartments:
| This neighborhood: | 2.4 |
| Greensboro: | 2.0 |
Average number of cars or other vehicles available in apartments:
| Here: | 1.2 |
| city: | 1.4 |
Percentage of units with a mortgage:
| Nealtown Farms: | 63.0% |
| Greensboro: | 67.4% |
Average estimated value of detached houses in 2022 (100.0% of all units):
| Nealtown Farms: | $124,763 |
| Greensboro: | $297,193 |
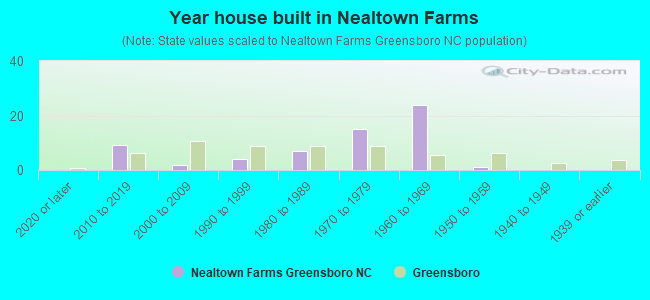
- Year house built in Nealtown Farms
- 02020 or later
- 92010 to 2019
- 22000 to 2009
- 41990 to 1999
- 71980 to 1989
- 151970 to 1979
- 241960 to 1969
- 11950 to 1959
- 01940 to 1949
- 01939 or earlier
City-data.com crime index for city in 2020 (higher means more crime):
| City: | 435.6 |
| U.S. average: | 219.5 |
Travel time to work (commute)
![Travel time to work (commute)]()
- 2Less than 5 minutes
- 35 to 9 minutes
- 810 to 14 minutes
- 1615 to 19 minutes
- 920 to 24 minutes
- 525 to 29 minutes
- 630 to 34 minutes
- 135 to 39 minutes
- 460 to 89 minutes
- 190 or more minutes

Means of transportation to work
![Means of transportation to work]()
- 84.9%66Drove a car alone
- 6.4%5Carpooled
- 1.3%1Bus
- 3.9%3Worked at home

Time leaving home to go to work
![Time leaving home to go to work]()
- 312:00 a.m. to 4:59 a.m.
- 15:00 a.m. to 5:29 a.m.
- 55:30 a.m. to 5:59 a.m.
- 46:00 a.m. to 6:29 a.m.
- 66:30 a.m. to 6:59 a.m.
- 57:00 a.m. to 7:29 a.m.
- 57:30 a.m. to 7:59 a.m.
- 48:00 a.m. to 8:29 a.m.
- 38:30 a.m. to 8:59 a.m.
- 69:00 a.m. to 9:59 a.m.
- 512:00 p.m. to 3:59 p.m.
- 64:00 p.m. to 11:59 p.m.

Occupations of males:
- Percentage of males in management occupations (except farmers):
Here: 8.3% city: 10.2%
- Percentage of males in community and social services occupations:
Here: 2.7% city: 1.4%
- Percentage of males in service occupations:
Here: 23.9% city: 14.3%
- Percentage of males in sales and office occupations:
Here: 21.0% city: 17.1%
- Percentage of males in construction, extraction, and maintenance occupations:
Here: 11.3% city: 6.0%
- Percentage of males in production occupations:
Here: 10.3% city: 7.5%
- Percentage of males in transportation occupations:
Here: 4.0% city: 6.8%
- Percentage of males in material moving occupations:
Here: 15.7% city: 9.6%
Occupations of females:
- Percentage of females in management occupations (except farmers):
Here: 7.5% city: 7.8%
- Percentage of females in business and financial operations occupations:
Here: 4.6% city: 5.5%
- Percentage of females in computer and mathematical occupations:
Here: 1.9% city: 2.1%
- Percentage of females in architecture and engineering occupations:
Here: 5.2% city: 0.5%
- Percentage of females in life, physical, and social science occupations:
Here: 4.8% city: 1.0%
- Percentage of females in legal occupations:
Here: 4.8% city: 0.7%
- Percentage of females in education, training, and library occupations:
Here: 9.5% city: 10.3%
- Percentage of females in healthcare practitioners and technical occupations:
Here: 1.5% city: 8.6%
- Percentage of females in service occupations:
Here: 24.5% city: 19.4%
- Percentage of females in sales and office occupations:
Here: 22.5% city: 29.0%
- Percentage of females in construction, extraction, and maintenance occupations:
Here: 2.5% city: 0.5%
- Percentage of females in production occupations:
Here: 4.8% city: 5.2%
- Percentage of females in transportation occupations:
Here: 1.2% city: 1.5%
- Percentage of females in material moving occupations:
Here: 5.0% city: 2.7%
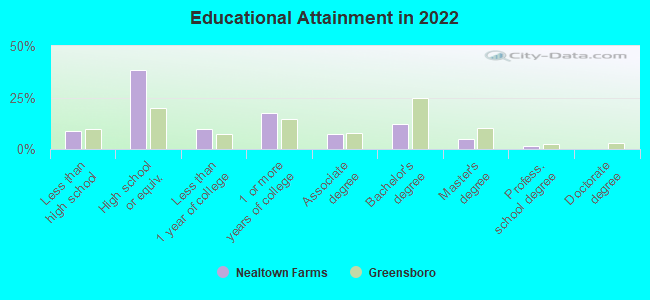
Education in this neighborhood (subdivision or community):
- Percentage of people 3 years and older in K-12 schools:
Nealtown Farms: 13.7% Greensboro: 17.6%
- Percentage of people 3 years and older in undergraduate colleges:
Nealtown Farms: 3.3% Greensboro: 11.2%
- Percentage of people 3 years and older in grad. or professional schools:
Nealtown Farms: 0.0% Greensboro: 2.6%
- Percentage of students K-12 enrolled in private schools:
Nealtown Farms: 0.0% Greensboro: 13.3%
Percentage of population below poverty level:
| Nealtown Farms: | 36.6% |
| Greensboro: | 21.9% |
Median year owner moved in (as recorded in 2022):
Median year renter moved in (as recorded in 2022):
| Nealtown Farms: | 2004 |
| Greensboro: | 2010 |
Median year renter moved in (as recorded in 2022):
| Nealtown Farms: | 2017 |
| Greensboro: | 2020 |
Percentage of married-couple families with both working:
| Nealtown Farms: | 57.7% |
| Greensboro: | 70.9% |
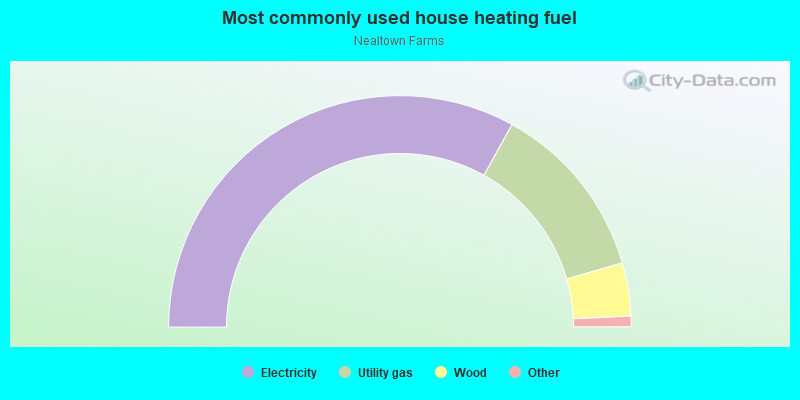
- 66.1%Electricity
- 25.0%Utility gas
- 7.4%Wood
- 1.0%Bottled, tank, or LP gas
- 0.5%Fuel oil, kerosene, etc.
Roads and streets:
Nealtown Rd
Length: 0.43 miles
Directions: N-S, SE-NW
Address range: 900 to 1205
Directions: N-S, SE-NW
Address range: 900 to 1205
Rocky Ridge Pt
Length: 0.14 miles
Directions: N-S, SE-NW, SW-NE
Address range: 1 to 99
Directions: N-S, SE-NW, SW-NE
Address range: 1 to 99
Canton Ave
Length: 0.13 miles
Direction: E-W
Address range: 1500 to 1599
Direction: E-W
Address range: 1500 to 1599
Crite Ct
Length: 0.13 miles
Directions: E-W, SW-NE
Address range: 1 to 99
Directions: E-W, SW-NE
Address range: 1 to 99
Nealtown Way
Length: 0.10 miles
Direction: E-W
Address range: 1 to 99
Direction: E-W
Address range: 1 to 99
Atherton Ct
Length: 0.07 miles
Direction: E-W
Address range: 1 to 99
Direction: E-W
Address range: 1 to 99