Northeast neighborhood in Wheaton, Illinois (IL), 60187 detailed profile
Settings
X

Business Search - 14 Million verified businesses
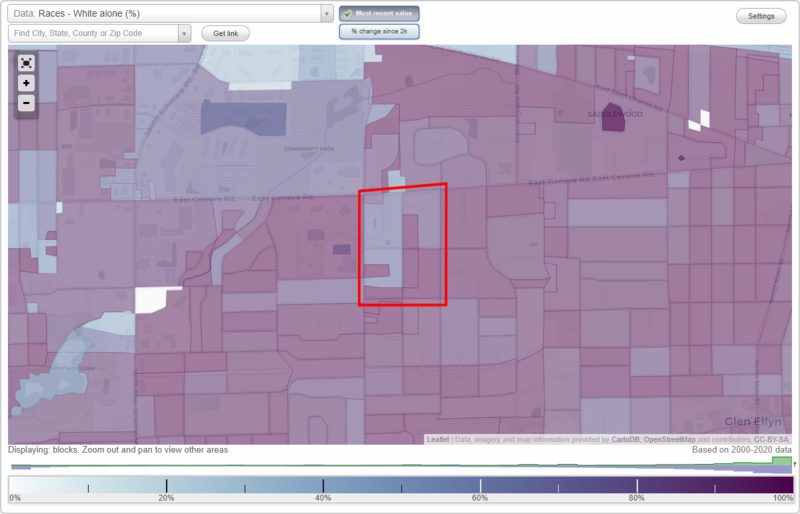
Area: 0.112 square miles
Population: 282
Population density:
| Northeast: | 2,518 people per square mile |
| Wheaton: | 4,783 people per square mile |

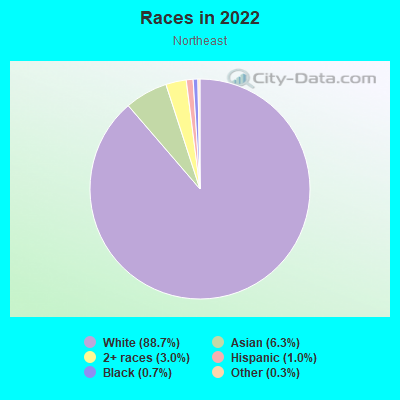
- 26688.7%White
- 196.3%Asian
- 93.0%Two or more races
- 31.0%Hispanic or Latino
- 20.7%Black
- 10.3%Some other race
Median household income in 2022:
| Northeast: | $92,917 |
| Wheaton: | $113,523 |
Distribution of median household income
![Distribution of median household income]()
- 9Less than $10,000
- 3$10,000 to $19,999
- 7$20,000 to $29,999
- 9$30,000 to $39,999
- 4$40,000 to $49,999
- 2$50,000 to $59,999
- 7$60,000 to $74,999
- 32$75,000 to $99,999
- 11$100,000 to $124,999
- 17$125,000 to $149,999
- 14$150,000 to $199,999
- 22$200,000 or more

Distribution of owner-occupied house/condo value
![Distribution of owner-occupied house/condo value]()
- 3Less than $50,000
- 1$50,000 to $99,999
- 3$100,000 to $149,999
- 3$150,000 to $199,999
- 5$200,000 to $249,999
- 18$250,000 to $299,999
- 31$300,000 to $399,999
- 13$400,000 to $499,999
- 20$500,000 to $749,999
- 13$750,000 to $999,999
- 1$1,000,000 or more

Distribution of rent paid by renters
![Distribution of rent paid by renters]()
- 1$700 to $799
- 2$800 to $899
- 6$1,000 to $1,249
- 15$1,250 to $1,499
- 13$1,500 to $1,999
- 3$2,000 or more

Median rent in 2022:
| Northeast: | $1,482 |
| Wheaton: | $1,527 |
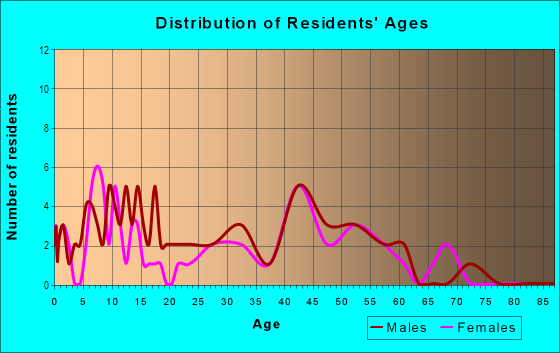
| Males: | 136 |
| Females: | 145 |
Males:
| This neighborhood: | 38.1 years |
| Whole city: | 36.0 years |
| This neighborhood: | 38.9 years |
| Whole city: | 39.0 years |
Average household size:
| Northeast: | 2.2 people |
| Wheaton: | 2.5 people |
Percentage of family households:
| Northeast: | 38.7% |
| Wheaton: | 47.8% |
| Here: | 62.4% |
| Wheaton: | 57.2% |
Percentage of married-couple families with children (among all households):
| Northeast: | 45.6% |
| Wheaton: | 33.6% |
Percentage of single-mother households (among all households):
| Northeast: | 1.9% |
| Wheaton: | 3.0% |
Percentage of never married males 15 years old and over:
Percentage of never married females 15 years old and over:
| Northeast: | 7.1% |
| Wheaton: | 15.4% |
Percentage of never married females 15 years old and over:
| Northeast: | 7.8% |
| city: | 15.8% |
Percentage of people that speak English not well or not at all:
| Northeast: | 0.0% |
| Wheaton: | 1.8% |
Percentage of people born in this state:
Percentage of people born in another U.S. state:
Percentage of native residents but born outside the U.S.:
Percentage of foreign born residents:
| Here: | 59.9% |
| Wheaton: | 62.0% |
Percentage of people born in another U.S. state:
| Northeast: | 28.6% |
| Wheaton: | 25.2% |
Percentage of native residents but born outside the U.S.:
| Here: | 1.4% |
| city: | 1.7% |
Percentage of foreign born residents:
| Here: | 10.1% |
| Wheaton: | 11.1% |
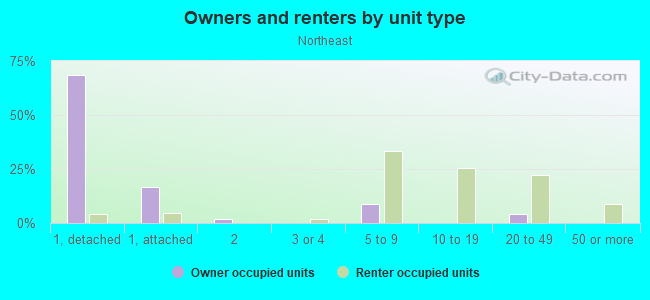
Owner-occupied
Renter-occupied

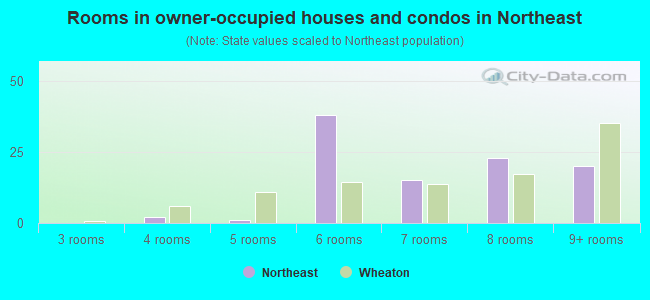
- Rooms in owner-occupied houses and condos in Northeast
- 01 room
- 02 rooms
- 03 rooms
- 24 rooms
- 15 rooms
- 386 rooms
- 157 rooms
- 238 rooms
- 209+ rooms
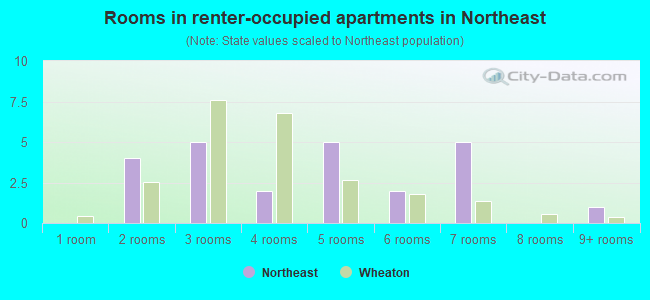
- Rooms in renter-occupied apartments in Northeast
- 01 room
- 42 rooms
- 53 rooms
- 24 rooms
- 55 rooms
- 26 rooms
- 57 rooms
- 08 rooms
- 19+ rooms
Owner-occupied
Renter-occupied
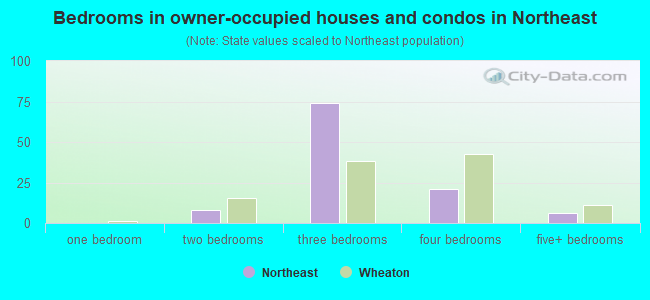
- Bedrooms in owner-occupied houses and condos in Northeast
- 0no bedroom
- 01 bedroom
- 82 bedrooms
- 743 bedrooms
- 214 bedrooms
- 65+ bedrooms
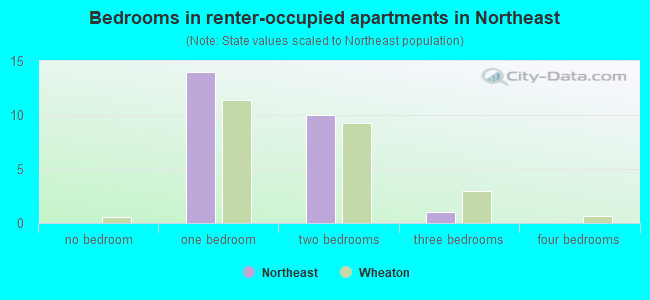
- Bedrooms in renter-occupied apartments in Northeast
- 0no bedroom
- 141 bedroom
- 102 bedrooms
- 13 bedrooms
- 04 bedrooms
- 05+ bedrooms
Average number of cars or other vehicles available in houses/condos:
Average number of cars or other vehicles available in apartments:
| This neighborhood: | 1.8 |
| Wheaton: | 1.9 |
Average number of cars or other vehicles available in apartments:
| Here: | 0.7 |
| city: | 1.3 |
Percentage of units with a mortgage:
| Northeast: | 74.7% |
| Wheaton: | 67.6% |
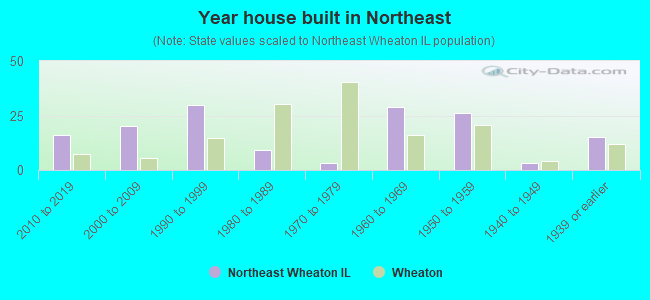
- Year house built in Northeast
- 02020 or later
- 162010 to 2019
- 202000 to 2009
- 301990 to 1999
- 91980 to 1989
- 31970 to 1979
- 291960 to 1969
- 261950 to 1959
- 31940 to 1949
- 151939 or earlier
City-data.com crime index for city in 2020 (higher means more crime):
| City: | 123.6 |
| U.S. average: | 219.5 |
Travel time to work (commute)
![Travel time to work (commute)]()
- 4Less than 5 minutes
- 175 to 9 minutes
- 2210 to 14 minutes
- 915 to 19 minutes
- 1520 to 24 minutes
- 325 to 29 minutes
- 1130 to 34 minutes
- 735 to 39 minutes
- 1140 to 44 minutes
- 945 to 59 minutes
- 1060 to 89 minutes
- 290 or more minutes

Means of transportation to work
![Means of transportation to work]()
- 70.3%94Drove a car alone
- 2.2%3Carpooled
- 11.2%15Long-distance train or commuter rail
- 0.7%1Taxi
- 0.7%1Walked
- 17.9%24Worked at home

Time leaving home to go to work
![Time leaving home to go to work]()
- 612:00 a.m. to 4:59 a.m.
- 25:00 a.m. to 5:29 a.m.
- 45:30 a.m. to 5:59 a.m.
- 116:00 a.m. to 6:29 a.m.
- 86:30 a.m. to 6:59 a.m.
- 197:00 a.m. to 7:29 a.m.
- 187:30 a.m. to 7:59 a.m.
- 218:00 a.m. to 8:29 a.m.
- 58:30 a.m. to 8:59 a.m.
- 79:00 a.m. to 9:59 a.m.
- 210:00 a.m. to 10:59 a.m.
- 412:00 p.m. to 3:59 p.m.
- 124:00 p.m. to 11:59 p.m.

Occupations of males:
- Percentage of males in management occupations (except farmers):
Here: 8.4% city: 18.0%
- Percentage of males in business and financial operations occupations:
Here: 5.0% city: 9.4%
- Percentage of males in computer and mathematical occupations:
Here: 6.1% city: 6.1%
- Percentage of males in architecture and engineering occupations:
Here: 5.3% city: 5.2%
- Percentage of males in life, physical, and social science occupations:
Here: 3.4% city: 1.5%
- Percentage of males in community and social services occupations:
Here: 1.5% city: 1.6%
- Percentage of males in legal occupations:
Here: 2.5% city: 3.1%
- Percentage of males in education, training, and library occupations:
Here: 22.9% city: 4.8%
- Percentage of males in healthcare practitioners and technical occupations:
Here: 3.4% city: 2.8%
- Percentage of males in service occupations:
Here: 6.1% city: 9.5%
- Percentage of males in sales and office occupations:
Here: 19.6% city: 20.5%
- Percentage of males in construction, extraction, and maintenance occupations:
Here: 2.5% city: 3.8%
- Percentage of males in production occupations:
Here: 8.4% city: 4.3%
- Percentage of males in material moving occupations:
Here: 9.8% city: 3.2%
Occupations of females:
- Percentage of females in management occupations (except farmers):
Here: 4.4% city: 14.2%
- Percentage of females in business and financial operations occupations:
Here: 16.6% city: 10.1%
- Percentage of females in community and social services occupations:
Here: 16.2% city: 3.1%
- Percentage of females in education, training, and library occupations:
Here: 23.3% city: 12.8%
- Percentage of females in arts, design, entertainment, sports, and media occupations:
Here: 7.4% city: 2.5%
- Percentage of females in healthcare practitioners and technical occupations:
Here: 22.0% city: 9.7%
- Percentage of females in service occupations:
Here: 3.0% city: 14.6%
- Percentage of females in sales and office occupations:
Here: 6.4% city: 24.6%
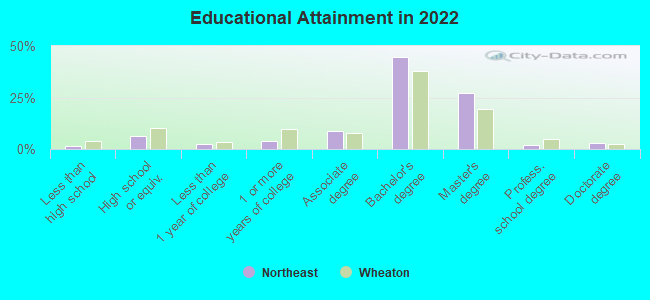
Education in this neighborhood (subdivision or community):
- Percentage of people 3 years and older in K-12 schools:
Northeast: 20.3% Wheaton: 16.5%
- Percentage of people 3 years and older in undergraduate colleges:
Northeast: 1.1% Wheaton: 9.3%
- Percentage of people 3 years and older in grad. or professional schools:
Northeast: 2.7% Wheaton: 1.9%
- Percentage of students K-12 enrolled in private schools:
Northeast: 50.9% Wheaton: 16.1%
Percentage of population below poverty level:
| Northeast: | 6.7% |
| Wheaton: | 5.6% |
Median year owner moved in (as recorded in 2022):
Median year renter moved in (as recorded in 2022):
| Northeast: | 2010 |
| Wheaton: | 2008 |
Median year renter moved in (as recorded in 2022):
| Northeast: | 2019 |
| Wheaton: | 2018 |
Percentage of married-couple families with both working:
| Northeast: | 73.2% |
| Wheaton: | 66.4% |
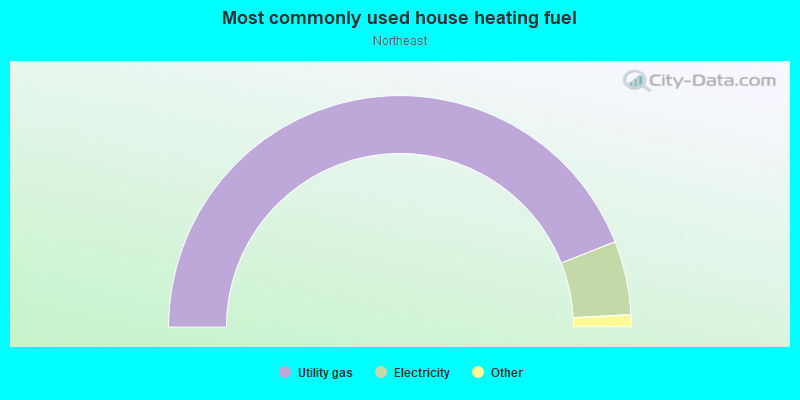
- 87.9%Utility gas
- 10.3%Electricity
- 0.9%Other fuel
- 0.8%Bottled, tank, or LP gas
Roads and streets:
Stoddard Ave
Length: 0.37 miles
Direction: N-S
Address range: 1536 to 2199
Direction: N-S
Address range: 1536 to 2199
N Summit St
Length: 0.36 miles
Direction: N-S
Address range: 1800 to 2199
Direction: N-S
Address range: 1800 to 2199
N President St
Length: 0.36 miles
Direction: N-S
Address range: 1729 to 2199
Direction: N-S
Address range: 1729 to 2199
E Geneva Rd
Length: 0.34 miles
Direction: E-W
Direction: E-W
E Thomas Rd
Length: 0.34 miles
Direction: E-W
Address range: 1000 to 1399
Direction: E-W
Address range: 1000 to 1399
Daly Rd
Length: 0.34 miles
Direction: E-W
Address range: 1001 to 1399
Direction: E-W
Address range: 1001 to 1399
Mackenzie Pl
Length: 0.11 miles
Directions: E-W, N-S, SW-NE
Directions: E-W, N-S, SW-NE
Tartan Ct
Length: 0.11 miles
Directions: E-W, SW-NE
Directions: E-W, SW-NE
Lindsay Ct
Length: 0.07 miles
Direction: E-W
Address range: 1200 to 1299
Direction: E-W
Address range: 1200 to 1299