Northshore neighborhood in Westlake Village, California (CA), 91361 detailed profile
Settings
X


Business Search - 14 Million verified businesses
Area: 0.064 square miles
Population: 183
Population density:
| Northshore: | 2,843 people per square mile |
| Westlake Village: | 1,525 people per square mile |

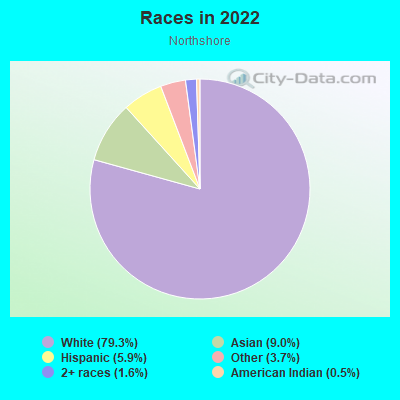
- 14979.3%White
- 179.0%Asian
- 115.9%Hispanic or Latino
- 73.7%Some other race
- 31.6%Two or more races
- 10.5%American Indian
Median household income in 2022:
| Northshore: | $141,394 |
| Westlake Village: | $188,681 |
Distribution of median household income
![Distribution of median household income]()
- 2Less than $10,000
- 8$10,000 to $19,999
- 5$20,000 to $29,999
- 8$30,000 to $39,999
- 8$40,000 to $49,999
- 12$50,000 to $59,999
- 11$60,000 to $74,999
- 18$75,000 to $99,999
- 22$100,000 to $124,999
- 19$125,000 to $149,999
- 8$150,000 to $199,999
- 6$200,000 or more

Distribution of owner-occupied house/condo value
![Distribution of owner-occupied house/condo value]()
- 2Less than $50,000
- 1$50,000 to $99,999
- 1$150,000 to $199,999
- 1$200,000 to $249,999
- 1$300,000 to $399,999
- 5$400,000 to $499,999
- 22$500,000 to $749,999
- 25$750,000 to $999,999
- 32$1,000,000 or more

Distribution of rent paid by renters
![Distribution of rent paid by renters]()
- 3$1,000 to $1,249
- 3$1,250 to $1,499
- 5$1,500 to $1,999
- 40$2,000 or more

Median rent in 2022:
| Northshore: | $2,343 |
| Westlake Village: | $2,001 |
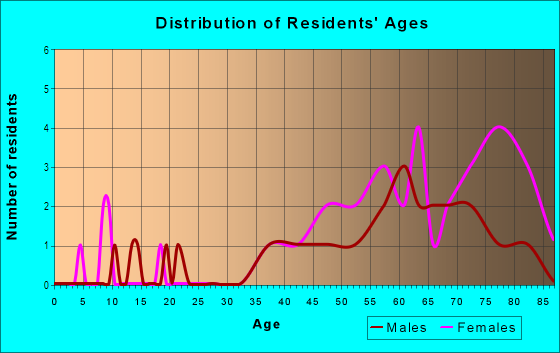
| Males: | 82 |
| Females: | 101 |
Males:
| This neighborhood: | 60.4 years |
| Whole city: | 52.2 years |
| This neighborhood: | 64.7 years |
| Whole city: | 51.1 years |
Average household size:
| Northshore: | 2.0 people |
| Westlake Village: | 2.5 people |
Percentage of family households:
| Northshore: | 12.4% |
| Westlake Village: | 40.4% |
| Here: | 21.6% |
| Westlake Village: | 60.6% |
Percentage of married-couple families with children (among all households):
| Northshore: | 24.9% |
| Westlake Village: | 33.9% |
Percentage of single-mother households (among all households):
| Northshore: | 38.7% |
| Westlake Village: | 4.3% |
Percentage of never married males 15 years old and over:
Percentage of never married females 15 years old and over:
| Northshore: | 18.7% |
| Westlake Village: | 12.6% |
Percentage of never married females 15 years old and over:
| Northshore: | 16.5% |
| city: | 10.8% |
Percentage of people that speak English not well or not at all:
| Northshore: | 0.6% |
| Westlake Village: | 1.2% |
Percentage of people born in this state:
Percentage of people born in another U.S. state:
Percentage of native residents but born outside the U.S.:
Percentage of foreign born residents:
| Here: | 54.0% |
| Westlake Village: | 51.1% |
Percentage of people born in another U.S. state:
| Northshore: | 32.1% |
| Westlake Village: | 28.0% |
Percentage of native residents but born outside the U.S.:
| Here: | 1.1% |
| city: | 4.9% |
Percentage of foreign born residents:
| Here: | 12.9% |
| Westlake Village: | 15.9% |
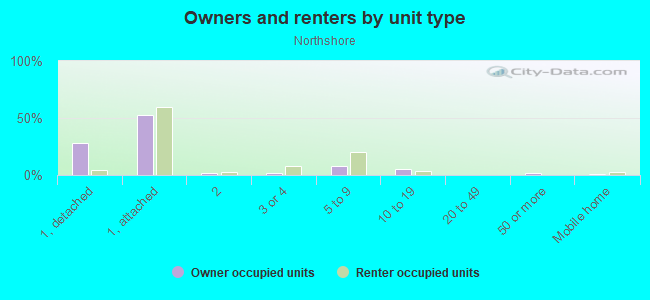
Owner-occupied
Renter-occupied

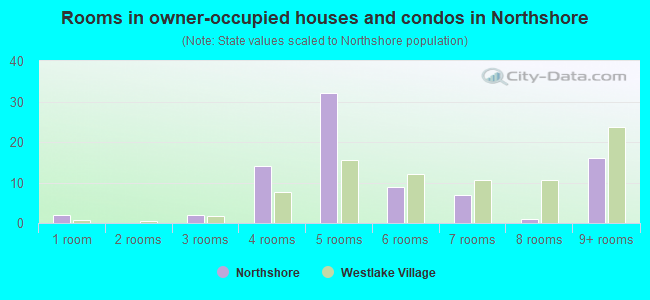
- Rooms in owner-occupied houses and condos in Northshore
- 21 room
- 02 rooms
- 23 rooms
- 144 rooms
- 325 rooms
- 96 rooms
- 77 rooms
- 18 rooms
- 169+ rooms
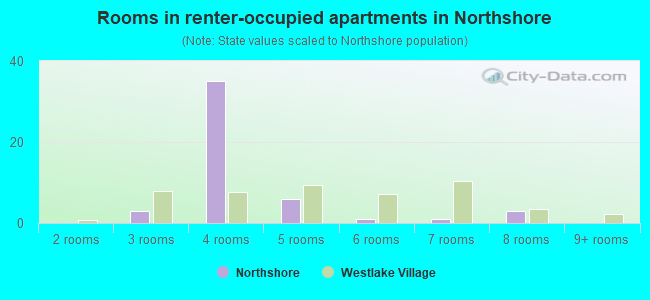
- Rooms in renter-occupied apartments in Northshore
- 01 room
- 02 rooms
- 33 rooms
- 354 rooms
- 65 rooms
- 16 rooms
- 17 rooms
- 38 rooms
- 09+ rooms
Owner-occupied
Renter-occupied
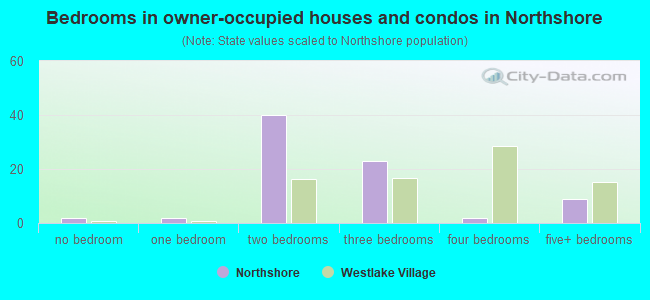
- Bedrooms in owner-occupied houses and condos in Northshore
- 2no bedroom
- 21 bedroom
- 402 bedrooms
- 233 bedrooms
- 24 bedrooms
- 95+ bedrooms
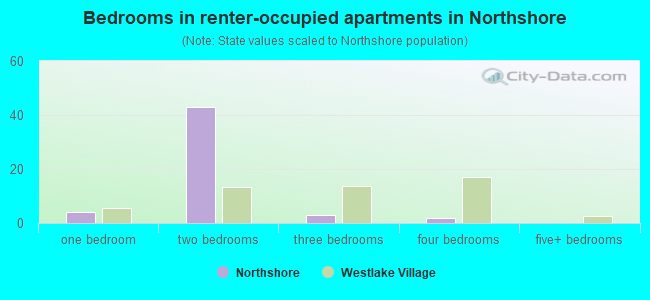
- Bedrooms in renter-occupied apartments in Northshore
- 0no bedroom
- 41 bedroom
- 432 bedrooms
- 33 bedrooms
- 24 bedrooms
- 05+ bedrooms
Average number of cars or other vehicles available in houses/condos:
Average number of cars or other vehicles available in apartments:
| This neighborhood: | 1.2 |
| Westlake Village: | 2.1 |
Average number of cars or other vehicles available in apartments:
| Here: | 1.5 |
| city: | 1.8 |
Percentage of units with a mortgage:
| Northshore: | 75.5% |
| Westlake Village: | 63.2% |
Housing prices:
- Average estimated value of detached houses in 2022 (20.3% of all units):
Northshore: $2,208,152 California: $988,808
- Average estimated value of townhouses or other attached units in 2022 (71.2% of all units):
This neighborhood: $1,414,818 California: $838,546
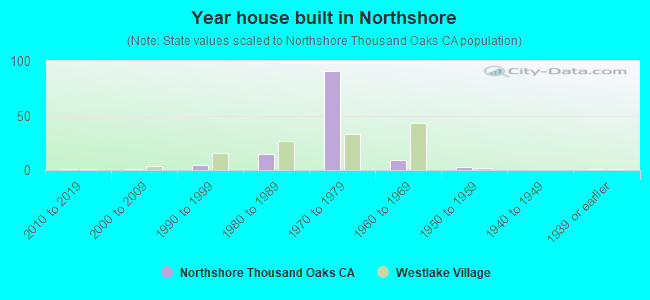
- Year house built in Northshore
- 02020 or later
- 12010 to 2019
- 12000 to 2009
- 51990 to 1999
- 151980 to 1989
- 911970 to 1979
- 91960 to 1969
- 31950 to 1959
- 01940 to 1949
- 11939 or earlier
City-data.com crime index for city in 2020 (higher means more crime):
| City: | 108.1 |
| U.S. average: | 219.5 |
Travel time to work (commute)
![Travel time to work (commute)]()
- 5Less than 5 minutes
- 135 to 9 minutes
- 1210 to 14 minutes
- 915 to 19 minutes
- 220 to 24 minutes
- 125 to 29 minutes
- 430 to 34 minutes
- 135 to 39 minutes
- 140 to 44 minutes
- 345 to 59 minutes
- 960 to 89 minutes
- 490 or more minutes

Means of transportation to work
![Means of transportation to work]()
- 71.9%74Drove a car alone
- 1.0%1Carpooled
- 1.0%1Long-distance train or commuter rail
- 1.0%1Walked
- 26.2%27Worked at home

Time leaving home to go to work
![Time leaving home to go to work]()
- 212:00 a.m. to 4:59 a.m.
- 35:00 a.m. to 5:29 a.m.
- 56:00 a.m. to 6:29 a.m.
- 56:30 a.m. to 6:59 a.m.
- 137:00 a.m. to 7:29 a.m.
- 57:30 a.m. to 7:59 a.m.
- 88:00 a.m. to 8:29 a.m.
- 28:30 a.m. to 8:59 a.m.
- 59:00 a.m. to 9:59 a.m.
- 710:00 a.m. to 10:59 a.m.
- 512:00 p.m. to 3:59 p.m.
- 34:00 p.m. to 11:59 p.m.

Occupations of males:
- Percentage of males in management occupations (except farmers):
Here: 13.0% city: 19.6%
- Percentage of males in computer and mathematical occupations:
Here: 3.7% city: 2.2%
- Percentage of males in architecture and engineering occupations:
Here: 28.8% city: 8.6%
- Percentage of males in legal occupations:
Here: 2.9% city: 2.8%
- Percentage of males in education, training, and library occupations:
Here: 2.2% city: 0.8%
- Percentage of males in arts, design, entertainment, sports, and media occupations:
Here: 6.1% city: 12.8%
- Percentage of males in healthcare practitioners and technical occupations:
Here: 2.4% city: 5.0%
- Percentage of males in service occupations:
Here: 3.3% city: 2.6%
- Percentage of males in sales and office occupations:
Here: 15.6% city: 17.9%
- Percentage of males in construction, extraction, and maintenance occupations:
Here: 2.2% city: 8.7%
- Percentage of males in production occupations:
Here: 9.0% city: 2.3%
- Percentage of males in transportation occupations:
Here: 4.0% city: 2.0%
Occupations of females:
- Percentage of females in management occupations (except farmers):
Here: 4.1% city: 12.7%
- Percentage of females in business and financial operations occupations:
Here: 22.0% city: 11.4%
- Percentage of females in legal occupations:
Here: 2.4% city: 2.7%
- Percentage of females in education, training, and library occupations:
Here: 15.7% city: 11.1%
- Percentage of females in arts, design, entertainment, sports, and media occupations:
Here: 4.0% city: 7.7%
- Percentage of females in service occupations:
Here: 13.5% city: 5.9%
- Percentage of females in sales and office occupations:
Here: 38.1% city: 29.4%
- Percentage of females in transportation occupations:
Here: 1.3% city: 0.0%
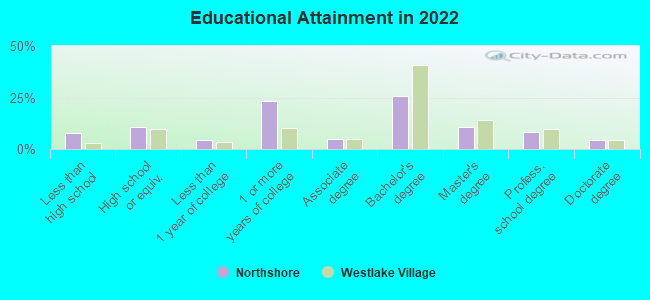
Education in this neighborhood (subdivision or community):
- Percentage of people 3 years and older in K-12 schools:
Northshore: 6.0% Westlake Village: 15.8%
- Percentage of people 3 years and older in undergraduate colleges:
Northshore: 1.6% Westlake Village: 4.7%
- Percentage of people 3 years and older in grad. or professional schools:
Northshore: 1.6% Westlake Village: 1.7%
- Percentage of students K-12 enrolled in private schools:
Northshore: 90.9% Westlake Village: 20.7%
Percentage of population below poverty level:
| Northshore: | 8.5% |
| Westlake Village: | 5.0% |
Median year owner moved in (as recorded in 2022):
Median year renter moved in (as recorded in 2022):
| Northshore: | 2006 |
| Westlake Village: | 2004 |
Median year renter moved in (as recorded in 2022):
| Northshore: | 2015 |
| Westlake Village: | 2016 |
Percentage of married-couple families with both working:
| Northshore: | 314.1% |
| Westlake Village: | 63.0% |
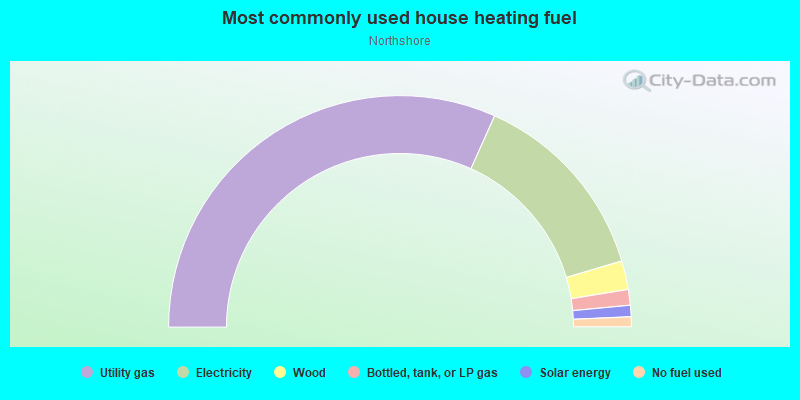
- 63.5%Utility gas
- 27.4%Electricity
- 4.0%Wood
- 2.2%Bottled, tank, or LP gas
- 1.6%Solar energy
- 1.4%No fuel used
Roads and streets:
Northlake Cir
Length: 0.45 miles
Directions: E-W, N-S, SE-NW, SW-NE
Directions: E-W, N-S, SE-NW, SW-NE
Lakewood Pl
Length: 0.34 miles
Directions: E-W, SE-NW, SW-NE
Address range: 2600 to 2799
Directions: E-W, SE-NW, SW-NE
Address range: 2600 to 2799
Lakeridge Ln
Length: 0.32 miles
Directions: E-W, N-S, SE-NW, SW-NE
Address range: 2700 to 2899
Directions: E-W, N-S, SE-NW, SW-NE
Address range: 2700 to 2899
Northshore Ln
Length: 0.21 miles
Directions: E-W, SE-NW
Address range: 2500 to 2699
Directions: E-W, SE-NW
Address range: 2500 to 2699
Watergate Rd
Length: 0.16 miles
Directions: E-W, SE-NW
Address range: 2700 to 2799
Directions: E-W, SE-NW
Address range: 2700 to 2799
Shoreview Cir
Length: 0.14 miles
Directions: E-W, N-S, SE-NW, SW-NE
Address range: 2801 to 2898
Directions: E-W, N-S, SE-NW, SW-NE
Address range: 2801 to 2898
Lakewood Ct
Length: 0.03 miles
Direction: SW-NE
Address range: 1300 to 1399
Direction: SW-NE
Address range: 1300 to 1399