Office Core District neighborhood in Las Vegas, Nevada (NV), 89101, 89102, 89104, 89106 detailed profile
Settings
X

Business Search - 14 Million verified businesses
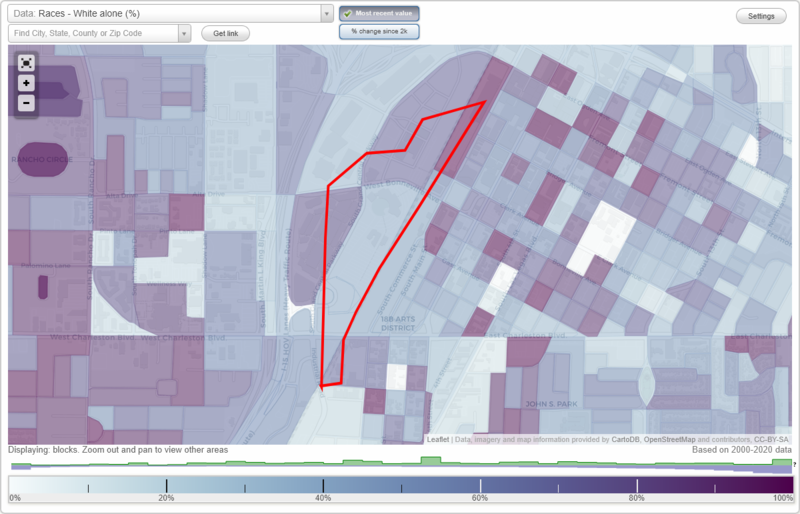
Area: 0.406 square miles
Population: 1,314
Population density:
| Office Core District: | 3,240 people per square mile |
| Las Vegas: | 5,792 people per square mile |

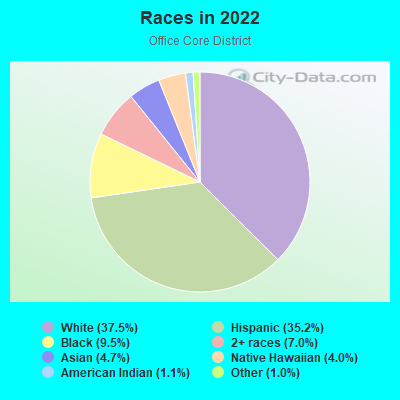
- 50937.5%White
- 47835.2%Hispanic or Latino
- 1299.5%Black
- 957.0%Two or more races
- 644.7%Asian
- 554.0%Native Hawaiian and Other
Pacific Islander - 151.1%American Indian
- 141.0%Some other race
Median household income in 2022:
| Office Core District: | $47,001 |
| Las Vegas: | $68,905 |
Distribution of median household income
![Distribution of median household income]()
- 70Less than $10,000
- 180$10,000 to $19,999
- 94$20,000 to $29,999
- 159$30,000 to $39,999
- 106$40,000 to $49,999
- 80$50,000 to $59,999
- 99$60,000 to $74,999
- 99$75,000 to $99,999
- 102$100,000 to $124,999
- 28$125,000 to $149,999
- 17$150,000 to $199,999
- 80$200,000 or more

Distribution of owner-occupied house/condo value
![Distribution of owner-occupied house/condo value]()
- 22Less than $50,000
- 30$50,000 to $99,999
- 9$100,000 to $149,999
- 48$150,000 to $199,999
- 106$200,000 to $249,999
- 59$250,000 to $299,999
- 198$300,000 to $399,999
- 65$400,000 to $499,999
- 48$500,000 to $749,999
- 27$1,000,000 or more

Distribution of rent paid by renters
![Distribution of rent paid by renters]()
- 29Less than $100
- 99$100 to $199
- 11$200 to $299
- 118$300 to $399
- 50$400 to $499
- 89$500 to $599
- 156$600 to $699
- 176$700 to $799
- 94$800 to $899
- 77$900 to $999
- 86$1,000 to $1,249
- 119$1,250 to $1,499
- 169$1,500 to $1,999
- 16$2,000 or more

Median rent in 2022:
| Office Core District: | $1,025 |
| Las Vegas: | $1,277 |
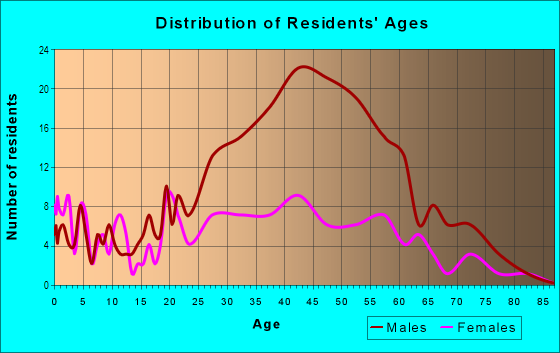
| Males: | 701 |
| Females: | 612 |
Males:
| This neighborhood: | 37.8 years |
| Whole city: | 38.4 years |
| This neighborhood: | 40.8 years |
| Whole city: | 38.9 years |
Average household size:
| Office Core District: | 2.3 people |
| Las Vegas: | 2.7 people |
Percentage of family households:
| Office Core District: | 24.1% |
| Las Vegas: | 45.8% |
| Here: | 18.3% |
| Las Vegas: | 40.9% |
Percentage of married-couple families with children (among all households):
| Office Core District: | 19.5% |
| Las Vegas: | 23.4% |
Percentage of single-mother households (among all households):
| Office Core District: | 30.2% |
| Las Vegas: | 10.1% |
Percentage of never married males 15 years old and over:
Percentage of never married females 15 years old and over:
| Office Core District: | 26.2% |
| Las Vegas: | 19.7% |
Percentage of never married females 15 years old and over:
| Office Core District: | 19.5% |
| city: | 17.0% |
Percentage of people that speak English not well or not at all:
| Office Core District: | 10.8% |
| Las Vegas: | 7.0% |
Percentage of people born in this state:
Percentage of people born in another U.S. state:
Percentage of native residents but born outside the U.S.:
Percentage of foreign born residents:
| Here: | 19.8% |
| Las Vegas: | 27.3% |
Percentage of people born in another U.S. state:
| Office Core District: | 42.8% |
| Las Vegas: | 49.8% |
Percentage of native residents but born outside the U.S.:
| Here: | 3.7% |
| city: | 1.9% |
Percentage of foreign born residents:
| Here: | 33.7% |
| Las Vegas: | 21.0% |
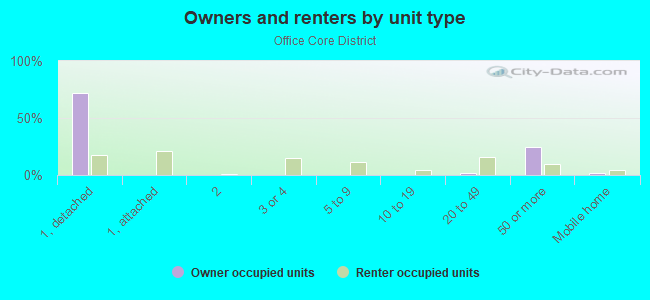
Owner-occupied
Renter-occupied

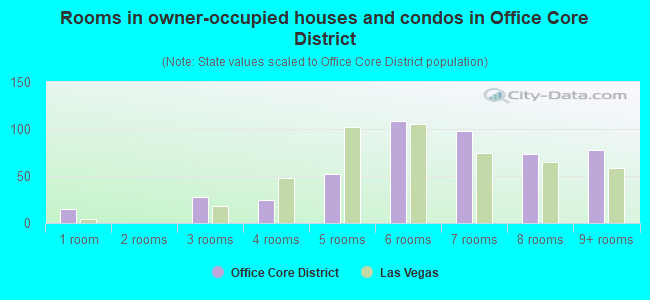
- Rooms in owner-occupied houses and condos in Office Core District
- 151 room
- 02 rooms
- 283 rooms
- 244 rooms
- 525 rooms
- 1086 rooms
- 987 rooms
- 738 rooms
- 789+ rooms
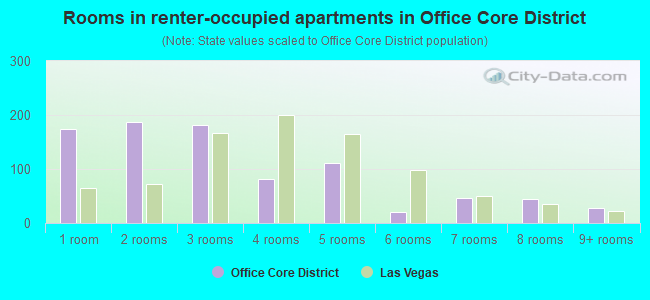
- Rooms in renter-occupied apartments in Office Core District
- 1751 room
- 1872 rooms
- 1813 rooms
- 814 rooms
- 1115 rooms
- 206 rooms
- 477 rooms
- 448 rooms
- 279+ rooms
Owner-occupied
Renter-occupied
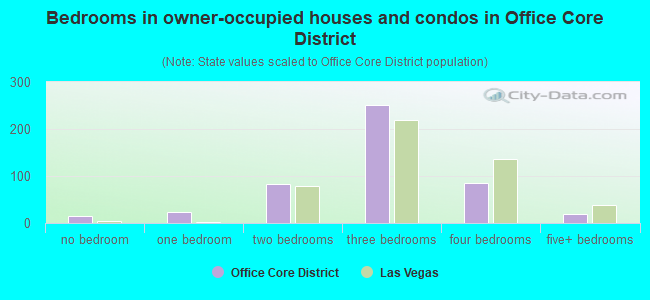
- Bedrooms in owner-occupied houses and condos in Office Core District
- 15no bedroom
- 241 bedroom
- 842 bedrooms
- 2523 bedrooms
- 854 bedrooms
- 205+ bedrooms
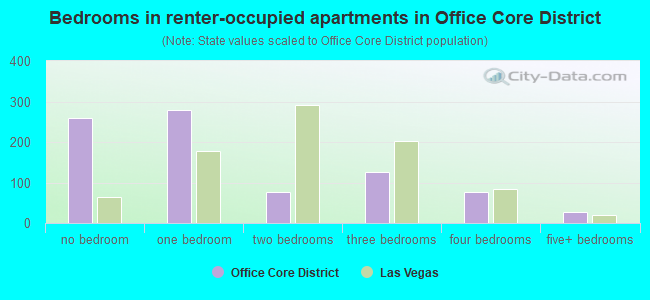
- Bedrooms in renter-occupied apartments in Office Core District
- 259no bedroom
- 2791 bedroom
- 762 bedrooms
- 1273 bedrooms
- 764 bedrooms
- 275+ bedrooms
Average number of cars or other vehicles available in houses/condos:
Average number of cars or other vehicles available in apartments:
| This neighborhood: | |
| Las Vegas: |
Average number of cars or other vehicles available in apartments:
| Here: | 0.8 |
| city: | 1.3 |
Percentage of units with a mortgage:
| Office Core District: | 54.6% |
| Las Vegas: | 69.3% |
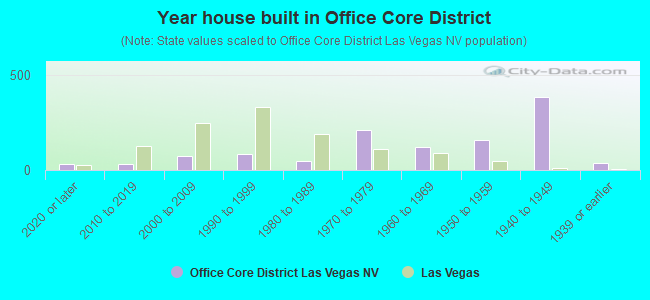
- Year house built in Office Core District
- 332020 or later
- 312010 to 2019
- 762000 to 2009
- 831990 to 1999
- 491980 to 1989
- 2131970 to 1979
- 1201960 to 1969
- 1561950 to 1959
- 3831940 to 1949
- 381939 or earlier
City-data.com crime index for city in 2020 (higher means more crime):
| City: | 280.7 |
| U.S. average: | 219.5 |
Travel time to work (commute)
![Travel time to work (commute)]()
- 25Less than 5 minutes
- 1185 to 9 minutes
- 12110 to 14 minutes
- 14315 to 19 minutes
- 20820 to 24 minutes
- 4925 to 29 minutes
- 8030 to 34 minutes
- 1235 to 39 minutes
- 1940 to 44 minutes
- 4345 to 59 minutes
- 3260 to 89 minutes
- 2190 or more minutes

Means of transportation to work
![Means of transportation to work]()
- 52.4%399Drove a car alone
- 10.1%77Carpooled
- 9.6%73Bus
- 2.4%18Subway or elevated rail
- 0.3%2Ferryboat
- 3.4%26Motorcycle
- 6.7%51Bicycle
- 12.9%98Walked
- 8.7%66Other means
- 25.2%192Worked at home

Time leaving home to go to work
![Time leaving home to go to work]()
- 7812:00 a.m. to 4:59 a.m.
- 545:00 a.m. to 5:29 a.m.
- 245:30 a.m. to 5:59 a.m.
- 596:00 a.m. to 6:29 a.m.
- 406:30 a.m. to 6:59 a.m.
- 817:00 a.m. to 7:29 a.m.
- 397:30 a.m. to 7:59 a.m.
- 1068:00 a.m. to 8:29 a.m.
- 708:30 a.m. to 8:59 a.m.
- 639:00 a.m. to 9:59 a.m.
- 5410:00 a.m. to 10:59 a.m.
- 511:00 a.m. to 11:59 a.m.
- 15412:00 p.m. to 3:59 p.m.
- 994:00 p.m. to 11:59 p.m.

Occupations of males:
- Percentage of males in management occupations (except farmers):
Here: 16.6% city: 9.6%
- Percentage of males in business and financial operations occupations:
Here: 3.6% city: 3.6%
- Percentage of males in architecture and engineering occupations:
Here: 6.7% city: 1.8%
- Percentage of males in life, physical, and social science occupations:
Here: 1.0% city: 0.3%
- Percentage of males in legal occupations:
Here: 1.1% city: 0.9%
- Percentage of males in education, training, and library occupations:
Here: 7.7% city: 2.5%
- Percentage of males in arts, design, entertainment, sports, and media occupations:
Here: 4.9% city: 2.5%
- Percentage of males in service occupations:
Here: 32.5% city: 23.3%
- Percentage of males in sales and office occupations:
Here: 15.7% city: 16.6%
- Percentage of males in construction, extraction, and maintenance occupations:
Here: 2.2% city: 10.6%
- Percentage of males in production occupations:
Here: 1.2% city: 3.3%
- Percentage of males in transportation occupations:
Here: 1.5% city: 6.6%
- Percentage of males in material moving occupations:
Here: 2.4% city: 5.4%
Occupations of females:
- Percentage of females in management occupations (except farmers):
Here: 5.2% city: 8.5%
- Percentage of females in business and financial operations occupations:
Here: 1.9% city: 5.7%
- Percentage of females in computer and mathematical occupations:
Here: 1.1% city: 1.1%
- Percentage of females in education, training, and library occupations:
Here: 7.9% city: 8.0%
- Percentage of females in arts, design, entertainment, sports, and media occupations:
Here: 5.5% city: 1.8%
- Percentage of females in healthcare practitioners and technical occupations:
Here: 2.7% city: 7.4%
- Percentage of females in service occupations:
Here: 28.6% city: 26.5%
- Percentage of females in sales and office occupations:
Here: 45.4% city: 30.5%
- Percentage of females in production occupations:
Here: 1.8% city: 1.8%
- Percentage of females in material moving occupations:
Here: 1.4% city: 2.2%
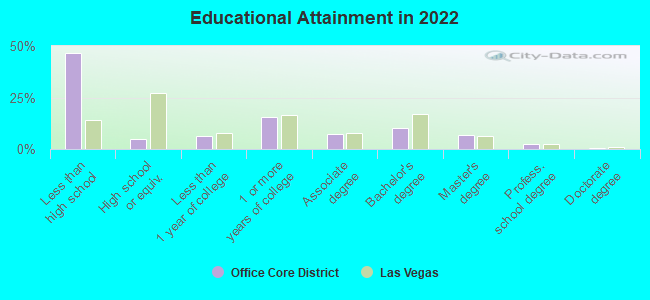
Education in this neighborhood (subdivision or community):
- Percentage of people 3 years and older in K-12 schools:
Office Core District: 35.7% Las Vegas: 17.4%
- Percentage of people 3 years and older in undergraduate colleges:
Office Core District: 7.9% Las Vegas: 4.2%
- Percentage of people 3 years and older in grad. or professional schools:
Office Core District: 4.5% Las Vegas: 1.0%
- Percentage of students K-12 enrolled in private schools:
Office Core District: 11.0% Las Vegas: 12.9%
Percentage of population below poverty level:
| Office Core District: | 26.1% |
| Las Vegas: | 14.1% |
Median year renter moved in (as recorded in 2022):
| Office Core District: | 2017 |
| Las Vegas: | 2020 |
Percentage of married-couple families with both working:
| Office Core District: | 71.2% |
| Las Vegas: | 62.0% |
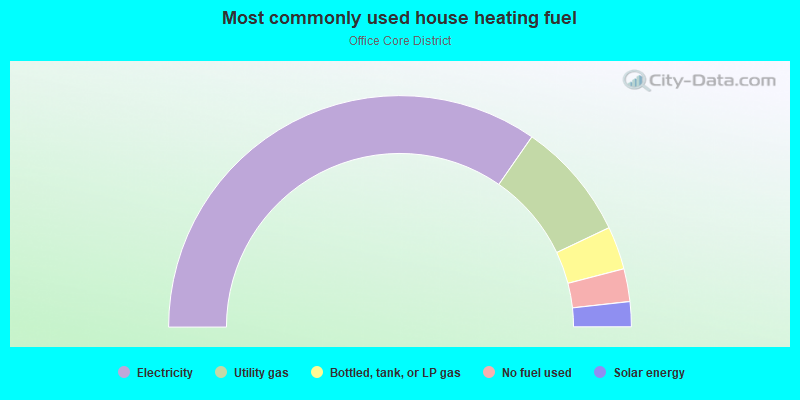
- 69.4%Electricity
- 16.6%Utility gas
- 6.0%Bottled, tank, or LP gas
- 4.6%No fuel used
- 3.5%Solar energy
Highways in this neighborhood:
State Rte 604 (Las Vegas Blvd S)
Length: 0.57 miles
Direction: SW-NE
Address range: 700 to 1338
Direction: SW-NE
Address range: 700 to 1338
Roads and streets:
S Main St
Length: 0.73 miles
Directions: N-S, SW-NE
Address range: 700 to 1299
Directions: N-S, SW-NE
Address range: 700 to 1299
S Commerce St
Length: 0.70 miles
Directions: E-W, N-S, SE-NW, SW-NE
Address range: 700 to 1333
Directions: E-W, N-S, SE-NW, SW-NE
Address range: 700 to 1333
E Charleston Blvd
Length: 0.62 miles
Direction: E-W
Address range: 1 to 699
Direction: E-W
Address range: 1 to 699
S Casino Center Blvd
Length: 0.62 miles
Directions: N-S, SW-NE
Address range: 700 to 1299
Directions: N-S, SW-NE
Address range: 700 to 1299
Garces Ave
Length: 0.60 miles
Directions: E-W, SE-NW
Address range: 1 to 699
Directions: E-W, SE-NW
Address range: 1 to 699
Gass Ave
Length: 0.57 miles
Directions: E-W, SE-NW
Address range: 1 to 699
Directions: E-W, SE-NW
Address range: 1 to 699
Hoover Ave
Length: 0.56 miles
Directions: E-W, SE-NW
Address range: 1 to 699
Directions: E-W, SE-NW
Address range: 1 to 699
S 4th St
Length: 0.56 miles
Direction: SW-NE
Address range: 700 to 1499
Direction: SW-NE
Address range: 700 to 1499
S 3rd St
Length: 0.56 miles
Directions: N-S, SW-NE
Address range: 700 to 1299
Directions: N-S, SW-NE
Address range: 700 to 1299
S 1st St
Length: 0.38 miles
Direction: SW-NE
Address range: 700 to 1099
Direction: SW-NE
Address range: 700 to 1099
S 6th St
Length: 0.37 miles
Directions: N-S, SW-NE
Address range: 700 to 1199
Directions: N-S, SW-NE
Address range: 700 to 1199
Coolidge Ave
Length: 0.30 miles
Directions: E-W, SE-NW
Address range: 1 to 399
Directions: E-W, SE-NW
Address range: 1 to 399
Park Paseo
Length: 0.26 miles
Direction: E-W
Address range: 500 to 699
Direction: E-W
Address range: 500 to 699
E Colorado Ave
Length: 0.21 miles
Direction: E-W
Address range: 1 to 299
Direction: E-W
Address range: 1 to 299
S 7th St
Length: 0.20 miles
Direction: SW-NE
Address range: 700 to 899
Direction: SW-NE
Address range: 700 to 899
E California Ave
Length: 0.18 miles
Direction: E-W
Address range: 1 to 299
Direction: E-W
Address range: 1 to 299
Boulder Ave
Length: 0.12 miles
Direction: SE-NW
Address range: 1 to 199
Direction: SE-NW
Address range: 1 to 199
W Colorado Ave
Length: 0.09 miles
Direction: E-W
Address range: 1 to 99
Direction: E-W
Address range: 1 to 99
W California Ave
Length: 0.09 miles
Direction: E-W
Address range: 1 to 99
Direction: E-W
Address range: 1 to 99
W Charleston Blvd
Length: 0.09 miles
Direction: E-W
Address range: 1 to 99
Direction: E-W
Address range: 1 to 99
3rd Pl
Length: 0.04 miles
Direction: N-S
Address range: 1100 to 1199
Direction: N-S
Address range: 1100 to 1199