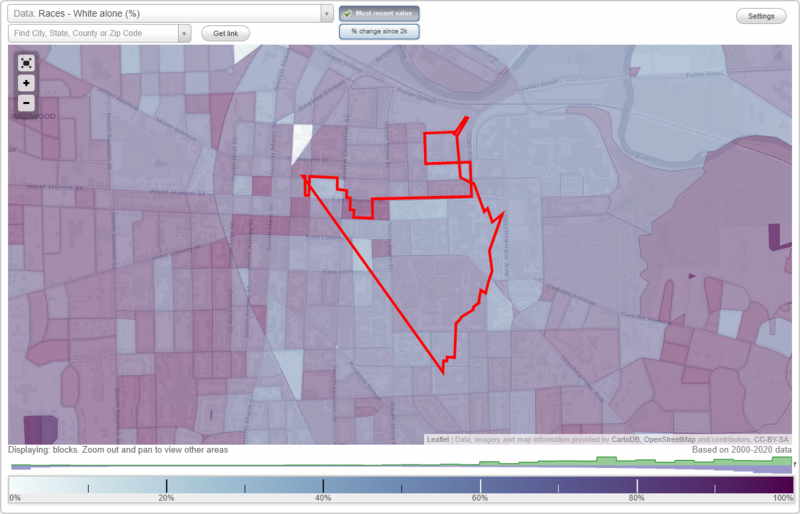
Old Fourth Ward neighborhood in Ann Arbor, Michigan (MI), 48104 detailed profile
Settings
X

Business Search - 14 Million verified businesses
Area: 0.146 square miles
Population: 3,440
Population density:
| Old Fourth Ward: | 23,505 people per square mile |
| Ann Arbor: | 4,438 people per square mile |

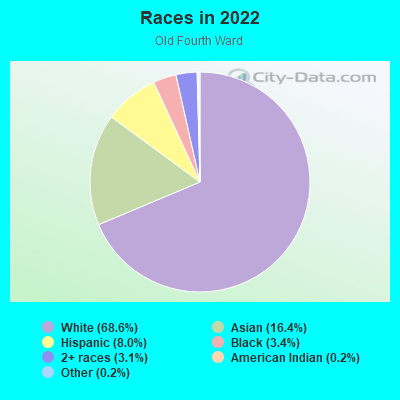
- 2,41568.6%White
- 57816.4%Asian
- 2838.0%Hispanic or Latino
- 1203.4%Black
- 1083.1%Two or more races
- 80.2%American Indian
- 70.2%Some other race
Distribution of median household income
![Distribution of median household income]()
- 466Less than $10,000
- 242$10,000 to $19,999
- 91$20,000 to $29,999
- 134$30,000 to $39,999
- 45$40,000 to $49,999
- 124$50,000 to $59,999
- 144$60,000 to $74,999
- 245$75,000 to $99,999
- 28$100,000 to $124,999
- 21$125,000 to $149,999
- 50$150,000 to $199,999
- 53$200,000 or more

Distribution of owner-occupied house/condo value
![Distribution of owner-occupied house/condo value]()
- 30$150,000 to $199,999
- 12$200,000 to $249,999
- 13$250,000 to $299,999
- 37$300,000 to $399,999
- 13$400,000 to $499,999
- 32$500,000 to $749,999
- 17$750,000 to $999,999
- 43$1,000,000 or more

Distribution of rent paid by renters
![Distribution of rent paid by renters]()
- 11$100 to $199
- 14$200 to $299
- 113$300 to $399
- 16$400 to $499
- 48$500 to $599
- 184$600 to $699
- 110$700 to $799
- 63$800 to $899
- 71$900 to $999
- 238$1,000 to $1,249
- 183$1,250 to $1,499
- 307$1,500 to $1,999
- 350$2,000 or more

Median rent in 2022:
| Old Fourth Ward: | $1,499 |
| Ann Arbor: | $1,381 |
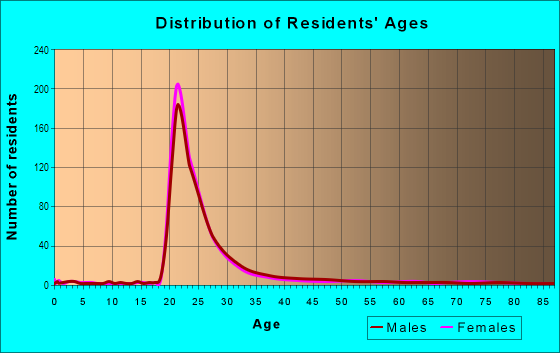
| Males: | 1,919 |
| Females: | 1,520 |
Males:
| This neighborhood: | 23.5 years |
| Whole city: | 25.8 years |
| This neighborhood: | 22.1 years |
| Whole city: | 26.4 years |
Average household size:
| Old Fourth Ward: | 2.3 people |
| Ann Arbor: | 2.2 people |
Percentage of family households:
| Old Fourth Ward: | 1.3% |
| Ann Arbor: | 30.6% |
| Here: | 2.2% |
| Ann Arbor: | 33.8% |
Percentage of married-couple families with children (among all households):
| Old Fourth Ward: | 41.4% |
| Ann Arbor: | 33.4% |
Percentage of single-mother households (among all households):
| Old Fourth Ward: | 0.0% |
| Ann Arbor: | 5.6% |
Percentage of never married males 15 years old and over:
Percentage of never married females 15 years old and over:
| Old Fourth Ward: | 52.8% |
| Ann Arbor: | 30.5% |
Percentage of never married females 15 years old and over:
| Old Fourth Ward: | 41.2% |
| city: | 27.5% |
Percentage of people that speak English not well or not at all:
| Old Fourth Ward: | 0.0% |
| Ann Arbor: | 1.5% |
Percentage of people born in this state:
Percentage of people born in another U.S. state:
Percentage of native residents but born outside the U.S.:
Percentage of foreign born residents:
| Here: | 39.5% |
| Ann Arbor: | 45.8% |
Percentage of people born in another U.S. state:
| Old Fourth Ward: | 45.4% |
| Ann Arbor: | 34.9% |
Percentage of native residents but born outside the U.S.:
| Here: | 1.8% |
| city: | 1.6% |
Percentage of foreign born residents:
| Here: | 13.4% |
| Ann Arbor: | 17.7% |
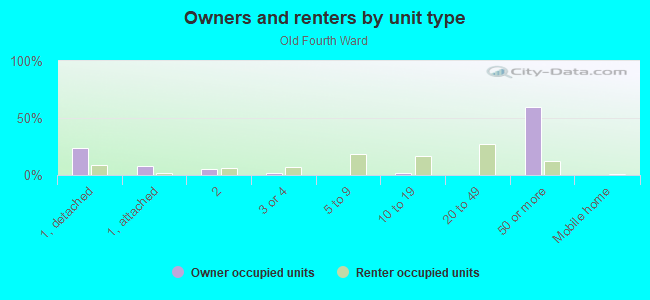
Owner-occupied
Renter-occupied

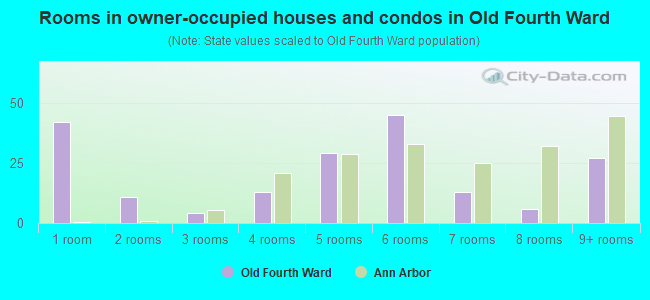
- Rooms in owner-occupied houses and condos in Old Fourth Ward
- 421 room
- 112 rooms
- 43 rooms
- 134 rooms
- 295 rooms
- 456 rooms
- 137 rooms
- 68 rooms
- 279+ rooms
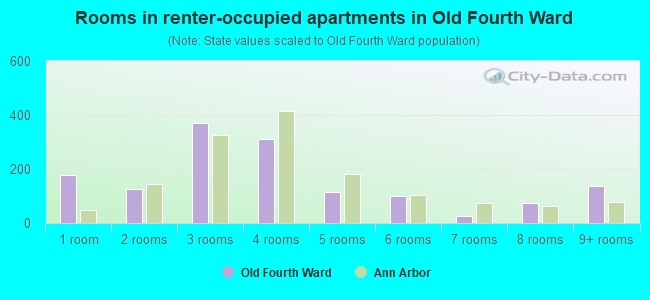
- Rooms in renter-occupied apartments in Old Fourth Ward
- 1781 room
- 1252 rooms
- 3723 rooms
- 3104 rooms
- 1145 rooms
- 1006 rooms
- 277 rooms
- 738 rooms
- 1369+ rooms
Owner-occupied
Renter-occupied
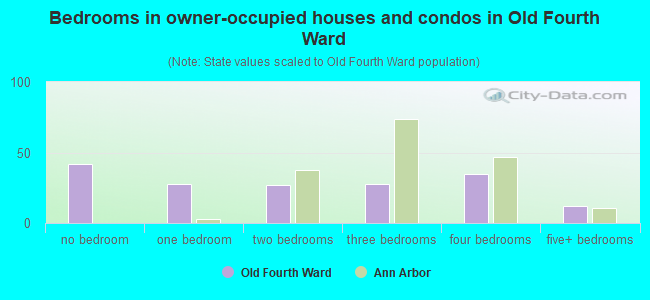
- Bedrooms in owner-occupied houses and condos in Old Fourth Ward
- 42no bedroom
- 281 bedroom
- 272 bedrooms
- 283 bedrooms
- 354 bedrooms
- 125+ bedrooms
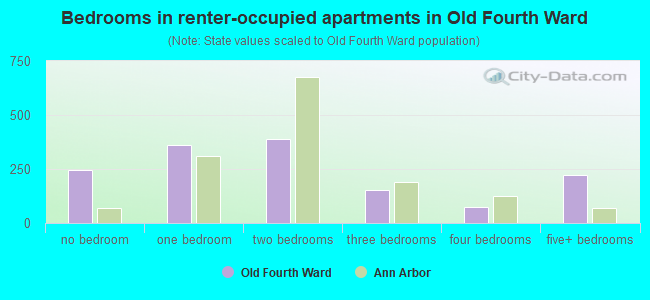
- Bedrooms in renter-occupied apartments in Old Fourth Ward
- 244no bedroom
- 3611 bedroom
- 3892 bedrooms
- 1553 bedrooms
- 764 bedrooms
- 2225+ bedrooms
Average number of cars or other vehicles available in houses/condos:
Average number of cars or other vehicles available in apartments:
| This neighborhood: | |
| Ann Arbor: |
Average number of cars or other vehicles available in apartments:
| Here: | 0.6 |
| city: | 1.3 |
Percentage of units with a mortgage:
| Old Fourth Ward: | 53.4% |
| Ann Arbor: | 62.6% |
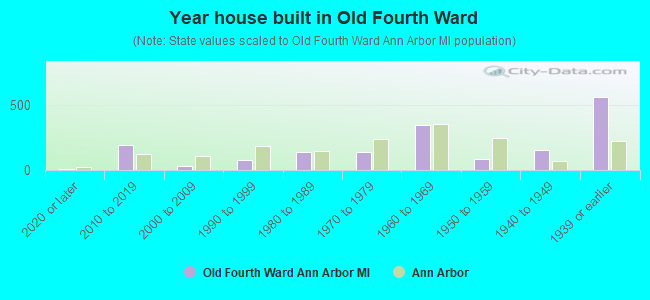
- Year house built in Old Fourth Ward
- 42020 or later
- 1942010 to 2019
- 292000 to 2009
- 741990 to 1999
- 1361980 to 1989
- 1381970 to 1979
- 3471960 to 1969
- 851950 to 1959
- 1571940 to 1949
- 5611939 or earlier
City-data.com crime index for city in 2020 (higher means more crime):
| City: | 137.0 |
| U.S. average: | 219.5 |
Travel time to work (commute)
![Travel time to work (commute)]()
- 10Less than 5 minutes
- 1325 to 9 minutes
- 23710 to 14 minutes
- 25315 to 19 minutes
- 14920 to 24 minutes
- 3225 to 29 minutes
- 16730 to 34 minutes
- 1135 to 39 minutes
- 340 to 44 minutes
- 4945 to 59 minutes
- 1960 to 89 minutes
- 3690 or more minutes

Means of transportation to work
![Means of transportation to work]()
- 23.4%367Drove a car alone
- 1.6%25Carpooled
- 6.7%105Bus
- 0.9%14Taxi
- 5.6%87Bicycle
- 47.1%737Walked
- 15.7%246Worked at home

Time leaving home to go to work
![Time leaving home to go to work]()
- 2412:00 a.m. to 4:59 a.m.
- 265:00 a.m. to 5:29 a.m.
- 185:30 a.m. to 5:59 a.m.
- 166:00 a.m. to 6:29 a.m.
- 256:30 a.m. to 6:59 a.m.
- 367:00 a.m. to 7:29 a.m.
- 747:30 a.m. to 7:59 a.m.
- 868:00 a.m. to 8:29 a.m.
- 1618:30 a.m. to 8:59 a.m.
- 1419:00 a.m. to 9:59 a.m.
- 25910:00 a.m. to 10:59 a.m.
- 1111:00 a.m. to 11:59 a.m.
- 8412:00 p.m. to 3:59 p.m.
- 774:00 p.m. to 11:59 p.m.

Occupations of males:
- Percentage of males in management occupations (except farmers):
Here: 11.2% city: 10.3%
- Percentage of males in computer and mathematical occupations:
Here: 6.2% city: 9.0%
- Percentage of males in life, physical, and social science occupations:
Here: 11.4% city: 5.8%
- Percentage of males in legal occupations:
Here: 4.0% city: 2.2%
- Percentage of males in education, training, and library occupations:
Here: 26.8% city: 19.2%
- Percentage of males in arts, design, entertainment, sports, and media occupations:
Here: 2.4% city: 2.4%
- Percentage of males in healthcare practitioners and technical occupations:
Here: 7.9% city: 6.9%
- Percentage of males in service occupations:
Here: 6.6% city: 8.2%
- Percentage of males in sales and office occupations:
Here: 2.8% city: 10.4%
- Percentage of males in production occupations:
Here: 10.2% city: 4.6%
- Percentage of males in material moving occupations:
Here: 5.1% city: 1.5%
Occupations of females:
- Percentage of females in management occupations (except farmers):
Here: 7.2% city: 8.5%
- Percentage of females in business and financial operations occupations:
Here: 7.2% city: 5.3%
- Percentage of females in computer and mathematical occupations:
Here: 3.3% city: 3.2%
- Percentage of females in architecture and engineering occupations:
Here: 3.8% city: 1.7%
- Percentage of females in life, physical, and social science occupations:
Here: 2.3% city: 4.8%
- Percentage of females in legal occupations:
Here: 1.2% city: 0.7%
- Percentage of females in education, training, and library occupations:
Here: 35.1% city: 20.2%
- Percentage of females in arts, design, entertainment, sports, and media occupations:
Here: 1.6% city: 4.6%
- Percentage of females in healthcare practitioners and technical occupations:
Here: 5.2% city: 11.9%
- Percentage of females in service occupations:
Here: 20.1% city: 15.5%
- Percentage of females in sales and office occupations:
Here: 9.3% city: 17.0%
- Percentage of females in material moving occupations:
Here: 2.9% city: 1.0%
Percentage of people 16-64 in Armed Forces:
| Old Fourth Ward: | 0.7% |
| Ann Arbor: | 0.2% |
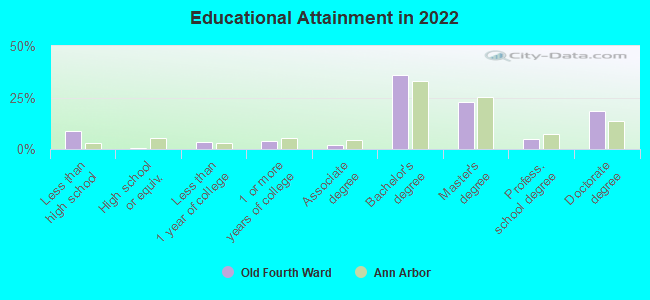
Education in this neighborhood (subdivision or community):
- Percentage of people 3 years and older in K-12 schools:
Old Fourth Ward: 1.9% Ann Arbor: 8.7%
- Percentage of people 3 years and older in undergraduate colleges:
Old Fourth Ward: 63.3% Ann Arbor: 25.6%
- Percentage of people 3 years and older in grad. or professional schools:
Old Fourth Ward: 19.9% Ann Arbor: 10.8%
- Percentage of students K-12 enrolled in private schools:
Old Fourth Ward: 12.3% Ann Arbor: 12.9%
Percentage of population below poverty level:
| Old Fourth Ward: | 63.9% |
| Ann Arbor: | 23.1% |
Median year renter moved in (as recorded in 2022):
| Old Fourth Ward: | 2020 |
| Ann Arbor: | 2022 |
Percentage of married-couple families with both working:
| Old Fourth Ward: | 226.9% |
| Ann Arbor: | 72.2% |
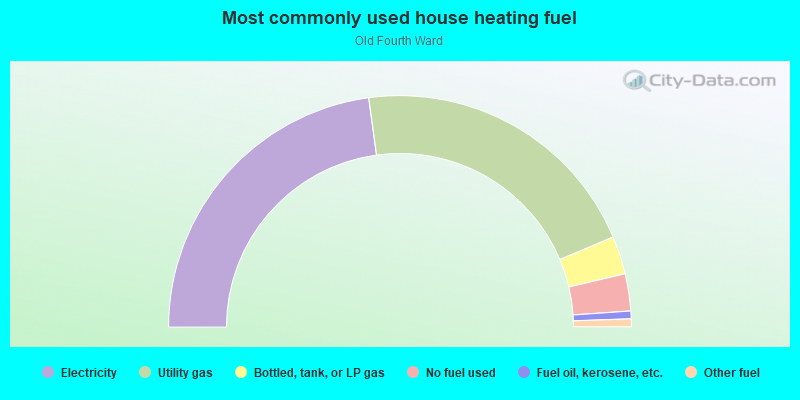
- 45.7%Electricity
- 41.6%Utility gas
- 5.3%Bottled, tank, or LP gas
- 5.2%No fuel used
- 1.1%Fuel oil, kerosene, etc.
- 1.1%Other fuel
Roads and streets:
E Ann St
Length: 0.72 miles
Direction: E-W
Address range: 300 to 1099
Direction: E-W
Address range: 300 to 1099
E Kingsley St
Length: 0.37 miles
Direction: E-W
Address range: 318 to 799
Direction: E-W
Address range: 318 to 799
Catherine St
Length: 0.36 miles
Direction: E-W
Address range: 416 to 899
Direction: E-W
Address range: 416 to 899
Lawrence St
Length: 0.35 miles
Direction: E-W
Address range: 400 to 899
Direction: E-W
Address range: 400 to 899
N State St
Length: 0.32 miles
Direction: N-S
Address range: 200 to 599
Direction: N-S
Address range: 200 to 599
N Division St
Length: 0.30 miles
Direction: N-S
Address range: 200 to 599
Direction: N-S
Address range: 200 to 599
High St
Length: 0.20 miles
Direction: E-W
Address range: 400 to 699
Direction: E-W
Address range: 400 to 699
N Thayer St
Length: 0.19 miles
Direction: N-S
Address range: 200 to 499
Direction: N-S
Address range: 200 to 499
Detroit St
Length: 0.18 miles
Direction: SW-NE
Address range: 500 to 699
Direction: SW-NE
Address range: 500 to 699
Elizabeth St
Length: 0.13 miles
Direction: N-S
Address range: 500 to 599
Direction: N-S
Address range: 500 to 599
Cornwell Pl
Length: 0.13 miles
Direction: E-W
Address range: 900 to 1099
Direction: E-W
Address range: 900 to 1099
N Ingalls St
Length: 0.10 miles
Direction: N-S
Address range: 200 to 430
Direction: N-S
Address range: 200 to 430
Carey St
Length: 0.05 miles
Direction: E-W
Address range: 232 to 399
Direction: E-W
Address range: 232 to 399