Osceola Park neighborhood in Quincy, Florida (FL), 32351 detailed profile
Settings
X

Business Search - 14 Million verified businesses
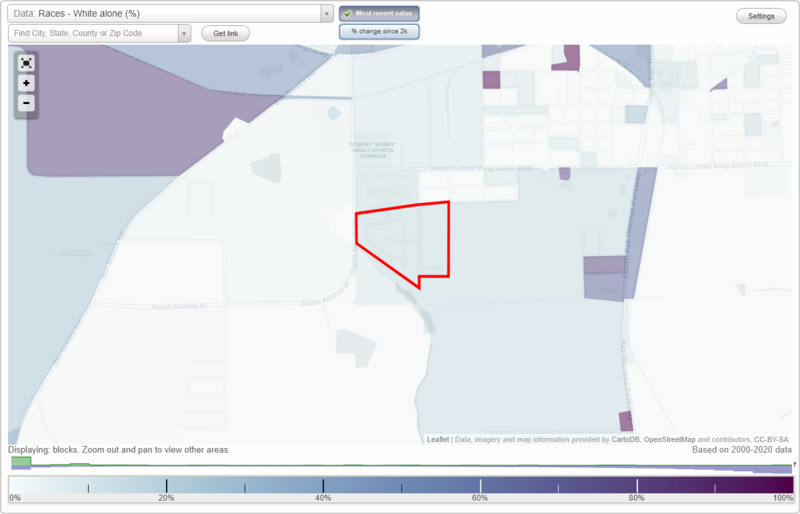
Area: 0.084 square miles
Population: 2
Population density:
| Osceola Park: | 24 people per square mile |
| Quincy: | 1,025 people per square mile |
Median household income in 2022:
| Osceola Park: | $54,013 |
| Quincy: | $33,786 |
Distribution of median household income
![Distribution of median household income]()
- 1Less than $10,000
- 1$10,000 to $19,999
- 1$20,000 to $29,999
- 1$30,000 to $39,999
- 1$40,000 to $49,999
- 1$50,000 to $59,999
- 1$60,000 to $74,999
- 1$75,000 to $99,999
- 1$100,000 to $124,999
- 1$125,000 to $149,999
- 1$150,000 to $199,999

Distribution of owner-occupied house/condo value
![Distribution of owner-occupied house/condo value]()
- 1Less than $50,000
- 1$50,000 to $99,999
- 1$100,000 to $149,999
- 1$150,000 to $199,999
- 1$200,000 to $249,999
- 1$250,000 to $299,999
- 1$300,000 to $399,999
- 1$400,000 to $499,999
- 1$500,000 to $749,999
- 1$750,000 to $999,999

Distribution of rent paid by renters
![Distribution of rent paid by renters]()
- 1$100 to $199
- 1$200 to $299
- 1$300 to $399
- 1$400 to $499
- 1$500 to $599
- 1$600 to $699
- 1$700 to $799
- 1$900 to $999
- 1$1,000 to $1,249

Median rent in 2022:
| Osceola Park: | $671 |
| Quincy: | $538 |
| Males: | 0 |
| Females: | 1 |
Males:
| This neighborhood: | 52.0 years |
| Whole city: | 34.2 years |
| This neighborhood: | 45.3 years |
| Whole city: | 35.2 years |
Average household size:
| Osceola Park: | 2.8 people |
| Quincy: | 2.8 people |
Percentage of family households:
| Osceola Park: | 44.8% |
| Quincy: | 49.1% |
| Here: | 27.6% |
| Quincy: | 23.2% |
Percentage of married-couple families with children (among all households):
| Osceola Park: | 91.7% |
| Quincy: | 15.4% |
Percentage of single-mother households (among all households):
| Osceola Park: | 38.1% |
| Quincy: | 17.5% |
Percentage of never married males 15 years old and over:
Percentage of never married females 15 years old and over:
| Osceola Park: | 13.1% |
| Quincy: | 25.0% |
Percentage of never married females 15 years old and over:
| Osceola Park: | 34.6% |
| city: | 25.4% |
Percentage of people that speak English not well or not at all:
| Osceola Park: | 0.0% |
| Quincy: | 5.2% |
Percentage of people born in this state:
Percentage of people born in another U.S. state:
Percentage of native residents but born outside the U.S.:
Percentage of foreign born residents:
| Here: | 77.3% |
| Quincy: | 75.0% |
Percentage of people born in another U.S. state:
| Osceola Park: | 16.8% |
| Quincy: | 13.2% |
Percentage of native residents but born outside the U.S.:
| Here: | 0.3% |
| city: | 1.9% |
Percentage of foreign born residents:
| Here: | 5.5% |
| Quincy: | 9.9% |
Average number of cars or other vehicles available in houses/condos:
Average number of cars or other vehicles available in apartments:
| This neighborhood: | 1.6 |
| Quincy: | 1.6 |
Average number of cars or other vehicles available in apartments:
| Here: | 1.4 |
| city: | 1.0 |
Percentage of units with a mortgage:
| Osceola Park: | 53.0% |
| Quincy: | 40.2% |
Travel time to work (commute)
![Travel time to work (commute)]()

Means of transportation to work
![Means of transportation to work]()

Time leaving home to go to work
![Time leaving home to go to work]()

Occupations of males:
- Percentage of males in management occupations (except farmers):
Here: 15.2% city: 8.7%
- Percentage of males in business and financial operations occupations:
Here: 6.5% city: 2.0%
- Percentage of males in community and social services occupations:
Here: 11.0% city: 2.3%
- Percentage of males in service occupations:
Here: 28.3% city: 27.0%
- Percentage of males in sales and office occupations:
Here: 7.8% city: 2.3%
- Percentage of males in farming, fishing, and forestry occupations:
Here: 18.8% city: 3.9%
- Percentage of males in construction, extraction, and maintenance occupations:
Here: 46.7% city: 14.7%
- Percentage of males in production occupations:
Here: 33.3% city: 2.1%
- Percentage of males in transportation occupations:
Here: 23.2% city: 9.9%
- Percentage of males in material moving occupations:
Here: 15.6% city: 9.7%
Occupations of females:
- Percentage of females in management occupations (except farmers):
Here: 29.1% city: 3.3%
- Percentage of females in business and financial operations occupations:
Here: 6.0% city: 7.9%
- Percentage of females in community and social services occupations:
Here: 16.7% city: 2.1%
- Percentage of females in education, training, and library occupations:
Here: 20.0% city: 4.3%
- Percentage of females in healthcare practitioners and technical occupations:
Here: 6.0% city: 2.9%
- Percentage of females in service occupations:
Here: 28.7% city: 42.7%
- Percentage of females in sales and office occupations:
Here: 45.3% city: 22.5%
- Percentage of females in farming, fishing, and forestry occupations:
Here: 27.4% city: 9.4%
- Percentage of females in material moving occupations:
Here: 3.4% city: 2.4%
Education in this neighborhood (subdivision or community):
- Percentage of people 3 years and older in K-12 schools:
Osceola Park: 0.0% Quincy: 21.8%
- Percentage of people 3 years and older in undergraduate colleges:
Osceola Park: 0.0% Quincy: 1.5%
- Percentage of people 3 years and older in grad. or professional schools:
Osceola Park: 0.0% Quincy: 0.1%
Percentage of population below poverty level:
| Osceola Park: | 32.6% |
| Quincy: | 46.7% |
Median year owner moved in (as recorded in 2022):
Median year renter moved in (as recorded in 2022):
| Osceola Park: | 1997 |
| Quincy: | 2002 |
Median year renter moved in (as recorded in 2022):
| Osceola Park: | 2009 |
| Quincy: | 2016 |
Percentage of married-couple families with both working:
| Osceola Park: | 59.5% |
| Quincy: | 67.2% |
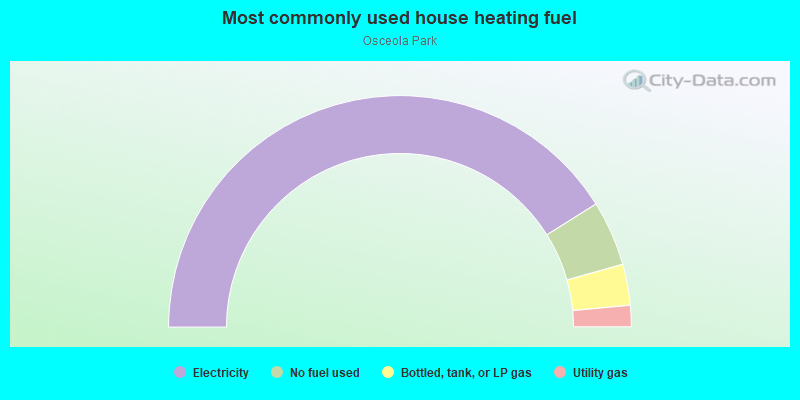
- 82.1%Electricity
- 9.1%No fuel used
- 5.7%Bottled, tank, or LP gas
- 3.0%Utility gas
Roads and streets:
Arlington Cir
Length: 0.59 miles
Directions: E-W, N-S, SE-NW, SW-NE
Directions: E-W, N-S, SE-NW, SW-NE
Kennedy Ln
Length: 0.15 miles
Directions: E-W, SE-NW
Directions: E-W, SE-NW
W Osceola St
Length: 0.10 miles
Direction: E-W
Address range: 1312 to 2047
Direction: E-W
Address range: 1312 to 2047
South Virginia St
Length: 0.10 miles
Direction: N-S
Address range: 824 to 899
Direction: N-S
Address range: 824 to 899