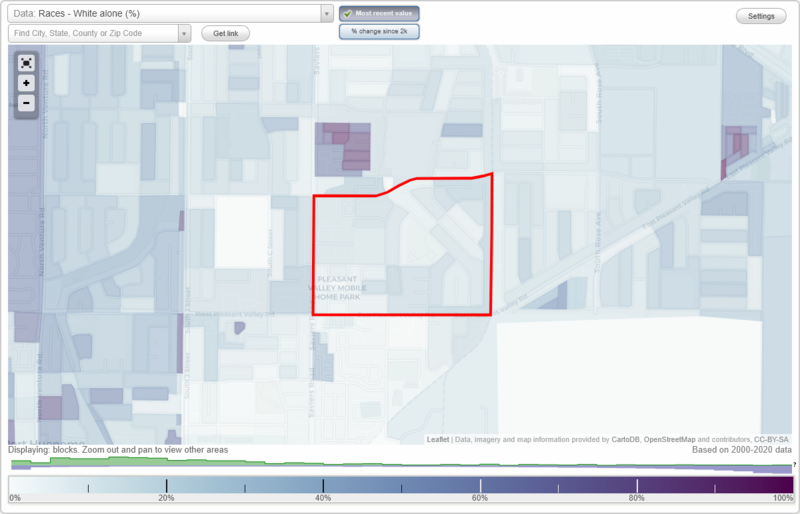
Pleasant Valley Estate neighborhood in Oxnard, California (CA), 93033 detailed profile
Settings
X

Business Search - 14 Million verified businesses
Area: 0.310 square miles
Population: 3,975
Population density:
| Pleasant Valley Estate: | 12,820 people per square mile |
| Oxnard: | 7,918 people per square mile |

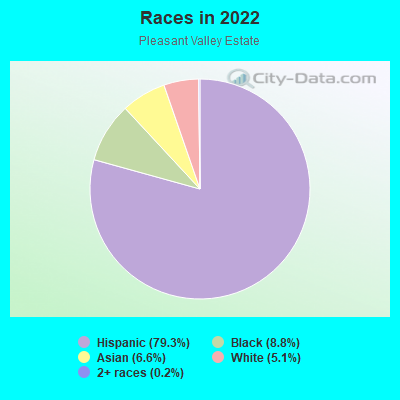
- 3,33679.3%Hispanic or Latino
- 3718.8%Black
- 2776.6%Asian
- 2155.1%White
- 90.2%Two or more races
Distribution of median household income
![Distribution of median household income]()
- 57Less than $10,000
- 102$10,000 to $19,999
- 250$20,000 to $29,999
- 137$30,000 to $39,999
- 120$40,000 to $49,999
- 74$50,000 to $59,999
- 107$60,000 to $74,999
- 167$75,000 to $99,999
- 79$100,000 to $124,999
- 134$125,000 to $149,999
- 41$150,000 to $199,999
- 92$200,000 or more

Distribution of owner-occupied house/condo value
![Distribution of owner-occupied house/condo value]()
- 14Less than $50,000
- 57$50,000 to $99,999
- 43$100,000 to $149,999
- 36$200,000 to $249,999
- 75$250,000 to $299,999
- 122$300,000 to $399,999
- 68$400,000 to $499,999
- 204$500,000 to $749,999
- 15$750,000 to $999,999

Distribution of rent paid by renters
![Distribution of rent paid by renters]()
- 47Less than $100
- 136$400 to $499
- 52$500 to $599
- 79$600 to $699
- 33$700 to $799
- 23$800 to $899
- 77$1,000 to $1,249
- 118$1,250 to $1,499
- 94$1,500 to $1,999
- 201$2,000 or more

Median rent in 2022:
| Pleasant Valley Estate: | $1,753 |
| Oxnard: | $1,876 |
| Males: | 1,985 |
| Females: | 1,990 |
Males:
| This neighborhood: | 33.2 years |
| Whole city: | 35.1 years |
| This neighborhood: | 28.8 years |
| Whole city: | 34.3 years |
Average household size:
| Pleasant Valley Estate: | 22.4 people |
| Oxnard: | 3.6 people |
Percentage of family households:
| Pleasant Valley Estate: | 68.1% |
| Oxnard: | 51.5% |
| Here: | 45.5% |
| Oxnard: | 47.9% |
Percentage of married-couple families with children (among all households):
| Pleasant Valley Estate: | 16.2% |
| Oxnard: | 16.4% |
Percentage of single-mother households (among all households):
| Pleasant Valley Estate: | 3.2% |
| Oxnard: | 8.1% |
Percentage of never married males 15 years old and over:
Percentage of never married females 15 years old and over:
| Pleasant Valley Estate: | 30.0% |
| Oxnard: | 22.9% |
Percentage of never married females 15 years old and over:
| Pleasant Valley Estate: | 22.0% |
| city: | 20.1% |
Percentage of people that speak English not well or not at all:
| Pleasant Valley Estate: | 32.7% |
| Oxnard: | 20.2% |
Percentage of people born in this state:
Percentage of people born in another U.S. state:
Percentage of native residents but born outside the U.S.:
Percentage of foreign born residents:
| Here: | 48.2% |
| Oxnard: | 58.8% |
Percentage of people born in another U.S. state:
| Pleasant Valley Estate: | 6.8% |
| Oxnard: | 6.5% |
Percentage of native residents but born outside the U.S.:
| Here: | 0.8% |
| city: | 1.4% |
Percentage of foreign born residents:
| Here: | 44.2% |
| Oxnard: | 33.3% |
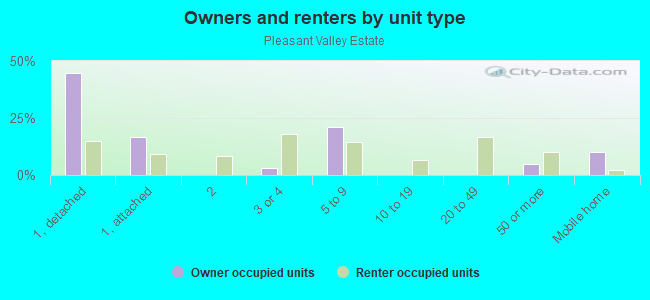
Owner-occupied
Renter-occupied

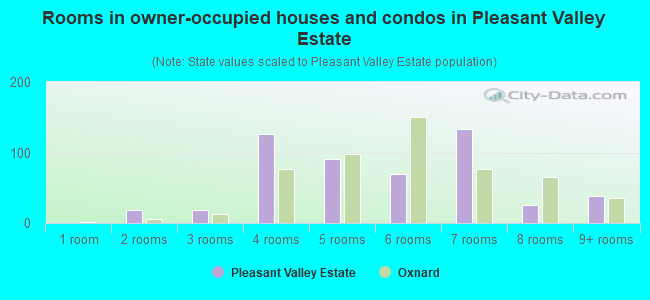
- Rooms in owner-occupied houses and condos in Pleasant Valley Estate
- 01 room
- 192 rooms
- 183 rooms
- 1264 rooms
- 915 rooms
- 696 rooms
- 1337 rooms
- 268 rooms
- 399+ rooms
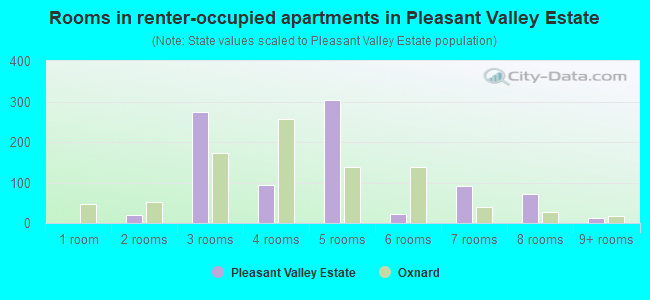
- Rooms in renter-occupied apartments in Pleasant Valley Estate
- 01 room
- 202 rooms
- 2743 rooms
- 954 rooms
- 3045 rooms
- 216 rooms
- 927 rooms
- 718 rooms
- 139+ rooms
Owner-occupied
Renter-occupied
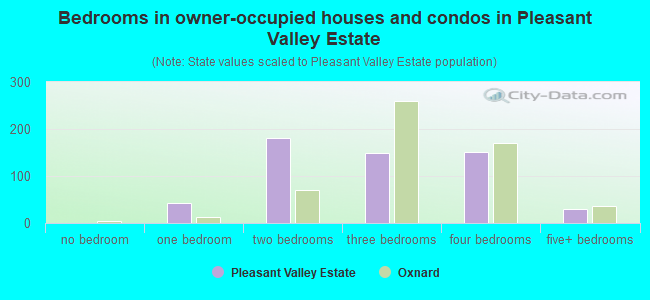
- Bedrooms in owner-occupied houses and condos in Pleasant Valley Estate
- 0no bedroom
- 421 bedroom
- 1802 bedrooms
- 1503 bedrooms
- 1524 bedrooms
- 305+ bedrooms
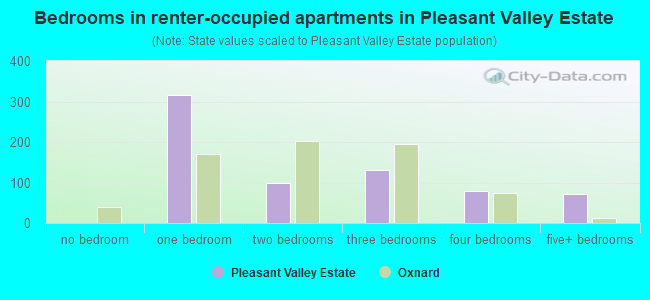
- Bedrooms in renter-occupied apartments in Pleasant Valley Estate
- 0no bedroom
- 3161 bedroom
- 1002 bedrooms
- 1303 bedrooms
- 784 bedrooms
- 715+ bedrooms
Average number of cars or other vehicles available in houses/condos:
Average number of cars or other vehicles available in apartments:
| This neighborhood: | 3.0 |
| Oxnard: | 2.5 |
Average number of cars or other vehicles available in apartments:
| Here: | 1.9 |
| city: | 1.9 |
Percentage of units with a mortgage:
| Pleasant Valley Estate: | 71.8% |
| Oxnard: | 65.5% |
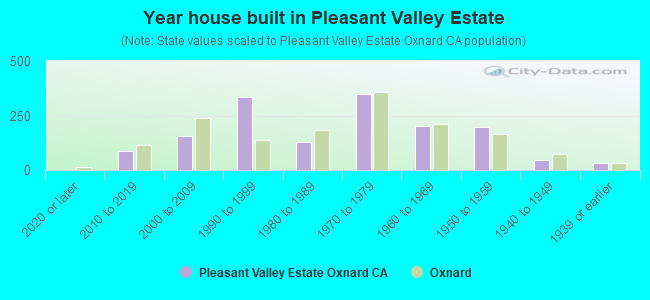
- Year house built in Pleasant Valley Estate
- 02020 or later
- 882010 to 2019
- 1552000 to 2009
- 3341990 to 1999
- 1281980 to 1989
- 3471970 to 1979
- 2021960 to 1969
- 1961950 to 1959
- 481940 to 1949
- 331939 or earlier
City-data.com crime index for city in 2020 (higher means more crime):
| City: | 220.0 |
| U.S. average: | 219.5 |
Travel time to work (commute)
![Travel time to work (commute)]()
- 725 to 9 minutes
- 7210 to 14 minutes
- 15815 to 19 minutes
- 13020 to 24 minutes
- 1,37925 to 29 minutes
- 32830 to 34 minutes
- 1435 to 39 minutes
- 3840 to 44 minutes
- 4845 to 59 minutes
- 7060 to 89 minutes
- 6790 or more minutes

Means of transportation to work
![Means of transportation to work]()
- 72.5%1,263Drove a car alone
- 24.7%430Carpooled
- 1.6%27Bus
- 2.0%35Taxi
- 0.5%9Bicycle
- 1.4%25Walked
- 1.2%21Other means
- 1.2%21Worked at home

Time leaving home to go to work
![Time leaving home to go to work]()
- 12812:00 a.m. to 4:59 a.m.
- 2415:00 a.m. to 5:29 a.m.
- 2515:30 a.m. to 5:59 a.m.
- 5106:00 a.m. to 6:29 a.m.
- 3256:30 a.m. to 6:59 a.m.
- 3027:00 a.m. to 7:29 a.m.
- 887:30 a.m. to 7:59 a.m.
- 1508:00 a.m. to 8:29 a.m.
- 178:30 a.m. to 8:59 a.m.
- 119:00 a.m. to 9:59 a.m.
- 2510:00 a.m. to 10:59 a.m.
- 2611:00 a.m. to 11:59 a.m.
- 8212:00 p.m. to 3:59 p.m.
- 1164:00 p.m. to 11:59 p.m.

Occupations of males:
- Percentage of males in business and financial operations occupations:
Here: 2.8% city: 2.6%
- Percentage of males in computer and mathematical occupations:
Here: 6.4% city: 2.4%
- Percentage of males in arts, design, entertainment, sports, and media occupations:
Here: 1.0% city: 1.1%
- Percentage of males in healthcare practitioners and technical occupations:
Here: 3.0% city: 1.3%
- Percentage of males in service occupations:
Here: 6.6% city: 16.9%
- Percentage of males in sales and office occupations:
Here: 20.7% city: 11.7%
- Percentage of males in farming, fishing, and forestry occupations:
Here: 24.3% city: 14.1%
- Percentage of males in construction, extraction, and maintenance occupations:
Here: 7.7% city: 9.8%
- Percentage of males in production occupations:
Here: 15.0% city: 9.6%
- Percentage of males in transportation occupations:
Here: 5.3% city: 6.5%
- Percentage of males in material moving occupations:
Here: 2.9% city: 6.3%
Occupations of females:
- Percentage of females in management occupations (except farmers):
Here: 3.0% city: 6.3%
- Percentage of females in business and financial operations occupations:
Here: 1.9% city: 5.3%
- Percentage of females in community and social services occupations:
Here: 1.3% city: 2.4%
- Percentage of females in arts, design, entertainment, sports, and media occupations:
Here: 1.0% city: 1.5%
- Percentage of females in healthcare practitioners and technical occupations:
Here: 2.5% city: 5.9%
- Percentage of females in service occupations:
Here: 15.9% city: 23.6%
- Percentage of females in sales and office occupations:
Here: 37.5% city: 27.3%
- Percentage of females in farming, fishing, and forestry occupations:
Here: 26.5% city: 8.0%
- Percentage of females in production occupations:
Here: 2.7% city: 6.8%
- Percentage of females in material moving occupations:
Here: 7.8% city: 3.7%
Percentage of people 16-64 in Armed Forces:
| Pleasant Valley Estate: | 0.2% |
| Oxnard: | 0.7% |
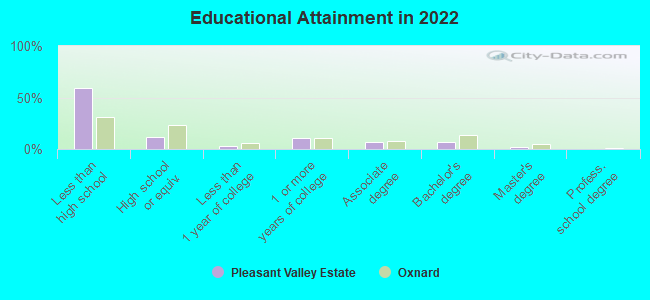
Education in this neighborhood (subdivision or community):
- Percentage of people 3 years and older in K-12 schools:
Pleasant Valley Estate: 18.6% Oxnard: 21.0%
- Percentage of people 3 years and older in undergraduate colleges:
Pleasant Valley Estate: 5.9% Oxnard: 5.2%
- Percentage of people 3 years and older in grad. or professional schools:
Pleasant Valley Estate: 1.3% Oxnard: 0.8%
- Percentage of students K-12 enrolled in private schools:
Pleasant Valley Estate: 14.5% Oxnard: 4.0%
Percentage of population below poverty level:
| Pleasant Valley Estate: | 13.1% |
| Oxnard: | 12.8% |
Median year owner moved in (as recorded in 2022):
Median year renter moved in (as recorded in 2022):
| Pleasant Valley Estate: | 2008 |
| Oxnard: | 2006 |
Median year renter moved in (as recorded in 2022):
| Pleasant Valley Estate: | 2014 |
| Oxnard: | 2019 |
Percentage of married-couple families with both working:
| Pleasant Valley Estate: | 49.1% |
| Oxnard: | 71.8% |
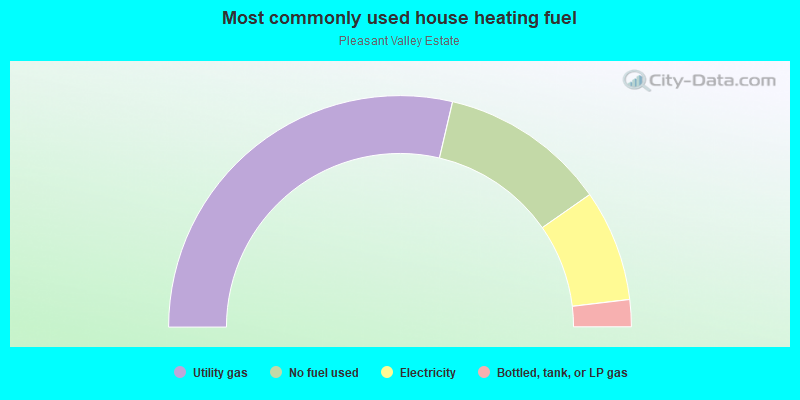
- 57.3%Utility gas
- 23.3%No fuel used
- 15.6%Electricity
- 3.8%Bottled, tank, or LP gas
Roads and streets:
E Dollie St
Length: 0.57 miles
Directions: E-W, SW-NE
Address range: 110 to 899
Directions: E-W, SW-NE
Address range: 110 to 899
Justin Way
Length: 0.54 miles
Directions: N-S, SE-NW
Address range: 4264 to 5099
Directions: N-S, SE-NW
Address range: 4264 to 5099
San Juan Ave
Length: 0.54 miles
Directions: N-S, SE-NW, SW-NE
Address range: 4224 to 5099
Directions: N-S, SE-NW, SW-NE
Address range: 4224 to 5099
Frost Dr
Length: 0.42 miles
Directions: E-W, N-S, SE-NW
Address range: 4200 to 4799
Directions: E-W, N-S, SE-NW
Address range: 4200 to 4799
Cloyne St
Length: 0.42 miles
Directions: N-S, SW-NE
Address range: 4300 to 5099
Directions: N-S, SW-NE
Address range: 4300 to 5099
Berkshire Pl
Length: 0.33 miles
Directions: E-W, SW-NE
Address range: 600 to 999
Directions: E-W, SW-NE
Address range: 600 to 999
Clover Dr
Length: 0.32 miles
Directions: N-S, SW-NE
Address range: 4400 to 4999
Directions: N-S, SW-NE
Address range: 4400 to 4999
Yale Pl
Length: 0.31 miles
Directions: E-W, SW-NE
Address range: 500 to 899
Directions: E-W, SW-NE
Address range: 500 to 899
E Pleasant Valley Rd
Length: 0.29 miles
Direction: E-W
Address range: 107 to 599
Direction: E-W
Address range: 107 to 599
Percy St
Length: 0.29 miles
Direction: E-W
Address range: 400 to 599
Direction: E-W
Address range: 400 to 599
Rubens Pl
Length: 0.29 miles
Directions: E-W, SW-NE
Address range: 600 to 999
Directions: E-W, SW-NE
Address range: 600 to 999
Halsey Dr (Nimitz Dr)
Length: 0.23 miles
Directions: E-W, N-S, SE-NW
Address range: 4200 to 4499
Directions: E-W, N-S, SE-NW
Address range: 4200 to 4499
San Simeon Dr
Length: 0.23 miles
Directions: N-S, SW-NE
Address range: 4200 to 4599
Directions: N-S, SW-NE
Address range: 4200 to 4599
Halsey Way
Length: 0.19 miles
Directions: N-S, SW-NE
Address range: 4700 to 5099
Directions: N-S, SW-NE
Address range: 4700 to 5099
Refsing Pl
Length: 0.18 miles
Direction: N-S
Direction: N-S
Broadfield Pl
Length: 0.18 miles
Direction: N-S
Address range: 4700 to 5099
Direction: N-S
Address range: 4700 to 5099
Squires Dr
Length: 0.18 miles
Direction: N-S
Address range: 4800 to 5099
Direction: N-S
Address range: 4800 to 5099
Andrea Dr
Length: 0.18 miles
Direction: E-W
Address range: 400 to 699
Direction: E-W
Address range: 400 to 699
E Bard Rd
Length: 0.14 miles
Direction: E-W
Address range: 231 to 598
Direction: E-W
Address range: 231 to 598
Davis Ct
Length: 0.14 miles
Directions: N-S, SW-NE
Address range: 4300 to 4499
Directions: N-S, SW-NE
Address range: 4300 to 4499
Helena Way
Length: 0.11 miles
Direction: E-W
Address range: 400 to 599
Direction: E-W
Address range: 400 to 599
Petit Dr
Length: 0.11 miles
Direction: N-S
Address range: 4800 to 4999
Direction: N-S
Address range: 4800 to 4999
Ivan Dr
Length: 0.10 miles
Direction: N-S
Address range: 4800 to 5099
Direction: N-S
Address range: 4800 to 5099
Rose St
Length: 0.08 miles
Direction: E-W
Address range: 1 to 399
Direction: E-W
Address range: 1 to 399
Smith St
Length: 0.08 miles
Direction: E-W
Address range: 1 to 399
Direction: E-W
Address range: 1 to 399
Ashton St
Length: 0.08 miles
Direction: E-W
Address range: 1 to 399
Direction: E-W
Address range: 1 to 399
Helena Ct
Length: 0.07 miles
Direction: E-W
Address range: 600 to 799
Direction: E-W
Address range: 600 to 799
Andrea Ct
Length: 0.07 miles
Direction: E-W
Address range: 700 to 799
Direction: E-W
Address range: 700 to 799