Porter Square neighborhood in Cambridge, Massachusetts (MA), 02140 detailed profile
Settings
X

Business Search - 14 Million verified businesses
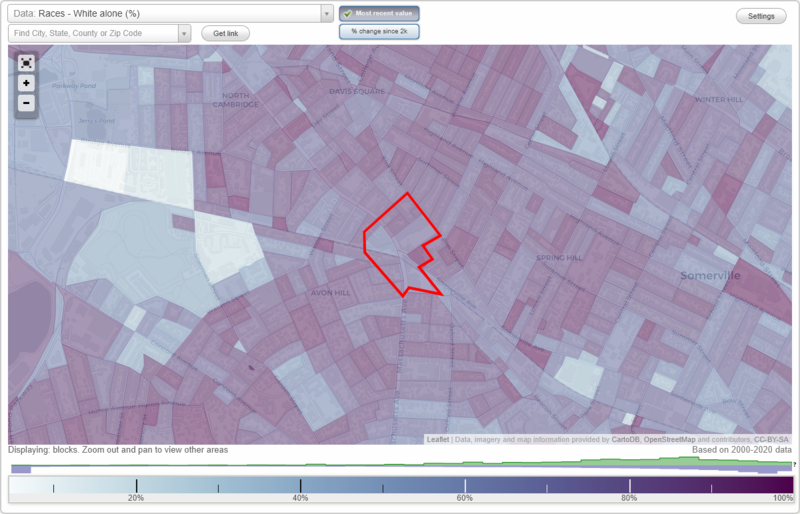
Area: 0.050 square miles
Population: 8,257
Population density:
| Porter Square: | 166,185 people per square mile |
| Cambridge: | 18,431 people per square mile |

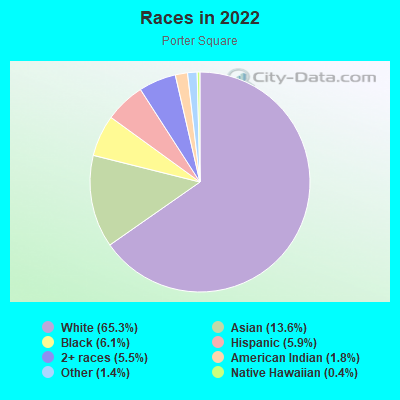
- 5,59765.3%White
- 1,16913.6%Asian
- 5206.1%Black
- 5075.9%Hispanic or Latino
- 4695.5%Two or more races
- 1541.8%American Indian
- 1191.4%Some other race
- 310.4%Native Hawaiian and Other
Pacific Islander
Distribution of median household income
![Distribution of median household income]()
- 247Less than $10,000
- 268$10,000 to $19,999
- 208$20,000 to $29,999
- 225$30,000 to $39,999
- 313$40,000 to $49,999
- 121$50,000 to $59,999
- 244$60,000 to $74,999
- 486$75,000 to $99,999
- 317$100,000 to $124,999
- 294$125,000 to $149,999
- 449$150,000 to $199,999
- 1,350$200,000 or more

Distribution of owner-occupied house/condo value
![Distribution of owner-occupied house/condo value]()
- 146Less than $50,000
- 24$50,000 to $99,999
- 111$150,000 to $199,999
- 69$200,000 to $249,999
- 88$300,000 to $399,999
- 114$400,000 to $499,999
- 232$500,000 to $749,999
- 460$750,000 to $999,999
- 914$1,000,000 or more

Distribution of rent paid by renters
![Distribution of rent paid by renters]()
- 20Less than $100
- 58$100 to $199
- 193$200 to $299
- 42$300 to $399
- 112$400 to $499
- 51$500 to $599
- 171$700 to $799
- 76$800 to $899
- 15$900 to $999
- 101$1,000 to $1,249
- 183$1,250 to $1,499
- 439$1,500 to $1,999
- 1,461$2,000 or more

Median rent in 2022:
| Porter Square: | $2,669 |
| Cambridge: | $2,001 |
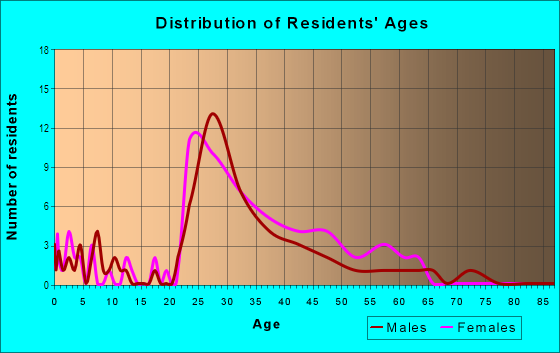
| Males: | 3,962 |
| Females: | 4,295 |
Males:
| This neighborhood: | 38.4 years |
| Whole city: | 29.0 years |
| This neighborhood: | 37.7 years |
| Whole city: | 30.2 years |
Average household size:
| Porter Square: | 2.3 people |
| Cambridge: | 2.0 people |
Percentage of family households:
| Porter Square: | 25.3% |
| Cambridge: | 27.0% |
| Here: | 38.0% |
| Cambridge: | 26.5% |
Percentage of married-couple families with children (among all households):
| Porter Square: | 39.6% |
| Cambridge: | 31.6% |
Percentage of single-mother households (among all households):
| Porter Square: | 6.1% |
| Cambridge: | 9.2% |
Percentage of never married males 15 years old and over:
Percentage of never married females 15 years old and over:
| Porter Square: | 24.9% |
| Cambridge: | 31.1% |
Percentage of never married females 15 years old and over:
| Porter Square: | 27.7% |
| city: | 31.0% |
Percentage of people that speak English not well or not at all:
| Porter Square: | 0.3% |
| Cambridge: | 2.0% |
Percentage of people born in this state:
Percentage of people born in another U.S. state:
Percentage of native residents but born outside the U.S.:
Percentage of foreign born residents:
| Here: | 30.3% |
| Cambridge: | 31.3% |
Percentage of people born in another U.S. state:
| Porter Square: | 46.5% |
| Cambridge: | 37.0% |
Percentage of native residents but born outside the U.S.:
| Here: | 1.6% |
| city: | 2.9% |
Percentage of foreign born residents:
| Here: | 21.7% |
| Cambridge: | 28.8% |
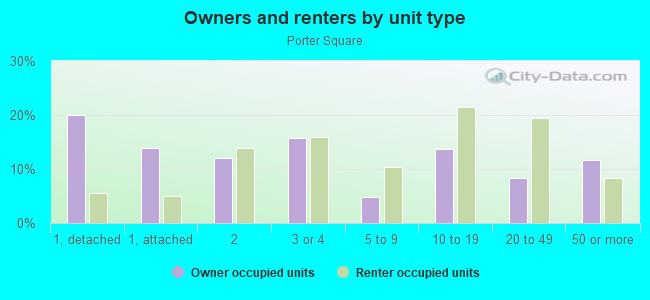
Owner-occupied
Renter-occupied

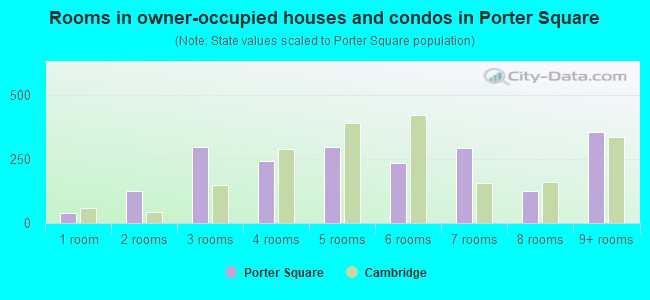
- Rooms in owner-occupied houses and condos in Porter Square
- 381 room
- 1242 rooms
- 2983 rooms
- 2434 rooms
- 2975 rooms
- 2346 rooms
- 2957 rooms
- 1248 rooms
- 3569+ rooms
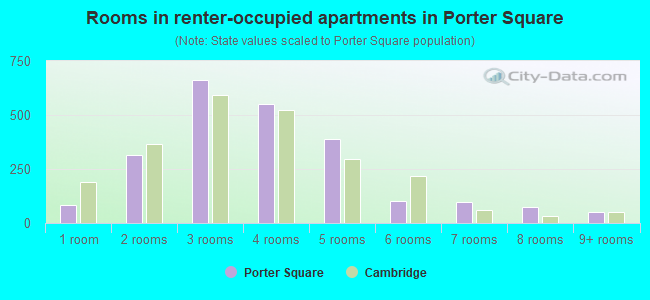
- Rooms in renter-occupied apartments in Porter Square
- 851 room
- 3172 rooms
- 6613 rooms
- 5514 rooms
- 3895 rooms
- 1046 rooms
- 967 rooms
- 738 rooms
- 519+ rooms
Owner-occupied
Renter-occupied
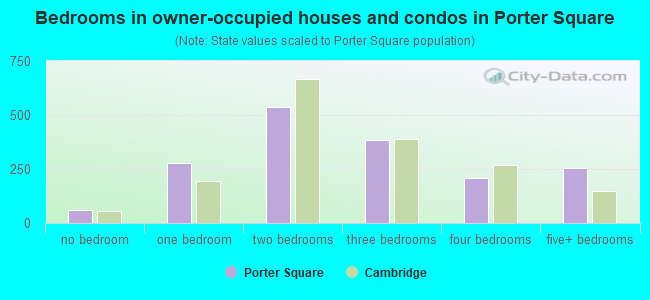
- Bedrooms in owner-occupied houses and condos in Porter Square
- 61no bedroom
- 2761 bedroom
- 5392 bedrooms
- 3843 bedrooms
- 2094 bedrooms
- 2565+ bedrooms
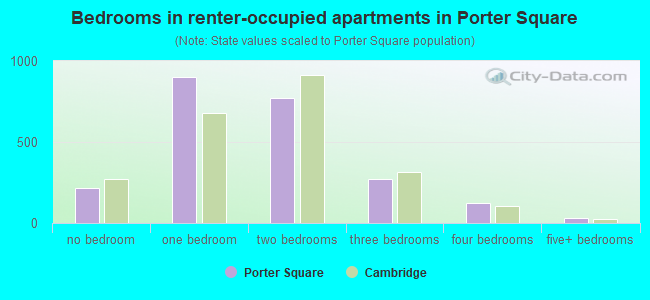
- Bedrooms in renter-occupied apartments in Porter Square
- 216no bedroom
- 9001 bedroom
- 7702 bedrooms
- 2743 bedrooms
- 1214 bedrooms
- 335+ bedrooms
Average number of cars or other vehicles available in houses/condos:
Average number of cars or other vehicles available in apartments:
| This neighborhood: | 1.3 |
| Cambridge: | 1.2 |
Average number of cars or other vehicles available in apartments:
| Here: | 0.7 |
| city: | 0.7 |
Percentage of units with a mortgage:
| Porter Square: | 55.3% |
| Cambridge: | 54.3% |
Housing prices:
- Average estimated value of detached houses in 2022 (13.2% of all units):
Porter Square: $2,281,681 Cambridge: $1,977,975
- Average estimated value of townhouses or other attached units in 2022 (9.7% of all units):
This neighborhood: $1,414,783 city: $1,595,129
- Average estimated '22 value of housing units in 3-to-4-unit structures (19.5% of all units):
Porter Square: $1,152,372 city: $881,306
- Average estimated '22 value of housing units in 5-or-more-unit structures (7.7% of all units):
Porter Square: $620,221 Cambridge: $860,276
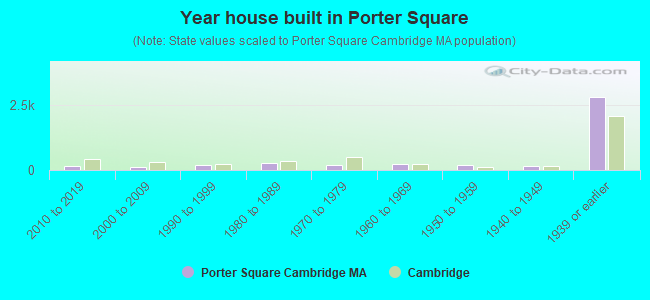
- Year house built in Porter Square
- 162020 or later
- 1532010 to 2019
- 1192000 to 2009
- 1961990 to 1999
- 2741980 to 1989
- 1731970 to 1979
- 2221960 to 1969
- 2001950 to 1959
- 1591940 to 1949
- 2,7821939 or earlier
City-data.com crime index for city in 2020 (higher means more crime):
| City: | 157.6 |
| U.S. average: | 219.5 |
Travel time to work (commute)
![Travel time to work (commute)]()
- 52Less than 5 minutes
- 1605 to 9 minutes
- 22610 to 14 minutes
- 34915 to 19 minutes
- 47720 to 24 minutes
- 31625 to 29 minutes
- 64630 to 34 minutes
- 16735 to 39 minutes
- 20240 to 44 minutes
- 38945 to 59 minutes
- 10160 to 89 minutes
- 4590 or more minutes

Means of transportation to work
![Means of transportation to work]()
- 22.9%1,148Drove a car alone
- 3.4%170Carpooled
- 3.9%194Bus
- 16.4%823Subway or elevated rail
- 2.2%112Long-distance train or commuter rail
- 1.0%52Light rail, streetcar or trolley
- 1.9%93Taxi
- 1.2%58Motorcycle
- 6.7%339Bicycle
- 15.8%793Walked
- 0.6%32Other means
- 28.9%1,452Worked at home

Time leaving home to go to work
![Time leaving home to go to work]()
- 2812:00 a.m. to 4:59 a.m.
- 195:00 a.m. to 5:29 a.m.
- 795:30 a.m. to 5:59 a.m.
- 1096:00 a.m. to 6:29 a.m.
- 1266:30 a.m. to 6:59 a.m.
- 4207:00 a.m. to 7:29 a.m.
- 3227:30 a.m. to 7:59 a.m.
- 6458:00 a.m. to 8:29 a.m.
- 5118:30 a.m. to 8:59 a.m.
- 3809:00 a.m. to 9:59 a.m.
- 15510:00 a.m. to 10:59 a.m.
- 9411:00 a.m. to 11:59 a.m.
- 11112:00 p.m. to 3:59 p.m.
- 954:00 p.m. to 11:59 p.m.

Occupations of males:
- Percentage of males in management occupations (except farmers):
Here: 10.6% city: 12.7%
- Percentage of males in business and financial operations occupations:
Here: 8.0% city: 8.9%
- Percentage of males in computer and mathematical occupations:
Here: 13.2% city: 14.7%
- Percentage of males in architecture and engineering occupations:
Here: 9.3% city: 5.8%
- Percentage of males in life, physical, and social science occupations:
Here: 9.0% city: 11.7%
- Percentage of males in community and social services occupations:
Here: 1.1% city: 1.1%
- Percentage of males in legal occupations:
Here: 5.2% city: 2.5%
- Percentage of males in education, training, and library occupations:
Here: 18.7% city: 15.8%
- Percentage of males in arts, design, entertainment, sports, and media occupations:
Here: 4.7% city: 3.8%
- Percentage of males in healthcare practitioners and technical occupations:
Here: 5.2% city: 3.7%
- Percentage of males in service occupations:
Here: 3.9% city: 5.0%
- Percentage of males in sales and office occupations:
Here: 6.7% city: 7.2%
- Percentage of males in transportation occupations:
Here: 1.7% city: 2.3%
Occupations of females:
- Percentage of females in management occupations (except farmers):
Here: 11.9% city: 12.8%
- Percentage of females in business and financial operations occupations:
Here: 12.0% city: 10.9%
- Percentage of females in computer and mathematical occupations:
Here: 5.4% city: 5.9%
- Percentage of females in architecture and engineering occupations:
Here: 3.5% city: 2.2%
- Percentage of females in life, physical, and social science occupations:
Here: 10.5% city: 10.9%
- Percentage of females in community and social services occupations:
Here: 1.1% city: 2.0%
- Percentage of females in legal occupations:
Here: 3.8% city: 2.9%
- Percentage of females in education, training, and library occupations:
Here: 22.3% city: 17.7%
- Percentage of females in arts, design, entertainment, sports, and media occupations:
Here: 5.1% city: 4.9%
- Percentage of females in healthcare practitioners and technical occupations:
Here: 6.8% city: 7.0%
- Percentage of females in service occupations:
Here: 4.3% city: 8.9%
- Percentage of females in sales and office occupations:
Here: 10.5% city: 11.9%
Percentage of people 16-64 in Armed Forces:
| Porter Square: | 0.3% |
| Cambridge: | 0.2% |
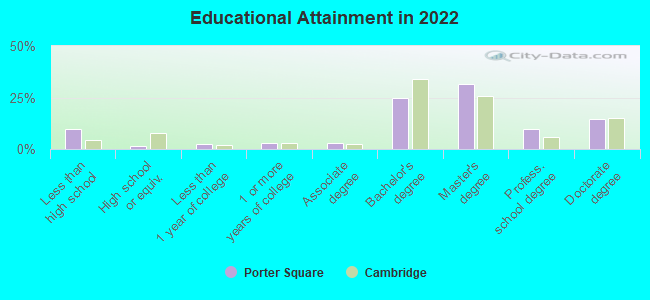
Education in this neighborhood (subdivision or community):
- Percentage of people 3 years and older in K-12 schools:
Porter Square: 11.0% Cambridge: 8.3%
- Percentage of people 3 years and older in undergraduate colleges:
Porter Square: 18.9% Cambridge: 15.4%
- Percentage of people 3 years and older in grad. or professional schools:
Porter Square: 10.4% Cambridge: 12.3%
- Percentage of students K-12 enrolled in private schools:
Porter Square: 65.7% Cambridge: 13.9%
Percentage of population below poverty level:
| Porter Square: | 7.9% |
| Cambridge: | 14.6% |
Median year renter moved in (as recorded in 2022):
| Porter Square: | 2277 |
| Cambridge: | 2022 |
Percentage of married-couple families with both working:
| Porter Square: | 86.7% |
| Cambridge: | 76.5% |
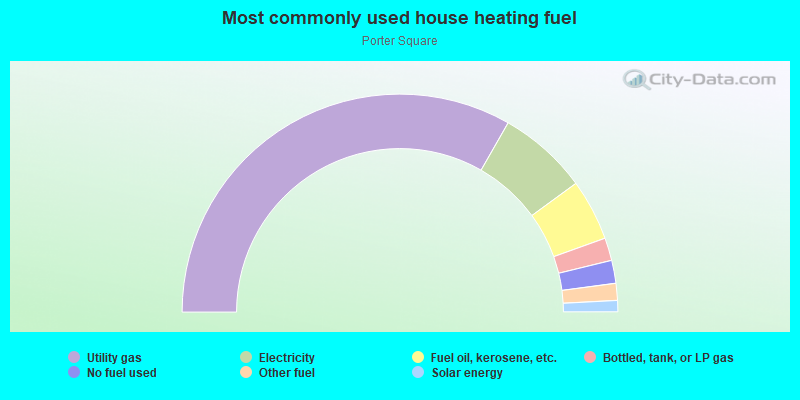
- 66.6%Utility gas
- 13.4%Electricity
- 9.1%Fuel oil, kerosene, etc.
- 3.4%Bottled, tank, or LP gas
- 3.4%No fuel used
- 2.5%Other fuel
- 1.7%Solar energy
Highways in this neighborhood:
Massachusetts Ave (State Hwy 2 Alt)
Length: 0.49 miles
Directions: N-S, SE-NW
Address range: 1820 to 1960
Directions: N-S, SE-NW
Address range: 1820 to 1960
Roads and streets:
Porter Rd
Length: 0.20 miles
Directions: E-W, SE-NW, SW-NE
Address range: 1 to 99
Directions: E-W, SE-NW, SW-NE
Address range: 1 to 99
White St
Length: 0.15 miles
Direction: SW-NE
Address range: 1 to 99
Direction: SW-NE
Address range: 1 to 99
Davenport St
Length: 0.13 miles
Direction: SW-NE
Address range: 7 to 45
Direction: SW-NE
Address range: 7 to 45
Allen St
Length: 0.08 miles
Direction: SW-NE
Address range: 1 to 99
Direction: SW-NE
Address range: 1 to 99
Orchard St
Length: 0.05 miles
Direction: SE-NW
Address range: 2 to 16
Direction: SE-NW
Address range: 2 to 16
Porter Sq
Length: 0.05 miles
Direction: E-W
Direction: E-W
Porter Park
Length: 0.03 miles
Direction: SE-NW
Address range: 1 to 99
Direction: SE-NW
Address range: 1 to 99
Railroad features:
Mbta Commuter Rail
Length: 0.01 miles
Direction: E-W
Direction: E-W