River East neighborhood in Chicago, Illinois (IL), 60611 detailed profile
Settings
X

Business Search - 14 Million verified businesses
Area: 0.354 square miles
Population: 8,920
Population density:
| River East: | 25,225 people per square mile |
| Chicago: | 11,734 people per square mile |

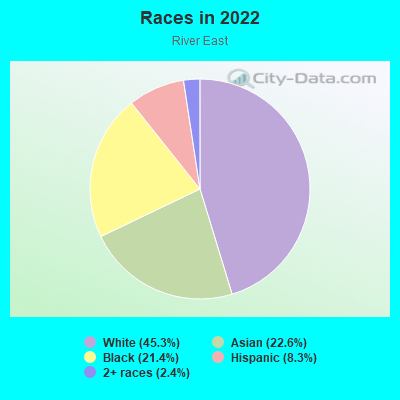
- 4,46345.3%White
- 2,22722.6%Asian
- 2,10521.4%Black
- 8148.3%Hispanic or Latino
- 2382.4%Two or more races
Median household income in 2022:
| River East: | $165,439 |
| Chicago: | $70,386 |
Distribution of median household income
![Distribution of median household income]()
- 517Less than $10,000
- 137$10,000 to $19,999
- 477$20,000 to $29,999
- 2,292$30,000 to $39,999
- 388$40,000 to $49,999
- 458$50,000 to $59,999
- 235$60,000 to $74,999
- 415$75,000 to $99,999
- 1,820$100,000 to $124,999
- 302$125,000 to $149,999
- 1,131$150,000 to $199,999
- 1,131$200,000 or more

Distribution of owner-occupied house/condo value
![Distribution of owner-occupied house/condo value]()
- 668Less than $50,000
- 186$50,000 to $99,999
- 70$100,000 to $149,999
- 2,508$150,000 to $199,999
- 696$200,000 to $249,999
- 908$250,000 to $299,999
- 375$300,000 to $399,999
- 439$400,000 to $499,999
- 530$500,000 to $749,999
- 475$750,000 to $999,999
- 3,052$1,000,000 or more

Distribution of rent paid by renters
![Distribution of rent paid by renters]()
- 190$400 to $499
- 279$900 to $999
- 190$1,000 to $1,249
- 289$1,250 to $1,499
- 752$1,500 to $1,999
- 2,380$2,000 or more

Median rent in 2022:
| River East: | $1,910 |
| Chicago: | $1,161 |
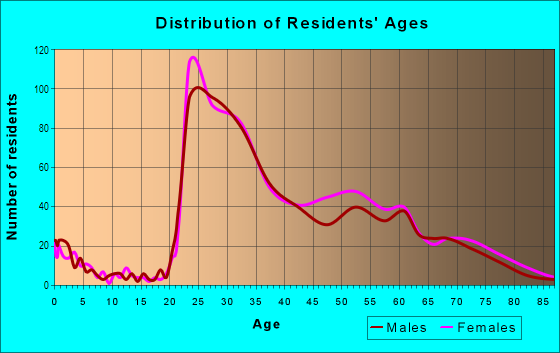
| Males: | 5,056 |
| Females: | 3,863 |
Males:
| This neighborhood: | 38.7 years |
| Whole city: | 35.3 years |
| This neighborhood: | 42.9 years |
| Whole city: | 36.2 years |
Average household size:
| River East: | 1.5 people |
| Chicago: | 2.3 people |
Percentage of family households:
| River East: | 22.5% |
| Chicago: | 36.7% |
| Here: | 25.3% |
| Chicago: | 30.4% |
Percentage of married-couple families with children (among all households):
| River East: | 163.9% |
| Chicago: | 24.1% |
Percentage of single-mother households (among all households):
| River East: | 47.8% |
| Chicago: | 16.0% |
Percentage of never married males 15 years old and over:
Percentage of never married females 15 years old and over:
| River East: | 31.6% |
| Chicago: | 24.5% |
Percentage of never married females 15 years old and over:
| River East: | 21.4% |
| city: | 24.9% |
Percentage of people that speak English not well or not at all:
| River East: | 1.5% |
| Chicago: | 7.1% |
Percentage of people born in this state:
Percentage of people born in another U.S. state:
Percentage of native residents but born outside the U.S.:
Percentage of foreign born residents:
| Here: | 41.9% |
| Chicago: | 58.6% |
Percentage of people born in another U.S. state:
| River East: | 37.9% |
| Chicago: | 18.8% |
Percentage of native residents but born outside the U.S.:
| Here: | 1.5% |
| city: | 2.1% |
Percentage of foreign born residents:
| Here: | 18.7% |
| Chicago: | 20.6% |
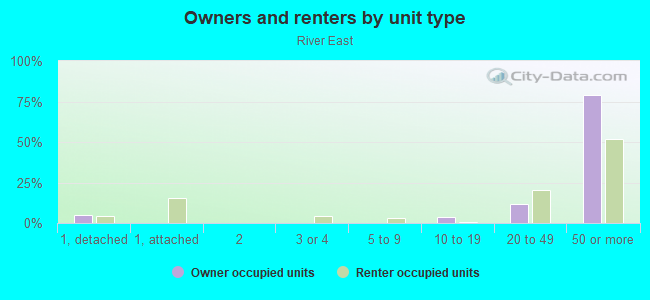
Owner-occupied
Renter-occupied

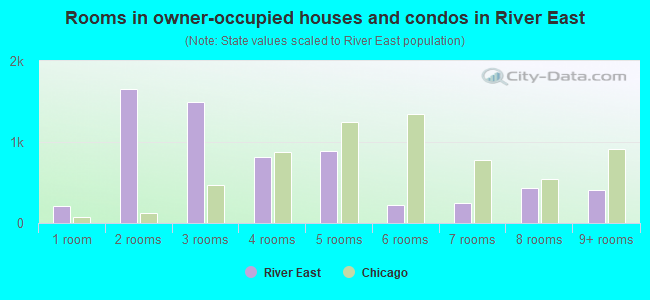
- Rooms in owner-occupied houses and condos in River East
- 2081 room
- 1,6532 rooms
- 1,4903 rooms
- 8194 rooms
- 8935 rooms
- 2276 rooms
- 2487 rooms
- 4288 rooms
- 4079+ rooms
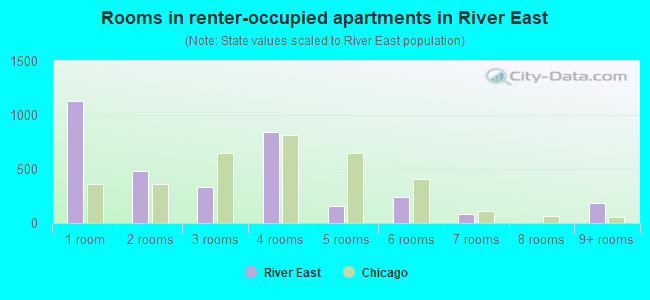
- Rooms in renter-occupied apartments in River East
- 1,1341 room
- 4852 rooms
- 3353 rooms
- 8474 rooms
- 1595 rooms
- 2376 rooms
- 877 rooms
- 08 rooms
- 1879+ rooms
Owner-occupied
Renter-occupied
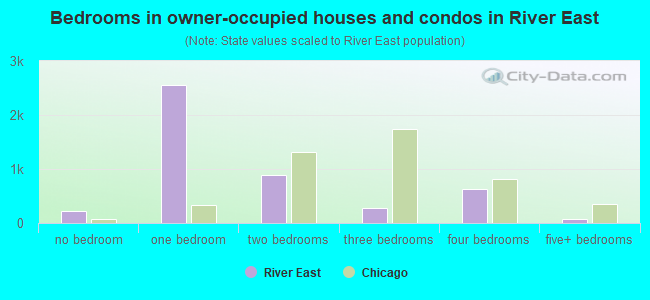
- Bedrooms in owner-occupied houses and condos in River East
- 227no bedroom
- 2,5561 bedroom
- 8872 bedrooms
- 2753 bedrooms
- 6314 bedrooms
- 835+ bedrooms
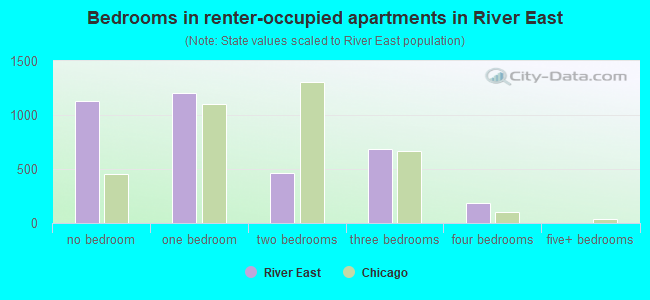
- Bedrooms in renter-occupied apartments in River East
- 1,134no bedroom
- 1,2001 bedroom
- 4592 bedrooms
- 6863 bedrooms
- 1874 bedrooms
- 05+ bedrooms
Average number of cars or other vehicles available in houses/condos:
Average number of cars or other vehicles available in apartments:
| This neighborhood: | 0.4 |
| Chicago: | 1.5 |
Average number of cars or other vehicles available in apartments:
| Here: | 0.8 |
| city: | 0.8 |
Percentage of units with a mortgage:
| River East: | 72.1% |
| Chicago: | 64.7% |
Average estimated '22 value of housing units in 5-or-more-unit structures (89.5% of all units):
| River East: | $790,428 |
| Chicago: | $416,975 |
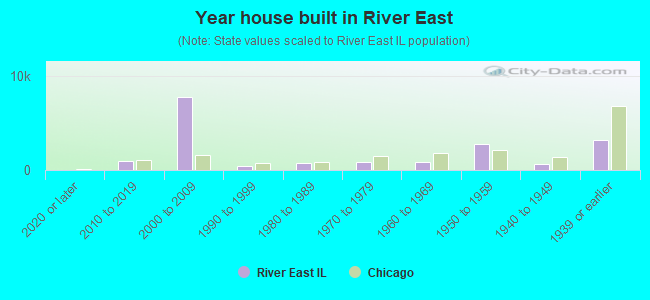
- Year house built in River East
- 02020 or later
- 9302010 to 2019
- 7,7582000 to 2009
- 4771990 to 1999
- 7511980 to 1989
- 8111970 to 1979
- 8141960 to 1969
- 2,7441950 to 1959
- 6161940 to 1949
- 3,2131939 or earlier
City-data.com crime index for city in 2020 (higher means more crime):
| City: | 421.1 |
| U.S. average: | 219.5 |
Travel time to work (commute)
![Travel time to work (commute)]()
- 240Less than 5 minutes
- 3535 to 9 minutes
- 1,22610 to 14 minutes
- 2,65515 to 19 minutes
- 1,18220 to 24 minutes
- 73225 to 29 minutes
- 1,09830 to 34 minutes
- 15035 to 39 minutes
- 67240 to 44 minutes
- 49045 to 59 minutes
- 96060 to 89 minutes
- 10090 or more minutes

Means of transportation to work
![Means of transportation to work]()
- 19.7%1,172Drove a car alone
- 22.1%1,313Carpooled
- 14.7%871Bus
- 9.5%562Subway or elevated rail
- 3.1%187Long-distance train or commuter rail
- 3.5%207Taxi
- 4.0%238Bicycle
- 19.9%1,181Walked
- 11.6%689Other means
- 18.0%1,070Worked at home

Time leaving home to go to work
![Time leaving home to go to work]()
- 2512:00 a.m. to 4:59 a.m.
- 2445:00 a.m. to 5:29 a.m.
- 1935:30 a.m. to 5:59 a.m.
- 8996:00 a.m. to 6:29 a.m.
- 4426:30 a.m. to 6:59 a.m.
- 6837:00 a.m. to 7:29 a.m.
- 1,2057:30 a.m. to 7:59 a.m.
- 2,2118:00 a.m. to 8:29 a.m.
- 9128:30 a.m. to 8:59 a.m.
- 1,8209:00 a.m. to 9:59 a.m.
- 45210:00 a.m. to 10:59 a.m.
- 64811:00 a.m. to 11:59 a.m.
- 13012:00 p.m. to 3:59 p.m.
- 664:00 p.m. to 11:59 p.m.

Occupations of males:
- Percentage of males in management occupations (except farmers):
Here: 9.4% city: 12.0%
- Percentage of males in business and financial operations occupations:
Here: 8.9% city: 7.9%
- Percentage of males in computer and mathematical occupations:
Here: 18.0% city: 6.3%
- Percentage of males in architecture and engineering occupations:
Here: 18.2% city: 2.4%
- Percentage of males in life, physical, and social science occupations:
Here: 3.6% city: 1.1%
- Percentage of males in legal occupations:
Here: 3.0% city: 2.1%
- Percentage of males in education, training, and library occupations:
Here: 5.6% city: 4.2%
- Percentage of males in arts, design, entertainment, sports, and media occupations:
Here: 3.3% city: 3.0%
- Percentage of males in healthcare practitioners and technical occupations:
Here: 10.0% city: 3.1%
- Percentage of males in service occupations:
Here: 4.1% city: 15.8%
- Percentage of males in sales and office occupations:
Here: 10.0% city: 14.5%
- Percentage of males in production occupations:
Here: 1.7% city: 5.6%
- Percentage of males in transportation occupations:
Here: 4.2% city: 6.5%
- Percentage of males in material moving occupations:
Here: 1.9% city: 5.4%
Occupations of females:
- Percentage of females in management occupations (except farmers):
Here: 24.2% city: 11.1%
- Percentage of females in business and financial operations occupations:
Here: 11.1% city: 9.2%
- Percentage of females in architecture and engineering occupations:
Here: 6.2% city: 0.8%
- Percentage of females in life, physical, and social science occupations:
Here: 5.0% city: 1.2%
- Percentage of females in community and social services occupations:
Here: 4.3% city: 3.0%
- Percentage of females in arts, design, entertainment, sports, and media occupations:
Here: 1.5% city: 3.1%
- Percentage of females in healthcare practitioners and technical occupations:
Here: 21.3% city: 8.5%
- Percentage of females in service occupations:
Here: 2.4% city: 19.6%
- Percentage of females in sales and office occupations:
Here: 21.4% city: 23.3%
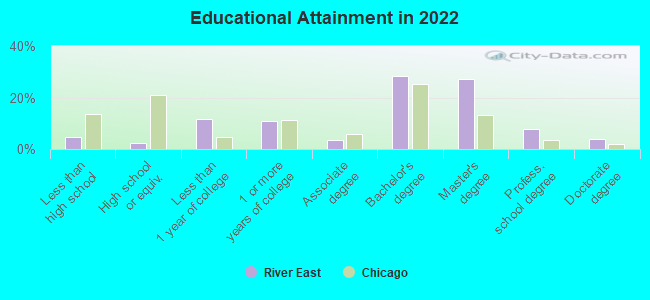
Education in this neighborhood (subdivision or community):
- Percentage of people 3 years and older in K-12 schools:
River East: 11.2% Chicago: 14.6%
- Percentage of people 3 years and older in undergraduate colleges:
River East: 13.2% Chicago: 5.1%
- Percentage of people 3 years and older in grad. or professional schools:
River East: 26.9% Chicago: 2.6%
- Percentage of students K-12 enrolled in private schools:
River East: 88.8% Chicago: 15.6%
Percentage of population below poverty level:
| River East: | 9.2% |
| Chicago: | 17.2% |
Median year owner moved in (as recorded in 2022):
Median year renter moved in (as recorded in 2022):
| River East: | 2010 |
| Chicago: | 2010 |
Median year renter moved in (as recorded in 2022):
| River East: | 2018 |
| Chicago: | 2020 |
Percentage of married-couple families with both working:
| River East: | 132.0% |
| Chicago: | 69.2% |
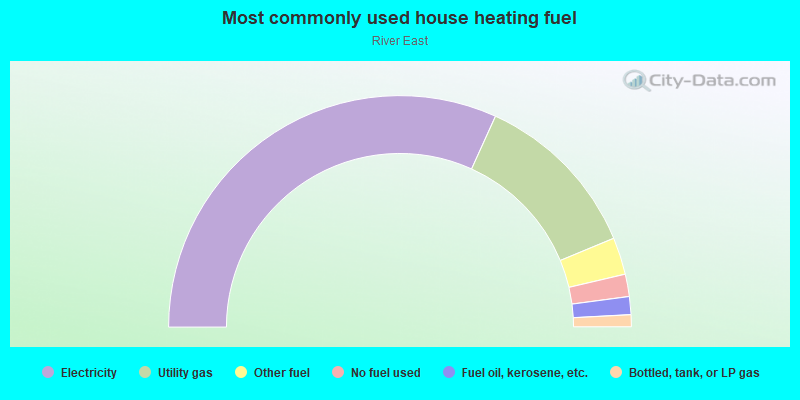
- 63.5%Electricity
- 23.9%Utility gas
- 5.2%Other fuel
- 3.1%No fuel used
- 2.5%Fuel oil, kerosene, etc.
- 1.7%Bottled, tank, or LP gas
Highways in this neighborhood:
US Hwy 41 (N Lake Shore Dr)
Length: 0.76 miles
Directions: E-W, N-S, SE-NW
Address range: 549 to 828
Directions: E-W, N-S, SE-NW
Address range: 549 to 828
Roads and streets:
Park Dr
Length: 1.56 miles
Directions: E-W, N-S, SE-NW, SW-NE
Directions: E-W, N-S, SE-NW, SW-NE
E Ohio St
Length: 1.39 miles
Directions: E-W, SW-NE
Address range: 136 to 1011
Directions: E-W, SW-NE
Address range: 136 to 1011
E Ontario St
Length: 0.64 miles
Direction: E-W
Address range: 27 to 499
Direction: E-W
Address range: 27 to 499
E Erie St
Length: 0.61 miles
Direction: E-W
Address range: 130 to 499
Direction: E-W
Address range: 130 to 499
E Huron St
Length: 0.58 miles
Direction: E-W
Address range: 130 to 499
Direction: E-W
Address range: 130 to 499
E Superior St
Length: 0.54 miles
Direction: E-W
Address range: 130 to 499
Direction: E-W
Address range: 130 to 499
E Chicago Ave
Length: 0.50 miles
Direction: E-W
Address range: 135 to 499
Direction: E-W
Address range: 135 to 499
US Hwy 41 (Lake Shore Dr, US Hwy 41)
Length: 0.34 miles
Direction: SE-NW
Direction: SE-NW
N Fairbanks Ct
Length: 0.29 miles
Direction: N-S
Address range: 600 to 799
Direction: N-S
Address range: 600 to 799
N Michigan Ave
Length: 0.27 miles
Direction: N-S
Address range: 608 to 799
Direction: N-S
Address range: 608 to 799
N St Clair St
Length: 0.22 miles
Direction: N-S
Address range: 600 to 729
Direction: N-S
Address range: 600 to 729
E Pearson St
Length: 0.18 miles
Direction: E-W
Address range: 244 to 299
Direction: E-W
Address range: 244 to 299
N McClurg Ct (N Mc Clurg Ct)
Length: 0.17 miles
Direction: N-S
Address range: 600 to 699
Direction: N-S
Address range: 600 to 699
Michigan Ave
Length: 0.02 miles
Direction: N-S
Direction: N-S