Ruskin neighborhood in San Jose, California (CA), 95132 detailed profile
Settings
X

Business Search - 14 Million verified businesses
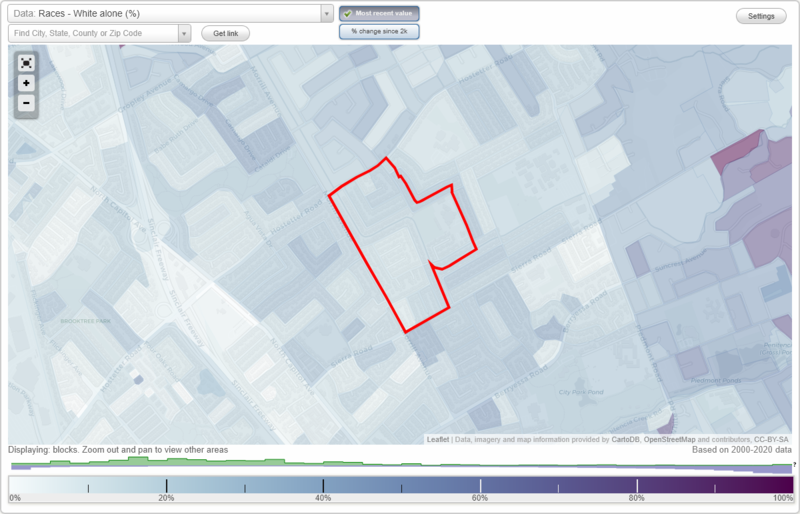
Area: 0.163 square miles
Population: 1,257
Population density:
| Ruskin: | 7,734 people per square mile |
| San Jose: | 5,554 people per square mile |

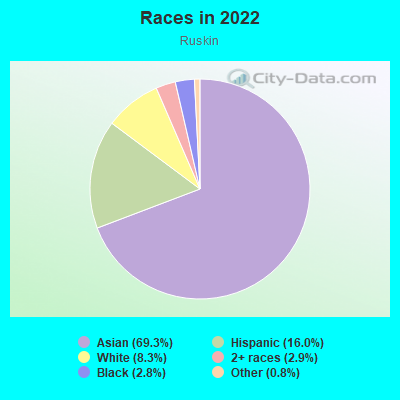
- 87269.3%Asian
- 20116.0%Hispanic or Latino
- 1048.3%White
- 362.9%Two or more races
- 352.8%Black
- 100.8%Some other race
Median household income in 2022:
| Ruskin: | $159,540 |
| San Jose: | $133,835 |
Distribution of median household income
![Distribution of median household income]()
- 32Less than $10,000
- 29$10,000 to $19,999
- 23$20,000 to $29,999
- 7$30,000 to $39,999
- 29$40,000 to $49,999
- 41$50,000 to $59,999
- 28$60,000 to $74,999
- 31$75,000 to $99,999
- 23$100,000 to $124,999
- 36$125,000 to $149,999
- 39$150,000 to $199,999
- 155$200,000 or more

Distribution of owner-occupied house/condo value
![Distribution of owner-occupied house/condo value]()
- 19Less than $50,000
- 4$50,000 to $99,999
- 21$100,000 to $149,999
- 2$150,000 to $199,999
- 2$300,000 to $399,999
- 5$400,000 to $499,999
- 8$500,000 to $749,999
- 16$750,000 to $999,999
- 190$1,000,000 or more

Distribution of rent paid by renters
![Distribution of rent paid by renters]()
- 1$400 to $499
- 15$1,250 to $1,499
- 13$1,500 to $1,999
- 73$2,000 or more

Median rent in 2022:
| Ruskin: | $2,628 |
| San Jose: | $2,001 |
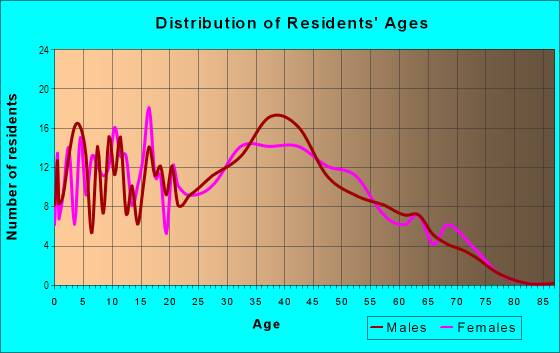
| Males: | 680 |
| Females: | 577 |
Males:
| This neighborhood: | 39.9 years |
| Whole city: | 37.6 years |
| This neighborhood: | 41.9 years |
| Whole city: | 39.1 years |
Average household size:
| Ruskin: | 3.5 people |
| San Jose: | 2.9 people |
Percentage of family households:
| Ruskin: | 50.2% |
| San Jose: | 49.9% |
| Here: | 73.0% |
| San Jose: | 53.0% |
Percentage of married-couple families with children (among all households):
| Ruskin: | 25.7% |
| San Jose: | 25.8% |
Percentage of single-mother households (among all households):
| Ruskin: | 5.7% |
| San Jose: | 5.2% |
Percentage of never married males 15 years old and over:
Percentage of never married females 15 years old and over:
| Ruskin: | 20.7% |
| San Jose: | 20.9% |
Percentage of never married females 15 years old and over:
| Ruskin: | 15.1% |
| city: | 16.7% |
Percentage of people that speak English not well or not at all:
| Ruskin: | 11.9% |
| San Jose: | 11.4% |
Percentage of people born in this state:
Percentage of people born in another U.S. state:
Percentage of native residents but born outside the U.S.:
Percentage of foreign born residents:
| Here: | 36.7% |
| San Jose: | 46.1% |
Percentage of people born in another U.S. state:
| Ruskin: | 10.5% |
| San Jose: | 10.4% |
Percentage of native residents but born outside the U.S.:
| Here: | 1.1% |
| city: | 1.7% |
Percentage of foreign born residents:
| Here: | 51.7% |
| San Jose: | 41.8% |
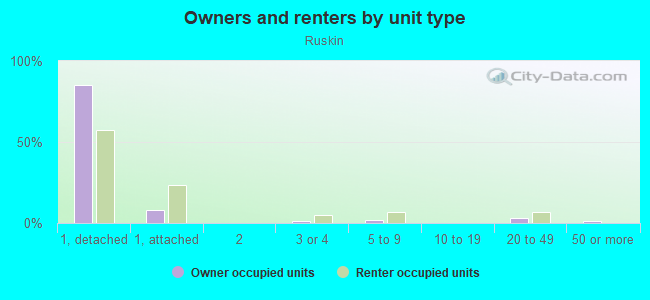
Owner-occupied
Renter-occupied

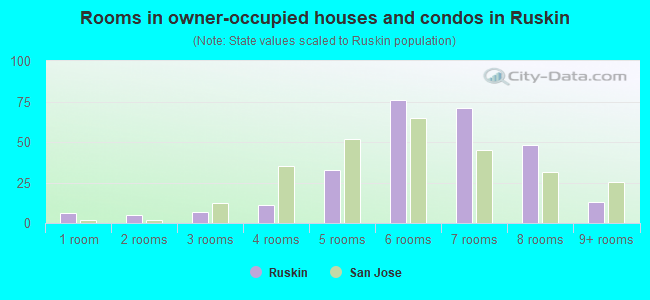
- Rooms in owner-occupied houses and condos in Ruskin
- 61 room
- 52 rooms
- 73 rooms
- 114 rooms
- 335 rooms
- 766 rooms
- 717 rooms
- 488 rooms
- 139+ rooms
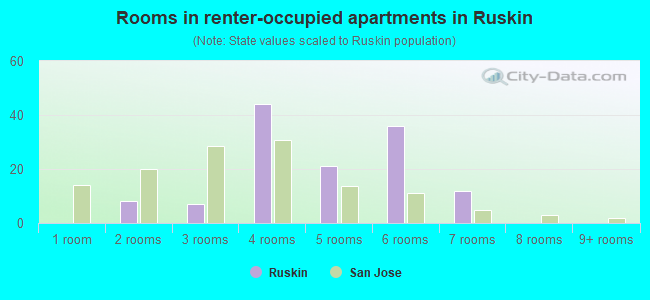
- Rooms in renter-occupied apartments in Ruskin
- 01 room
- 82 rooms
- 73 rooms
- 444 rooms
- 215 rooms
- 366 rooms
- 127 rooms
- 08 rooms
- 09+ rooms
Owner-occupied
Renter-occupied
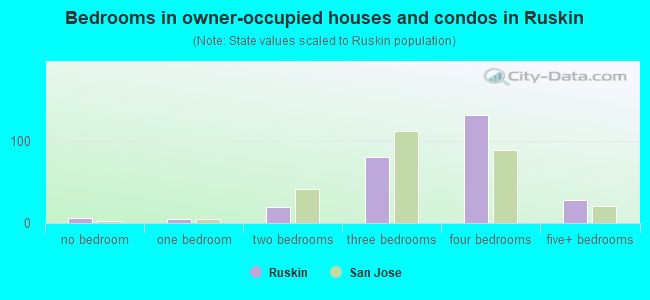
- Bedrooms in owner-occupied houses and condos in Ruskin
- 6no bedroom
- 51 bedroom
- 192 bedrooms
- 813 bedrooms
- 1324 bedrooms
- 285+ bedrooms
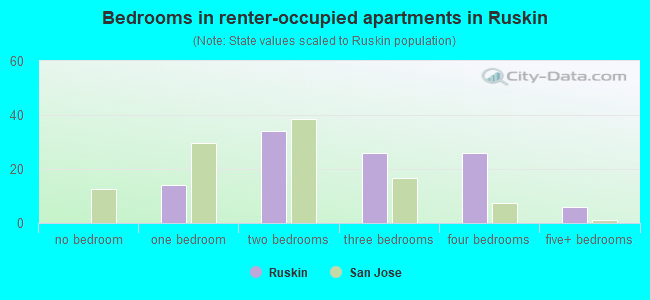
- Bedrooms in renter-occupied apartments in Ruskin
- 0no bedroom
- 141 bedroom
- 342 bedrooms
- 263 bedrooms
- 264 bedrooms
- 65+ bedrooms
Average number of cars or other vehicles available in houses/condos:
Average number of cars or other vehicles available in apartments:
| This neighborhood: | 2.3 |
| San Jose: | 2.3 |
Average number of cars or other vehicles available in apartments:
| Here: | 2.7 |
| city: | 1.6 |
Percentage of units with a mortgage:
| Ruskin: | 70.0% |
| San Jose: | 66.9% |
Average estimated value of detached houses in 2022 (100.0% of all units):
| Ruskin: | $1,383,202 |
| San Jose: | $1,532,815 |
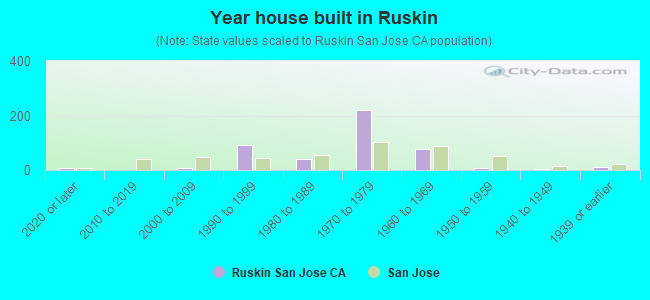
- Year house built in Ruskin
- 72020 or later
- 02010 to 2019
- 92000 to 2009
- 921990 to 1999
- 391980 to 1989
- 2201970 to 1979
- 761960 to 1969
- 91950 to 1959
- 41940 to 1949
- 121939 or earlier
City-data.com crime index for city in 2020 (higher means more crime):
| City: | 268.4 |
| U.S. average: | 219.5 |
Travel time to work (commute)
![Travel time to work (commute)]()
- 44Less than 5 minutes
- 145 to 9 minutes
- 1110 to 14 minutes
- 7215 to 19 minutes
- 9620 to 24 minutes
- 4725 to 29 minutes
- 10030 to 34 minutes
- 1335 to 39 minutes
- 3440 to 44 minutes
- 1545 to 59 minutes
- 4160 to 89 minutes
- 1890 or more minutes

Means of transportation to work
![Means of transportation to work]()
- 67.6%439Drove a car alone
- 3.4%22Carpooled
- 0.8%5Bus
- 4.5%29Subway or elevated rail
- 0.8%5Long-distance train or commuter rail
- 0.3%2Bicycle
- 5.2%34Walked
- 1.5%10Other means
- 22.5%146Worked at home

Time leaving home to go to work
![Time leaving home to go to work]()
- 812:00 a.m. to 4:59 a.m.
- 145:00 a.m. to 5:29 a.m.
- 135:30 a.m. to 5:59 a.m.
- 146:00 a.m. to 6:29 a.m.
- 96:30 a.m. to 6:59 a.m.
- 927:00 a.m. to 7:29 a.m.
- 407:30 a.m. to 7:59 a.m.
- 838:00 a.m. to 8:29 a.m.
- 658:30 a.m. to 8:59 a.m.
- 1009:00 a.m. to 9:59 a.m.
- 1410:00 a.m. to 10:59 a.m.
- 311:00 a.m. to 11:59 a.m.
- 4012:00 p.m. to 3:59 p.m.
- 254:00 p.m. to 11:59 p.m.

Occupations of males:
- Percentage of males in management occupations (except farmers):
Here: 8.7% city: 13.0%
- Percentage of males in business and financial operations occupations:
Here: 8.3% city: 4.6%
- Percentage of males in computer and mathematical occupations:
Here: 18.6% city: 13.6%
- Percentage of males in architecture and engineering occupations:
Here: 10.6% city: 10.2%
- Percentage of males in education, training, and library occupations:
Here: 2.1% city: 2.8%
- Percentage of males in service occupations:
Here: 14.8% city: 12.7%
- Percentage of males in sales and office occupations:
Here: 15.1% city: 12.8%
- Percentage of males in production occupations:
Here: 10.7% city: 5.5%
- Percentage of males in transportation occupations:
Here: 3.3% city: 3.6%
- Percentage of males in material moving occupations:
Here: 3.3% city: 3.1%
Occupations of females:
- Percentage of females in management occupations (except farmers):
Here: 11.5% city: 11.0%
- Percentage of females in business and financial operations occupations:
Here: 9.0% city: 8.6%
- Percentage of females in computer and mathematical occupations:
Here: 9.2% city: 5.4%
- Percentage of females in architecture and engineering occupations:
Here: 3.4% city: 2.8%
- Percentage of females in life, physical, and social science occupations:
Here: 2.4% city: 1.7%
- Percentage of females in education, training, and library occupations:
Here: 17.0% city: 8.1%
- Percentage of females in healthcare practitioners and technical occupations:
Here: 1.8% city: 6.8%
- Percentage of females in service occupations:
Here: 16.2% city: 21.7%
- Percentage of females in sales and office occupations:
Here: 18.9% city: 22.0%
- Percentage of females in production occupations:
Here: 6.1% city: 4.0%
- Percentage of females in material moving occupations:
Here: 3.4% city: 1.5%
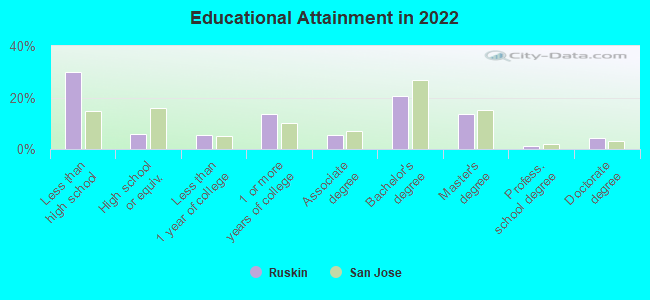
Education in this neighborhood (subdivision or community):
- Percentage of people 3 years and older in K-12 schools:
Ruskin: 19.7% San Jose: 16.1%
- Percentage of people 3 years and older in undergraduate colleges:
Ruskin: 7.2% San Jose: 6.5%
- Percentage of people 3 years and older in grad. or professional schools:
Ruskin: 2.1% San Jose: 2.0%
- Percentage of students K-12 enrolled in private schools:
Ruskin: 50.8% San Jose: 14.9%
Percentage of population below poverty level:
| Ruskin: | 5.2% |
| San Jose: | 9.0% |
Median year owner moved in (as recorded in 2022):
Median year renter moved in (as recorded in 2022):
| Ruskin: | 2005 |
| San Jose: | 2008 |
Median year renter moved in (as recorded in 2022):
| Ruskin: | 2015 |
| San Jose: | 2020 |
Percentage of married-couple families with both working:
| Ruskin: | 73.2% |
| San Jose: | 72.5% |
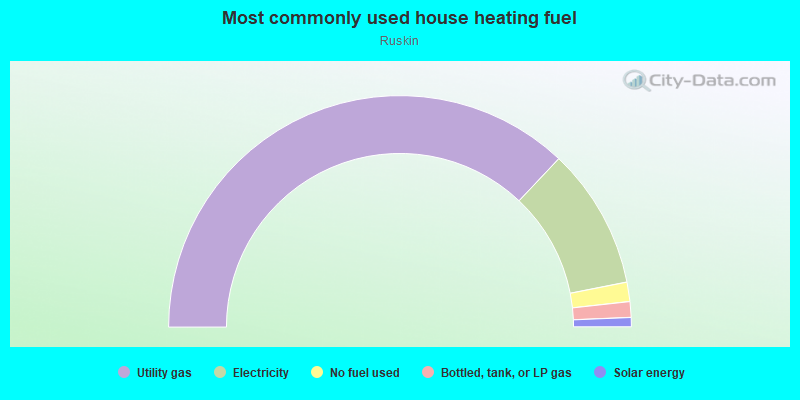
- 74.1%Utility gas
- 19.7%Electricity
- 2.7%No fuel used
- 2.2%Bottled, tank, or LP gas
- 1.3%Solar energy
Roads and streets:
Sierraville Ave
Length: 0.50 miles
Directions: E-W, SE-NW, SW-NE
Address range: 1400 to 1625
Directions: E-W, SE-NW, SW-NE
Address range: 1400 to 1625
Crater Ln
Length: 0.38 miles
Directions: E-W, SE-NW, SW-NE
Address range: 2900 to 3049
Directions: E-W, SE-NW, SW-NE
Address range: 2900 to 3049
Turlock Ln
Length: 0.20 miles
Direction: SE-NW
Address range: 1300 to 1499
Direction: SE-NW
Address range: 1300 to 1499
Turriff Way
Length: 0.19 miles
Directions: E-W, SE-NW, SW-NE
Address range: 1400 to 1499
Directions: E-W, SE-NW, SW-NE
Address range: 1400 to 1499
Tulare Dr
Length: 0.19 miles
Directions: E-W, SE-NW, SW-NE
Address range: 3000 to 3073
Directions: E-W, SE-NW, SW-NE
Address range: 3000 to 3073
Queens Crossing Dr
Length: 0.16 miles
Direction: SE-NW
Address range: 1400 to 1571
Direction: SE-NW
Address range: 1400 to 1571
Strauss Way
Length: 0.15 miles
Direction: SE-NW
Address range: 1300 to 1499
Direction: SE-NW
Address range: 1300 to 1499
Sierra Rd
Length: 0.14 miles
Directions: E-W, SW-NE
Address range: 2900 to 2961
Directions: E-W, SW-NE
Address range: 2900 to 2961
Mauna Loa Ct
Length: 0.12 miles
Directions: N-S, SE-NW, SW-NE
Address range: 3000 to 3099
Directions: N-S, SE-NW, SW-NE
Address range: 3000 to 3099
Ione Dr
Length: 0.12 miles
Directions: E-W, SW-NE
Address range: 2801 to 2899
Directions: E-W, SW-NE
Address range: 2801 to 2899
Bellini Ct
Length: 0.10 miles
Direction: SW-NE
Address range: 2800 to 2899
Direction: SW-NE
Address range: 2800 to 2899
Donizetti Ct
Length: 0.09 miles
Directions: E-W, SW-NE
Address range: 2800 to 2899
Directions: E-W, SW-NE
Address range: 2800 to 2899
Almanor Ct
Length: 0.09 miles
Direction: SE-NW
Address range: 1400 to 1499
Direction: SE-NW
Address range: 1400 to 1499
Scollon Ct
Length: 0.09 miles
Direction: SE-NW
Address range: 1400 to 1499
Direction: SE-NW
Address range: 1400 to 1499
Tantallon Ct
Length: 0.08 miles
Direction: SW-NE
Address range: 2900 to 2999
Direction: SW-NE
Address range: 2900 to 2999
Ferrel Ct
Length: 0.03 miles
Directions: N-S, SE-NW
Address range: 1300 to 1399
Directions: N-S, SE-NW
Address range: 1300 to 1399
Cutforth Ct
Length: 0.03 miles
Direction: SE-NW
Address range: 1300 to 1399
Direction: SE-NW
Address range: 1300 to 1399