San Rafael Hills neighborhood in Glendale, California (CA), 91208 detailed profile
Settings
X

Business Search - 14 Million verified businesses
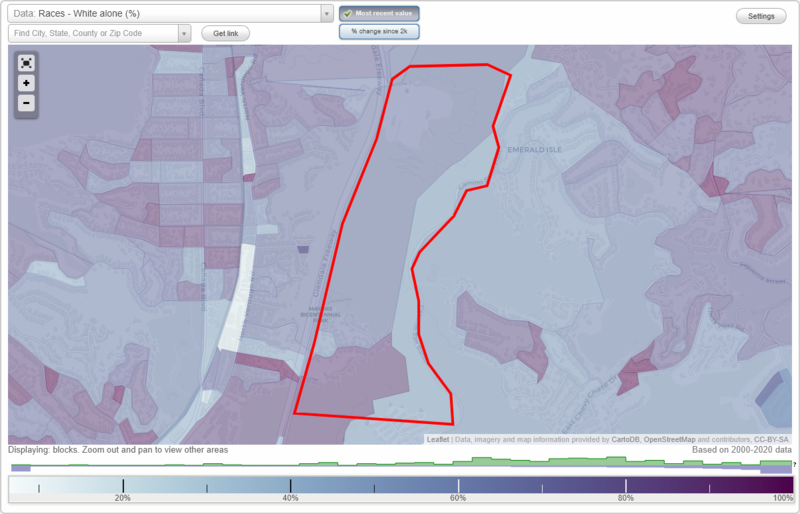
Area: 0.538 square miles
Population: 703
Population density:
| San Rafael Hills: | 1,306 people per square mile |
| Glendale: | 6,175 people per square mile |

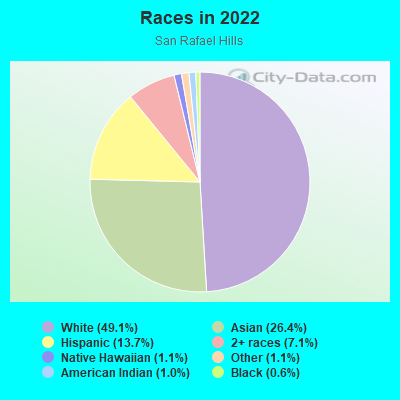
- 35449.1%White
- 19026.4%Asian
- 9913.7%Hispanic or Latino
- 517.1%Two or more races
- 81.1%Native Hawaiian and Other
Pacific Islander - 81.1%Some other race
- 71.0%American Indian
- 40.6%Black
Median household income in 2022:
| San Rafael Hills: | $212,866 |
| Glendale: | $77,483 |
Distribution of median household income
![Distribution of median household income]()
- 10Less than $10,000
- 8$10,000 to $19,999
- 18$20,000 to $29,999
- 14$30,000 to $39,999
- 16$40,000 to $49,999
- 26$50,000 to $59,999
- 9$60,000 to $74,999
- 13$75,000 to $99,999
- 25$100,000 to $124,999
- 18$125,000 to $149,999
- 61$150,000 to $199,999
- 97$200,000 or more

Distribution of owner-occupied house/condo value
![Distribution of owner-occupied house/condo value]()
- 1$100,000 to $149,999
- 2$300,000 to $399,999
- 3$400,000 to $499,999
- 8$500,000 to $749,999
- 29$750,000 to $999,999
- 201$1,000,000 or more

Distribution of rent paid by renters
![Distribution of rent paid by renters]()
- 8$1,000 to $1,249
- 7$1,250 to $1,499
- 29$1,500 to $1,999
- 51$2,000 or more

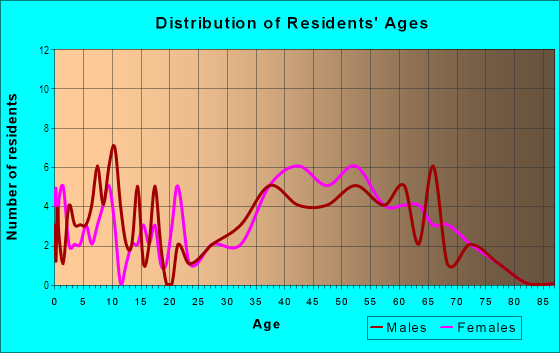
| Males: | 288 |
| Females: | 414 |
Males:
| This neighborhood: | 45.5 years |
| Whole city: | 41.8 years |
| This neighborhood: | 43.5 years |
| Whole city: | 43.4 years |
Average household size:
| San Rafael Hills: | 3.1 people |
| Glendale: | 2.5 people |
Percentage of family households:
| San Rafael Hills: | 37.3% |
| Glendale: | 40.0% |
| Here: | 59.2% |
| Glendale: | 44.2% |
Percentage of married-couple families with children (among all households):
| San Rafael Hills: | 36.9% |
| Glendale: | 30.5% |
Percentage of single-mother households (among all households):
| San Rafael Hills: | 3.2% |
| Glendale: | 7.0% |
Percentage of never married males 15 years old and over:
Percentage of never married females 15 years old and over:
| San Rafael Hills: | 12.5% |
| Glendale: | 18.4% |
Percentage of never married females 15 years old and over:
| San Rafael Hills: | 21.2% |
| city: | 18.3% |
Percentage of people that speak English not well or not at all:
| San Rafael Hills: | 5.3% |
| Glendale: | 12.5% |
Percentage of people born in this state:
Percentage of people born in another U.S. state:
Percentage of native residents but born outside the U.S.:
Percentage of foreign born residents:
| Here: | 54.7% |
| Glendale: | 38.0% |
Percentage of people born in another U.S. state:
| San Rafael Hills: | 15.5% |
| Glendale: | 11.6% |
Percentage of native residents but born outside the U.S.:
| Here: | 1.2% |
| city: | 1.5% |
Percentage of foreign born residents:
| Here: | 28.6% |
| Glendale: | 48.9% |
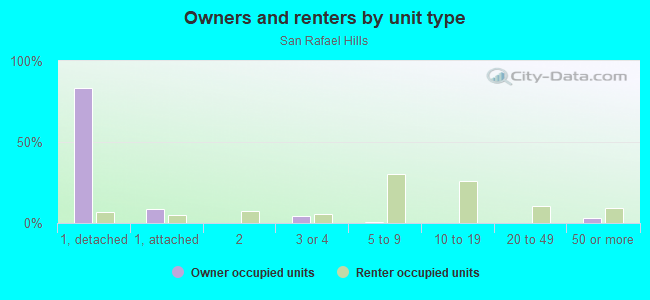
Owner-occupied
Renter-occupied

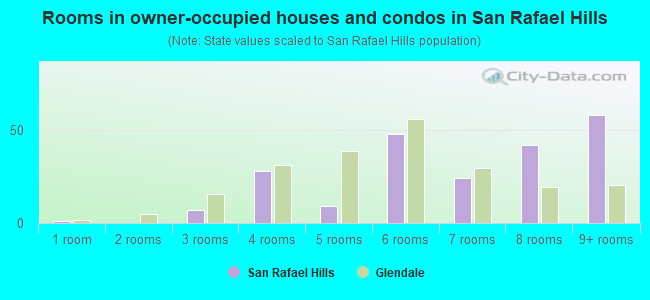
- Rooms in owner-occupied houses and condos in San Rafael Hills
- 11 room
- 02 rooms
- 73 rooms
- 284 rooms
- 95 rooms
- 486 rooms
- 247 rooms
- 428 rooms
- 589+ rooms
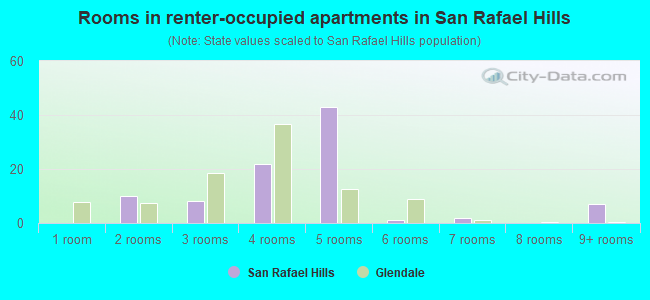
- Rooms in renter-occupied apartments in San Rafael Hills
- 01 room
- 102 rooms
- 83 rooms
- 224 rooms
- 435 rooms
- 16 rooms
- 27 rooms
- 08 rooms
- 79+ rooms
Owner-occupied
Renter-occupied
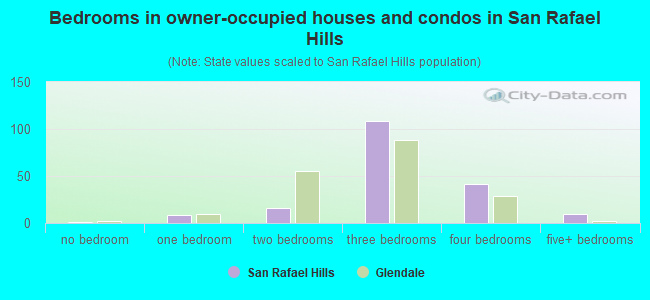
- Bedrooms in owner-occupied houses and condos in San Rafael Hills
- 1no bedroom
- 91 bedroom
- 162 bedrooms
- 1093 bedrooms
- 414 bedrooms
- 105+ bedrooms
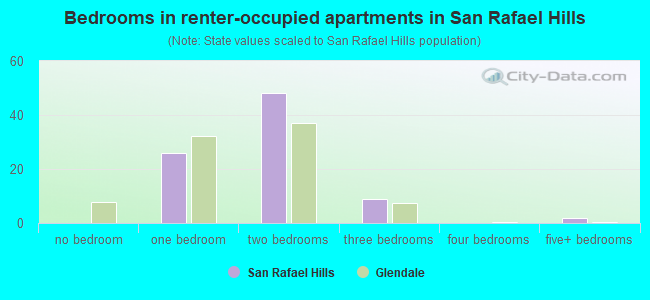
- Bedrooms in renter-occupied apartments in San Rafael Hills
- 0no bedroom
- 261 bedroom
- 482 bedrooms
- 93 bedrooms
- 04 bedrooms
- 25+ bedrooms
Average number of cars or other vehicles available in houses/condos:
Average number of cars or other vehicles available in apartments:
| This neighborhood: | 2.7 |
| Glendale: | 2.0 |
Average number of cars or other vehicles available in apartments:
| Here: | 1.3 |
| city: | 1.4 |
Percentage of units with a mortgage:
| San Rafael Hills: | 80.2% |
| Glendale: | 73.0% |
Average estimated value of detached houses in 2022 (73.2% of all units):
| San Rafael Hills: | $2,091,208 |
| Glendale: | $1,271,064 |
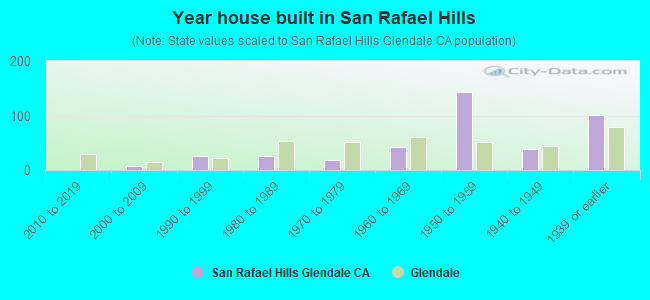
- Year house built in San Rafael Hills
- 02020 or later
- 02010 to 2019
- 82000 to 2009
- 261990 to 1999
- 251980 to 1989
- 191970 to 1979
- 421960 to 1969
- 1441950 to 1959
- 391940 to 1949
- 1011939 or earlier
City-data.com crime index for city in 2020 (higher means more crime):
| City: | 110.5 |
| U.S. average: | 219.5 |
Travel time to work (commute)
![Travel time to work (commute)]()
- 3Less than 5 minutes
- 175 to 9 minutes
- 2410 to 14 minutes
- 3515 to 19 minutes
- 5720 to 24 minutes
- 3225 to 29 minutes
- 4530 to 34 minutes
- 335 to 39 minutes
- 1640 to 44 minutes
- 945 to 59 minutes
- 2460 to 89 minutes
- 390 or more minutes

Means of transportation to work
![Means of transportation to work]()
- 63.7%282Drove a car alone
- 4.1%18Carpooled
- 1.1%5Bus
- 0.2%1Taxi
- 0.7%3Walked
- 0.2%1Other means
- 32.1%142Worked at home

Time leaving home to go to work
![Time leaving home to go to work]()
- 912:00 a.m. to 4:59 a.m.
- 75:00 a.m. to 5:29 a.m.
- 25:30 a.m. to 5:59 a.m.
- 76:00 a.m. to 6:29 a.m.
- 86:30 a.m. to 6:59 a.m.
- 407:00 a.m. to 7:29 a.m.
- 667:30 a.m. to 7:59 a.m.
- 548:00 a.m. to 8:29 a.m.
- 218:30 a.m. to 8:59 a.m.
- 369:00 a.m. to 9:59 a.m.
- 810:00 a.m. to 10:59 a.m.
- 511:00 a.m. to 11:59 a.m.
- 112:00 p.m. to 3:59 p.m.
- 94:00 p.m. to 11:59 p.m.

Occupations of males:
- Percentage of males in management occupations (except farmers):
Here: 19.4% city: 12.9%
- Percentage of males in business and financial operations occupations:
Here: 25.2% city: 4.8%
- Percentage of males in computer and mathematical occupations:
Here: 8.5% city: 5.2%
- Percentage of males in architecture and engineering occupations:
Here: 4.8% city: 4.1%
- Percentage of males in community and social services occupations:
Here: 3.3% city: 1.3%
- Percentage of males in arts, design, entertainment, sports, and media occupations:
Here: 4.1% city: 8.9%
- Percentage of males in healthcare practitioners and technical occupations:
Here: 14.8% city: 5.5%
- Percentage of males in sales and office occupations:
Here: 13.6% city: 18.3%
- Percentage of males in construction, extraction, and maintenance occupations:
Here: 9.2% city: 5.5%
- Percentage of males in production occupations:
Here: 1.7% city: 4.2%
- Percentage of males in material moving occupations:
Here: 2.9% city: 2.3%
Occupations of females:
- Percentage of females in management occupations (except farmers):
Here: 12.0% city: 10.3%
- Percentage of females in business and financial operations occupations:
Here: 3.3% city: 6.1%
- Percentage of females in computer and mathematical occupations:
Here: 1.1% city: 1.6%
- Percentage of females in architecture and engineering occupations:
Here: 11.1% city: 1.0%
- Percentage of females in legal occupations:
Here: 2.3% city: 2.6%
- Percentage of females in education, training, and library occupations:
Here: 7.6% city: 9.4%
- Percentage of females in arts, design, entertainment, sports, and media occupations:
Here: 11.1% city: 6.1%
- Percentage of females in healthcare practitioners and technical occupations:
Here: 27.3% city: 10.7%
- Percentage of females in service occupations:
Here: 3.5% city: 18.3%
- Percentage of females in sales and office occupations:
Here: 24.1% city: 26.5%
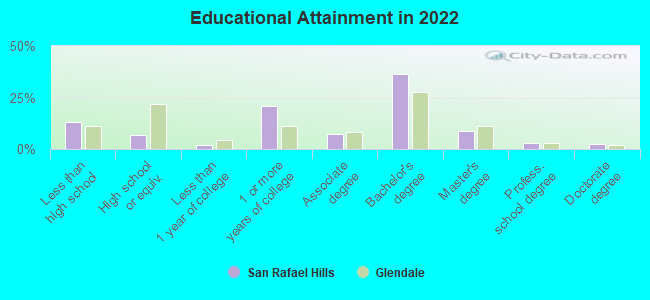
Education in this neighborhood (subdivision or community):
- Percentage of people 3 years and older in K-12 schools:
San Rafael Hills: 20.8% Glendale: 14.1%
- Percentage of people 3 years and older in undergraduate colleges:
San Rafael Hills: 9.8% Glendale: 5.2%
- Percentage of people 3 years and older in grad. or professional schools:
San Rafael Hills: 7.7% Glendale: 1.9%
- Percentage of students K-12 enrolled in private schools:
San Rafael Hills: 25.3% Glendale: 9.3%
Percentage of population below poverty level:
| San Rafael Hills: | 5.4% |
| Glendale: | 13.0% |
Median year owner moved in (as recorded in 2022):
| San Rafael Hills: | 2005 |
| Glendale: | 2007 |
Percentage of married-couple families with both working:
| San Rafael Hills: | 85.8% |
| Glendale: | 66.7% |
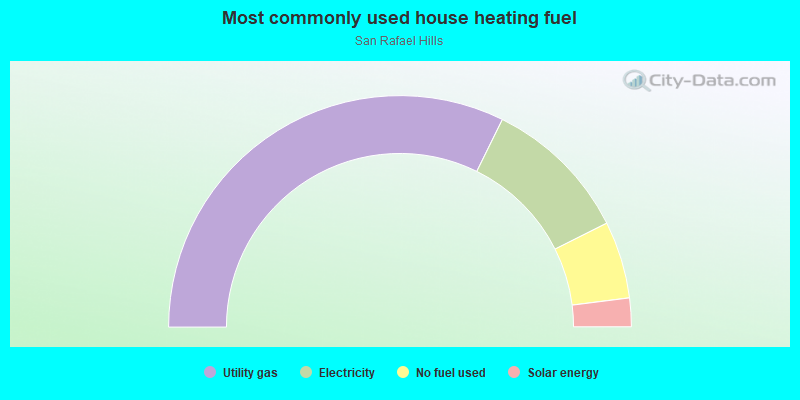
- 64.6%Utility gas
- 20.6%Electricity
- 10.8%No fuel used
- 4.0%Solar energy
Roads and streets:
Cam San Rafael
Length: 0.63 miles
Directions: E-W, N-S, SE-NW, SW-NE
Address range: 2100 to 2128
Directions: E-W, N-S, SE-NW, SW-NE
Address range: 2100 to 2128
Crestshire Dr
Length: 0.26 miles
Directions: E-W, SE-NW, SW-NE
Address range: 1900 to 1999
Directions: E-W, SE-NW, SW-NE
Address range: 1900 to 1999
Sherer Ln
Length: 0.22 miles
Directions: E-W, N-S, SE-NW, SW-NE
Address range: 1954 to 2099
Directions: E-W, N-S, SE-NW, SW-NE
Address range: 1954 to 2099
Virden Dr
Length: 0.20 miles
Directions: E-W, N-S, SW-NE
Address range: 1600 to 1699
Directions: E-W, N-S, SW-NE
Address range: 1600 to 1699
Hillfair Dr
Length: 0.16 miles
Directions: E-W, N-S, SE-NW
Address range: 1700 to 1799
Directions: E-W, N-S, SE-NW
Address range: 1700 to 1799
Cmt del Pilar
Length: 0.05 miles
Direction: SW-NE
Address range: 1900 to 1999
Direction: SW-NE
Address range: 1900 to 1999
Tambor Dr
Length: 0.03 miles
Directions: N-S, SE-NW
Address range: 1700 to 1799
Directions: N-S, SE-NW
Address range: 1700 to 1799
Pasa Glen Dr
Length: 0.02 miles
Direction: SE-NW
Address range: 2156 to 2299
Direction: SE-NW
Address range: 2156 to 2299
Other features:
Gladys Mtwy
Length: 1.11 miles
Directions: N-S, SW-NE
Directions: N-S, SW-NE