San Ramon neighborhood in San Jose, California (CA), 95111 detailed profile
Settings
X

Business Search - 14 Million verified businesses
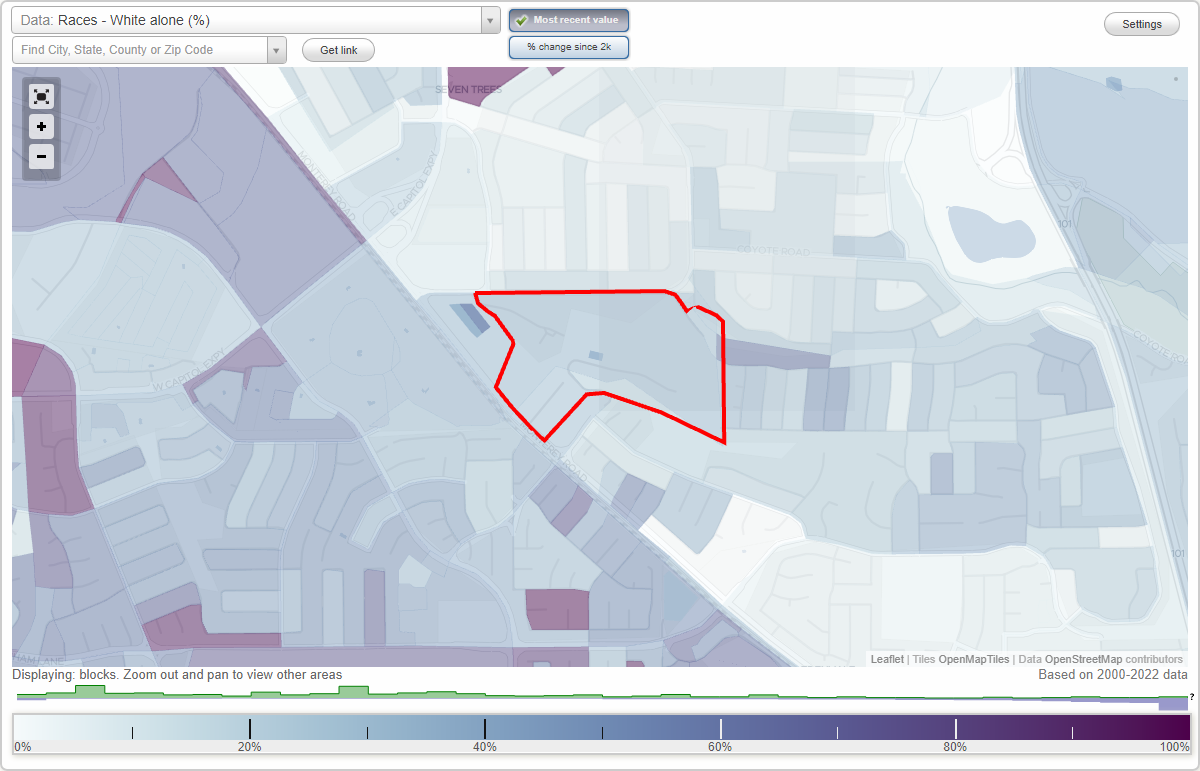
Area: 0.148 square miles
Population: 2,853
Population density:
| San Ramon: | 19,221 people per square mile |
| San Jose: | 5,554 people per square mile |

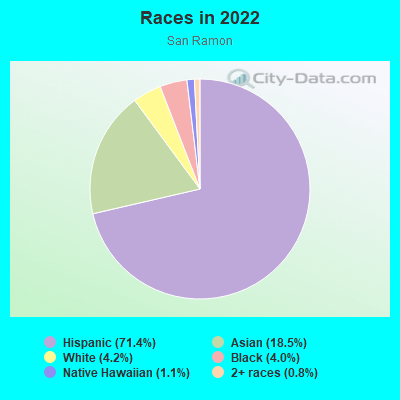
- 2,12271.4%Hispanic or Latino
- 54918.5%Asian
- 1264.2%White
- 1194.0%Black
- 321.1%Native Hawaiian and Other
Pacific Islander - 250.8%Two or more races
Median household income in 2022:
| San Ramon: | $78,550 |
| San Jose: | $133,835 |
Distribution of median household income
![Distribution of median household income]()
- 19Less than $10,000
- 165$10,000 to $19,999
- 217$20,000 to $29,999
- 172$30,000 to $39,999
- 90$40,000 to $49,999
- 55$50,000 to $59,999
- 126$60,000 to $74,999
- 135$75,000 to $99,999
- 27$100,000 to $124,999
- 28$125,000 to $149,999
- 26$150,000 to $199,999
- 25$200,000 or more

Distribution of owner-occupied house/condo value
![Distribution of owner-occupied house/condo value]()
- 42$500,000 to $749,999
- 127$750,000 to $999,999
- 8$1,000,000 or more

Distribution of rent paid by renters
![Distribution of rent paid by renters]()
- 19$100 to $199
- 101$300 to $399
- 19$400 to $499
- 23$600 to $699
- 18$700 to $799
- 116$1,000 to $1,249
- 354$1,250 to $1,499
- 244$1,500 to $1,999
- 164$2,000 or more

Median rent in 2022:
| San Ramon: | $1,606 |
| San Jose: | $2,001 |
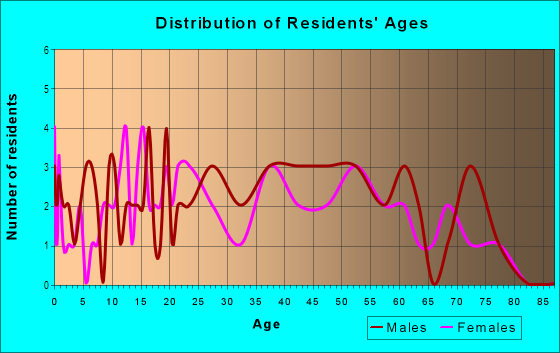
| Males: | 1,489 |
| Females: | 1,364 |
Males:
| This neighborhood: | 33.0 years |
| Whole city: | 37.6 years |
| This neighborhood: | 34.9 years |
| Whole city: | 39.1 years |
Average household size:
| San Ramon: | 4.7 people |
| San Jose: | 2.9 people |
Percentage of family households:
| San Ramon: | 65.1% |
| San Jose: | 49.9% |
| Here: | 41.8% |
| San Jose: | 53.0% |
Percentage of married-couple families with children (among all households):
| San Ramon: | 18.5% |
| San Jose: | 25.8% |
Percentage of single-mother households (among all households):
| San Ramon: | 8.8% |
| San Jose: | 5.2% |
Percentage of never married males 15 years old and over:
Percentage of never married females 15 years old and over:
| San Ramon: | 27.2% |
| San Jose: | 20.9% |
Percentage of never married females 15 years old and over:
| San Ramon: | 20.3% |
| city: | 16.7% |
Percentage of people that speak English not well or not at all:
| San Ramon: | 14.3% |
| San Jose: | 11.4% |
Percentage of people born in this state:
Percentage of people born in another U.S. state:
Percentage of native residents but born outside the U.S.:
Percentage of foreign born residents:
| Here: | 45.5% |
| San Jose: | 46.1% |
Percentage of people born in another U.S. state:
| San Ramon: | 3.1% |
| San Jose: | 10.4% |
Percentage of native residents but born outside the U.S.:
| Here: | 5.2% |
| city: | 1.7% |
Percentage of foreign born residents:
| Here: | 46.2% |
| San Jose: | 41.8% |
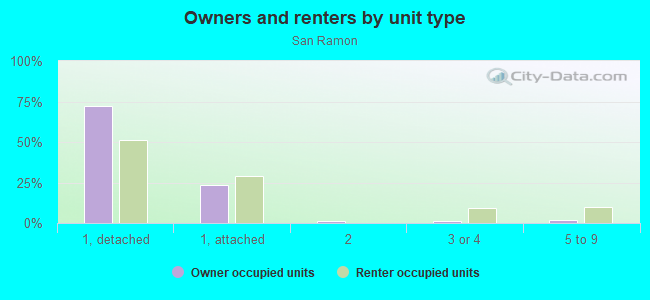
Owner-occupied
Renter-occupied

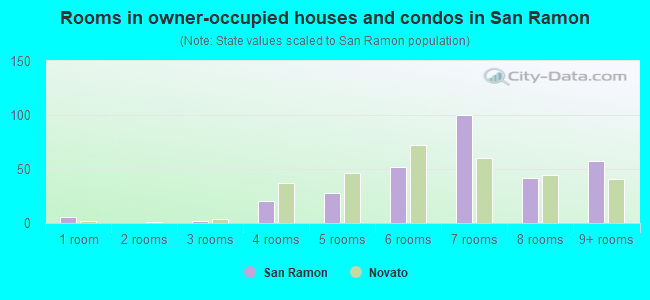
- Rooms in owner-occupied houses and condos in San Ramon
- 01 room
- 02 rooms
- 63 rooms
- 314 rooms
- 395 rooms
- 396 rooms
- 287 rooms
- 298 rooms
- 79+ rooms
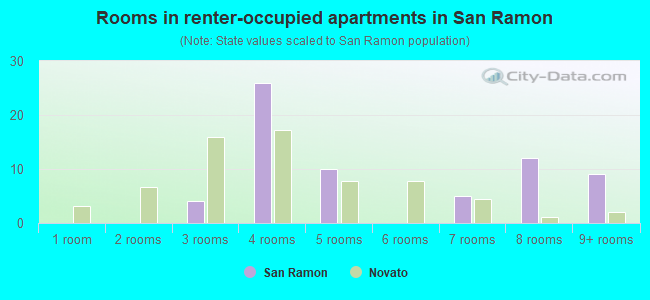
- Rooms in renter-occupied apartments in San Ramon
- 2711 room
- 1992 rooms
- 3253 rooms
- 2674 rooms
- 365 rooms
- 236 rooms
- 07 rooms
- 138 rooms
- 79+ rooms
Owner-occupied
Renter-occupied
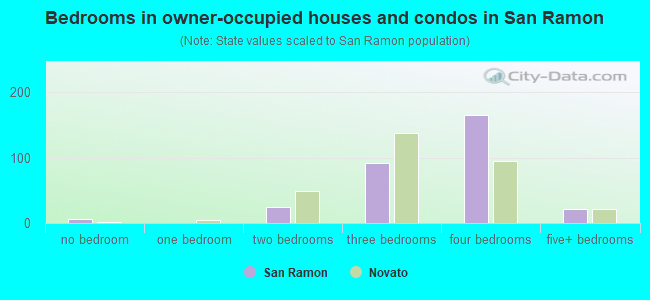
- Bedrooms in owner-occupied houses and condos in San Ramon
- 0no bedroom
- 01 bedroom
- 182 bedrooms
- 843 bedrooms
- 734 bedrooms
- 175+ bedrooms
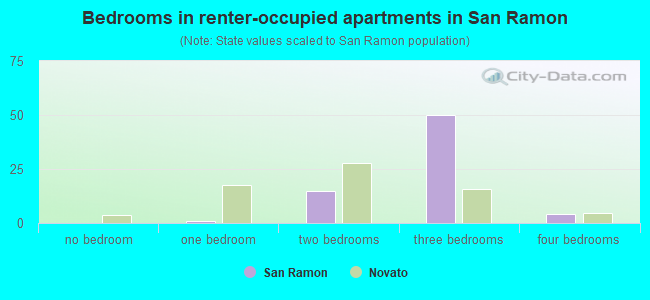
- Bedrooms in renter-occupied apartments in San Ramon
- 271no bedroom
- 4651 bedroom
- 3622 bedrooms
- 303 bedrooms
- 164 bedrooms
- 135+ bedrooms
Average number of cars or other vehicles available in houses/condos:
Average number of cars or other vehicles available in apartments:
| This neighborhood: | |
| San Jose: |
Average number of cars or other vehicles available in apartments:
| Here: | 1.4 |
| city: | 1.6 |
Percentage of units with a mortgage:
| San Ramon: | 52.2% |
| San Jose: | 66.9% |
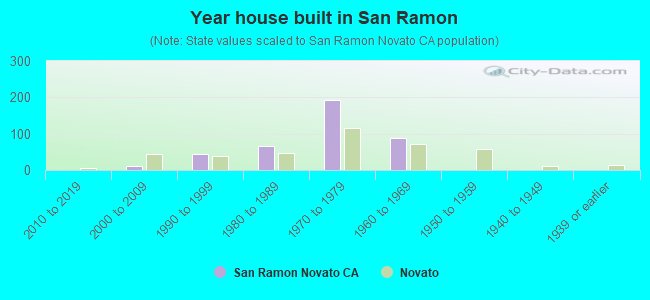
- Year house built in San Ramon
- 02020 or later
- 72010 to 2019
- 02000 to 2009
- 981990 to 1999
- 1871980 to 1989
- 5931970 to 1979
- 421960 to 1969
- 511950 to 1959
- 201940 to 1949
- 171939 or earlier
City-data.com crime index for city in 2020 (higher means more crime):
| City: | 268.4 |
| U.S. average: | 219.5 |
Travel time to work (commute)
![Travel time to work (commute)]()
- 11Less than 5 minutes
- 125 to 9 minutes
- 4310 to 14 minutes
- 15115 to 19 minutes
- 12720 to 24 minutes
- 4825 to 29 minutes
- 15230 to 34 minutes
- 1635 to 39 minutes
- 3640 to 44 minutes
- 8845 to 59 minutes
- 7360 to 89 minutes
- 2890 or more minutes

Means of transportation to work
![Means of transportation to work]()
- 72.4%813Drove a car alone
- 15.5%174Carpooled
- 4.4%49Bus
- 3.8%43Taxi
- 3.3%37Other means
- 2.1%24Worked at home

Time leaving home to go to work
![Time leaving home to go to work]()
- 3812:00 a.m. to 4:59 a.m.
- 705:00 a.m. to 5:29 a.m.
- 385:30 a.m. to 5:59 a.m.
- 1336:00 a.m. to 6:29 a.m.
- 826:30 a.m. to 6:59 a.m.
- 1117:00 a.m. to 7:29 a.m.
- 227:30 a.m. to 7:59 a.m.
- 1508:00 a.m. to 8:29 a.m.
- 178:30 a.m. to 8:59 a.m.
- 509:00 a.m. to 9:59 a.m.
- 1210:00 a.m. to 10:59 a.m.
- 3812:00 p.m. to 3:59 p.m.
- 404:00 p.m. to 11:59 p.m.

Occupations of males:
- Percentage of males in computer and mathematical occupations:
Here: 2.6% city: 13.6%
- Percentage of males in service occupations:
Here: 32.3% city: 12.7%
- Percentage of males in sales and office occupations:
Here: 5.9% city: 12.8%
- Percentage of males in construction, extraction, and maintenance occupations:
Here: 20.8% city: 7.8%
- Percentage of males in production occupations:
Here: 16.7% city: 5.5%
- Percentage of males in material moving occupations:
Here: 13.1% city: 3.1%
Occupations of females:
- Percentage of females in management occupations (except farmers):
Here: 2.2% city: 11.0%
- Percentage of females in business and financial operations occupations:
Here: 3.0% city: 8.6%
- Percentage of females in architecture and engineering occupations:
Here: 2.2% city: 2.8%
- Percentage of females in education, training, and library occupations:
Here: 2.7% city: 8.1%
- Percentage of females in healthcare practitioners and technical occupations:
Here: 4.8% city: 6.8%
- Percentage of females in service occupations:
Here: 55.2% city: 21.7%
- Percentage of females in sales and office occupations:
Here: 12.1% city: 22.0%
- Percentage of females in farming, fishing, and forestry occupations:
Here: 1.7% city: 0.2%
- Percentage of females in production occupations:
Here: 12.9% city: 4.0%
- Percentage of females in material moving occupations:
Here: 4.9% city: 1.5%
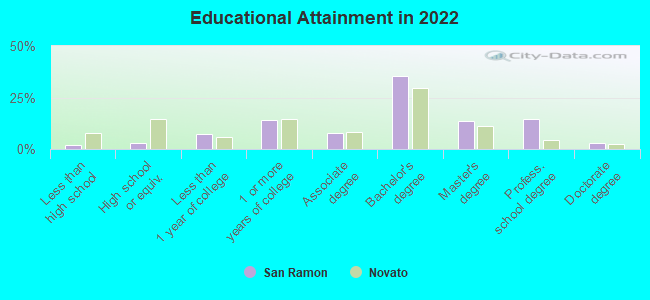
Education in this neighborhood (subdivision or community):
- Percentage of people 3 years and older in K-12 schools:
San Ramon: 27.9% San Jose: 16.1%
- Percentage of people 3 years and older in undergraduate colleges:
San Ramon: 5.6% San Jose: 6.5%
- Percentage of people 3 years and older in grad. or professional schools:
San Ramon: 0.8% San Jose: 2.0%
- Percentage of students K-12 enrolled in private schools:
San Ramon: 1.7% San Jose: 14.9%
Percentage of population below poverty level:
| San Ramon: | 11.8% |
| San Jose: | 9.0% |
Median year renter moved in (as recorded in 2022):
| San Ramon: | 2013 |
| San Jose: | 2020 |
Percentage of married-couple families with both working:
| San Ramon: | 54.6% |
| San Jose: | 72.5% |
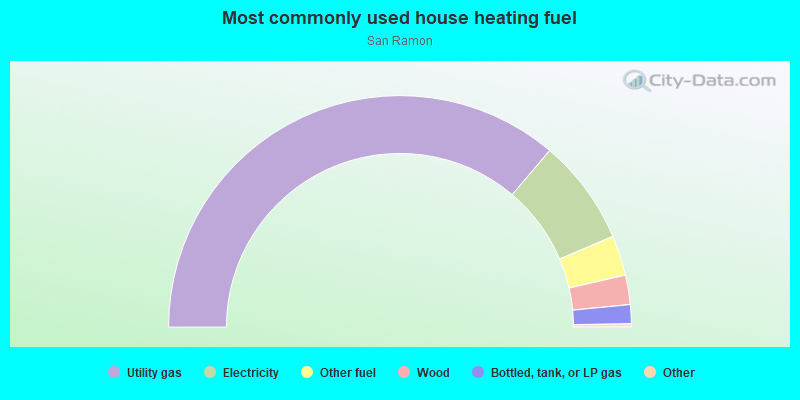
- 42.0%Utility gas
- 41.2%Electricity
- 10.4%Solar energy
- 6.4%No fuel used
Roads and streets:
River View Dr
Length: 0.17 miles
Directions: N-S, SE-NW
Address range: 301 to 365
Directions: N-S, SE-NW
Address range: 301 to 365
la Vista Dr
Length: 0.08 miles
Directions: E-W, N-S, SE-NW, SW-NE
Directions: E-W, N-S, SE-NW, SW-NE
San Ramon Dr
Length: 0.06 miles
Directions: E-W, SE-NW
Address range: 161 to 298
Directions: E-W, SE-NW
Address range: 161 to 298
Eva Ct
Length: 0.04 miles
Direction: SW-NE
Direction: SW-NE
Other features:
Base of Hl
Length: 0.10 miles
Directions: N-S, SE-NW
Directions: N-S, SE-NW