Sherwood Forest neighborhood in Irving, Texas (TX), 75061 detailed profile
Settings
X

Business Search - 14 Million verified businesses
Area: 0.426 square miles
Population: 2,541
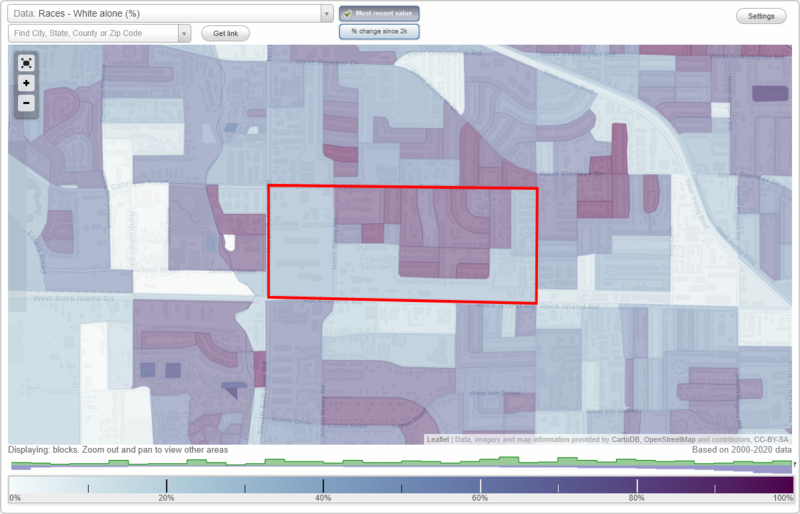
Population density:
| Sherwood Forest: | 5,968 people per square mile |
| Irving: | 3,789 people per square mile |

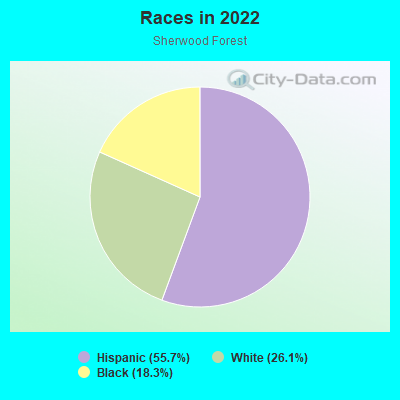
- 1,42454.7%Hispanic or Latino
- 70927.2%White
- 28010.8%Asian
- 1284.9%Black
- 542.1%Some other race
- 80.3%Two or more races
Median household income in 2022:
| Sherwood Forest: | $72,573 |
| Irving: | $78,326 |
Distribution of median household income
![Distribution of median household income]()
- 47Less than $10,000
- 70$10,000 to $19,999
- 108$20,000 to $29,999
- 46$30,000 to $39,999
- 112$40,000 to $49,999
- 73$50,000 to $59,999
- 79$60,000 to $74,999
- 105$75,000 to $99,999
- 66$100,000 to $124,999
- 21$125,000 to $149,999
- 162$150,000 to $199,999
- 70$200,000 or more

Distribution of owner-occupied house/condo value
![Distribution of owner-occupied house/condo value]()
- 31Less than $50,000
- 115$50,000 to $99,999
- 79$100,000 to $149,999
- 142$150,000 to $199,999
- 114$200,000 to $249,999
- 112$250,000 to $299,999
- 113$300,000 to $399,999
- 10$400,000 to $499,999
- 8$500,000 to $749,999

Distribution of rent paid by renters
![Distribution of rent paid by renters]()
- 4$100 to $199
- 9$400 to $499
- 43$700 to $799
- 33$800 to $899
- 65$900 to $999
- 49$1,000 to $1,249
- 119$1,250 to $1,499
- 123$1,500 to $1,999
- 19$2,000 or more

Median rent in 2022:
| Sherwood Forest: | $1,424 |
| Irving: | $1,332 |
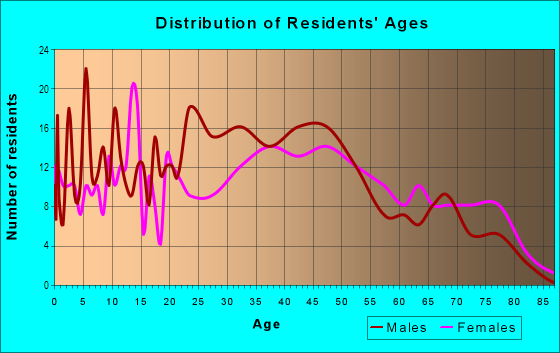
| Males: | 1,143 |
| Females: | 1,397 |
Males:
| This neighborhood: | 34.8 years |
| Whole city: | 32.4 years |
| This neighborhood: | 38.3 years |
| Whole city: | 34.0 years |
Average household size:
| Sherwood Forest: | 3.3 people |
| Irving: | 2.7 people |
Percentage of family households:
| Sherwood Forest: | 51.9% |
| Irving: | 52.1% |
| Here: | 59.2% |
| Irving: | 47.8% |
Percentage of married-couple families with children (among all households):
| Sherwood Forest: | 15.4% |
| Irving: | 27.5% |
Percentage of single-mother households (among all households):
| Sherwood Forest: | 6.5% |
| Irving: | 6.8% |
Percentage of never married males 15 years old and over:
Percentage of never married females 15 years old and over:
| Sherwood Forest: | 15.5% |
| Irving: | 20.1% |
Percentage of never married females 15 years old and over:
| Sherwood Forest: | 22.7% |
| city: | 17.9% |
Percentage of people that speak English not well or not at all:
| Sherwood Forest: | 25.6% |
| Irving: | 12.1% |
Percentage of people born in this state:
Percentage of people born in another U.S. state:
Percentage of native residents but born outside the U.S.:
Percentage of foreign born residents:
| Here: | 47.2% |
| Irving: | 40.5% |
Percentage of people born in another U.S. state:
| Sherwood Forest: | 10.2% |
| Irving: | 18.7% |
Percentage of native residents but born outside the U.S.:
| Here: | 1.4% |
| city: | 1.2% |
Percentage of foreign born residents:
| Here: | 41.1% |
| Irving: | 39.5% |
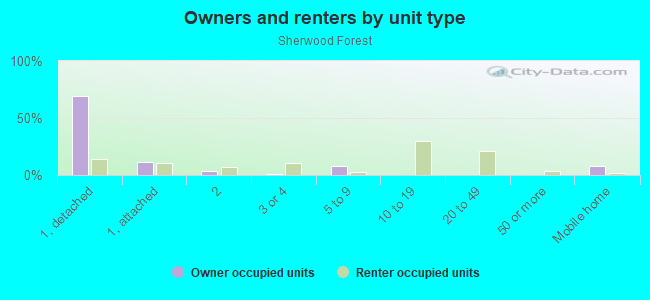
Owner-occupied
Renter-occupied

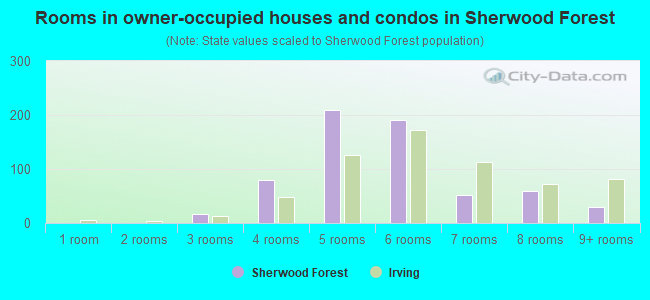
- Rooms in owner-occupied houses and condos in Sherwood Forest
- 01 room
- 02 rooms
- 173 rooms
- 794 rooms
- 2095 rooms
- 1906 rooms
- 527 rooms
- 598 rooms
- 309+ rooms
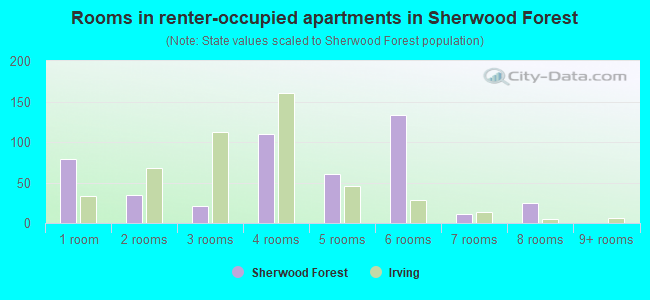
- Rooms in renter-occupied apartments in Sherwood Forest
- 791 room
- 342 rooms
- 213 rooms
- 1104 rooms
- 615 rooms
- 1336 rooms
- 117 rooms
- 258 rooms
- 09+ rooms
Owner-occupied
Renter-occupied
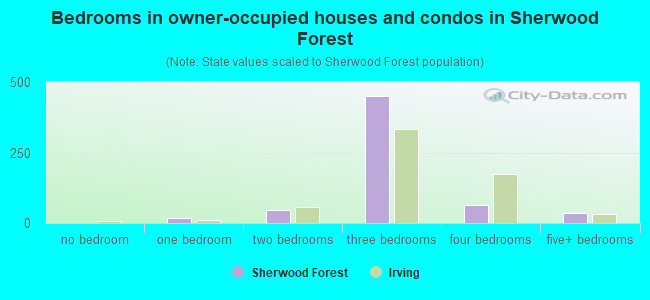
- Bedrooms in owner-occupied houses and condos in Sherwood Forest
- 0no bedroom
- 171 bedroom
- 472 bedrooms
- 4503 bedrooms
- 634 bedrooms
- 365+ bedrooms
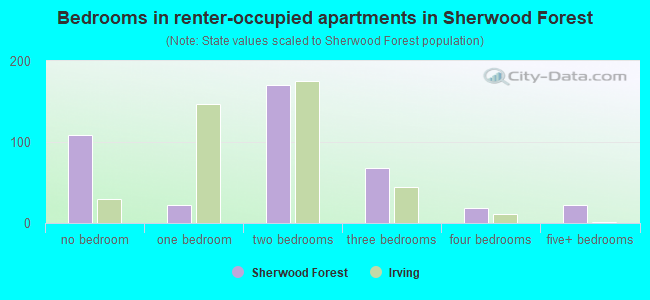
- Bedrooms in renter-occupied apartments in Sherwood Forest
- 109no bedroom
- 221 bedroom
- 1702 bedrooms
- 683 bedrooms
- 184 bedrooms
- 225+ bedrooms
Average number of cars or other vehicles available in houses/condos:
Average number of cars or other vehicles available in apartments:
| This neighborhood: | 2.5 |
| Irving: | 2.2 |
Average number of cars or other vehicles available in apartments:
| Here: | 1.8 |
| city: | 1.4 |
Percentage of units with a mortgage:
| Sherwood Forest: | 50.2% |
| Irving: | 55.5% |
Average estimated value of detached houses in 2022 (66.5% of all units):
| Sherwood Forest: | $176,294 |
| Texas: | $369,058 |
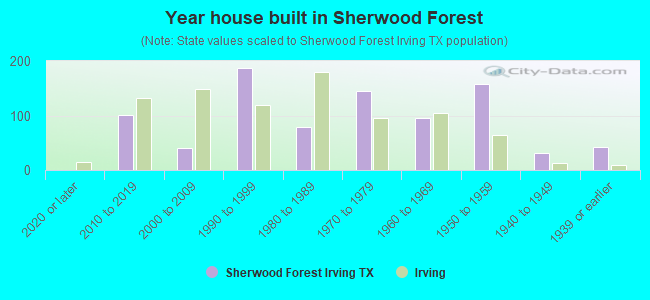
- Year house built in Sherwood Forest
- 02020 or later
- 1012010 to 2019
- 412000 to 2009
- 1871990 to 1999
- 791980 to 1989
- 1451970 to 1979
- 951960 to 1969
- 1581950 to 1959
- 321940 to 1949
- 421939 or earlier
City-data.com crime index for city in 2020 (higher means more crime):
| City: | 238.8 |
| U.S. average: | 219.5 |
Travel time to work (commute)
![Travel time to work (commute)]()
- 19Less than 5 minutes
- 315 to 9 minutes
- 8110 to 14 minutes
- 13315 to 19 minutes
- 17120 to 24 minutes
- 22625 to 29 minutes
- 10130 to 34 minutes
- 1435 to 39 minutes
- 1940 to 44 minutes
- 20045 to 59 minutes
- 5860 to 89 minutes
- 1590 or more minutes

Means of transportation to work
![Means of transportation to work]()
- 79.6%1,062Drove a car alone
- 11.8%157Carpooled
- 1.5%20Bus
- 2.6%35Long-distance train or commuter rail
- 1.4%19Bicycle
- 1.8%24Other means
- 5.5%73Worked at home

Time leaving home to go to work
![Time leaving home to go to work]()
- 3012:00 a.m. to 4:59 a.m.
- 1335:00 a.m. to 5:29 a.m.
- 795:30 a.m. to 5:59 a.m.
- 1246:00 a.m. to 6:29 a.m.
- 1216:30 a.m. to 6:59 a.m.
- 1507:00 a.m. to 7:29 a.m.
- 1107:30 a.m. to 7:59 a.m.
- 698:00 a.m. to 8:29 a.m.
- 608:30 a.m. to 8:59 a.m.
- 469:00 a.m. to 9:59 a.m.
- 5310:00 a.m. to 10:59 a.m.
- 311:00 a.m. to 11:59 a.m.
- 1212:00 p.m. to 3:59 p.m.
- 94:00 p.m. to 11:59 p.m.

Occupations of males:
- Percentage of males in management occupations (except farmers):
Here: 13.0% city: 8.6%
- Percentage of males in business and financial operations occupations:
Here: 2.1% city: 5.0%
- Percentage of males in arts, design, entertainment, sports, and media occupations:
Here: 8.4% city: 1.1%
- Percentage of males in service occupations:
Here: 5.0% city: 11.2%
- Percentage of males in sales and office occupations:
Here: 21.8% city: 14.4%
- Percentage of males in construction, extraction, and maintenance occupations:
Here: 14.4% city: 14.1%
- Percentage of males in production occupations:
Here: 4.4% city: 6.0%
- Percentage of males in transportation occupations:
Here: 14.8% city: 6.3%
- Percentage of males in material moving occupations:
Here: 2.9% city: 5.9%
Occupations of females:
- Percentage of females in management occupations (except farmers):
Here: 4.6% city: 8.1%
- Percentage of females in business and financial operations occupations:
Here: 1.5% city: 8.0%
- Percentage of females in life, physical, and social science occupations:
Here: 36.1% city: 0.7%
- Percentage of females in legal occupations:
Here: 3.0% city: 0.8%
- Percentage of females in education, training, and library occupations:
Here: 1.2% city: 6.7%
- Percentage of females in arts, design, entertainment, sports, and media occupations:
Here: 25.3% city: 1.9%
- Percentage of females in healthcare practitioners and technical occupations:
Here: 16.1% city: 7.1%
- Percentage of females in service occupations:
Here: 11.1% city: 19.6%
- Percentage of females in sales and office occupations:
Here: 35.1% city: 25.7%
- Percentage of females in production occupations:
Here: 16.8% city: 5.3%
- Percentage of females in material moving occupations:
Here: 9.3% city: 4.9%
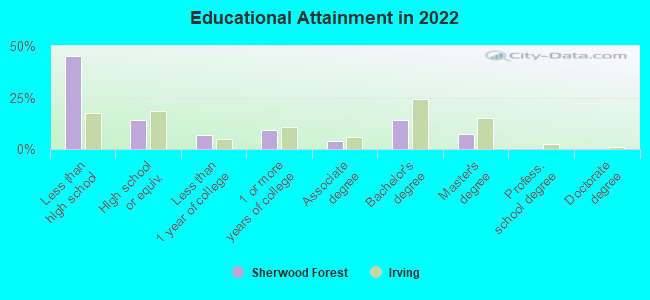
Education in this neighborhood (subdivision or community):
- Percentage of people 3 years and older in K-12 schools:
Sherwood Forest: 24.6% Irving: 19.3%
- Percentage of people 3 years and older in undergraduate colleges:
Sherwood Forest: 4.2% Irving: 4.4%
- Percentage of people 3 years and older in grad. or professional schools:
Sherwood Forest: 1.8% Irving: 1.7%
- Percentage of students K-12 enrolled in private schools:
Sherwood Forest: 9.4% Irving: 7.2%
Percentage of population below poverty level:
| Sherwood Forest: | 19.7% |
| Irving: | 11.3% |
Median year owner moved in (as recorded in 2022):
Median year renter moved in (as recorded in 2022):
| Sherwood Forest: | 2002 |
| Irving: | 2010 |
Median year renter moved in (as recorded in 2022):
| Sherwood Forest: | 2018 |
| Irving: | 2021 |
Percentage of married-couple families with both working:
| Sherwood Forest: | 131.0% |
| Irving: | 57.4% |
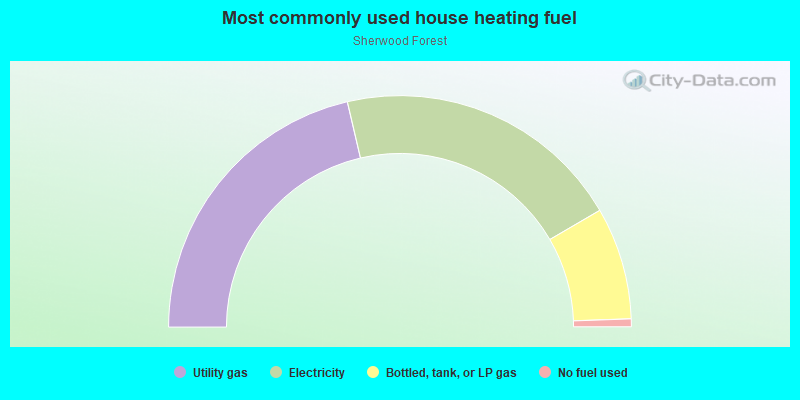
- 42.7%Utility gas
- 40.5%Electricity
- 15.7%Bottled, tank, or LP gas
- 1.1%No fuel used
Roads and streets:
Alan-A-Dale
Length: 0.42 miles
Directions: E-W, N-S, SE-NW, SW-NE
Address range: 2600 to 2899
Directions: E-W, N-S, SE-NW, SW-NE
Address range: 2600 to 2899
Yorkshire Dr
Length: 0.40 miles
Direction: E-W
Address range: 2600 to 2899
Direction: E-W
Address range: 2600 to 2899
N Briery Rd
Length: 0.34 miles
Direction: N-S
Address range: 100 to 499
Direction: N-S
Address range: 100 to 499
Linden Lea St
Length: 0.32 miles
Direction: E-W
Address range: 2800 to 2999
Direction: E-W
Address range: 2800 to 2999
Trent St
Length: 0.29 miles
Direction: E-W
Address range: 2900 to 3199
Direction: E-W
Address range: 2900 to 3199
Medina St
Length: 0.29 miles
Direction: E-W
Address range: 2836 to 3199
Direction: E-W
Address range: 2836 to 3199
Huntingdon Dr
Length: 0.27 miles
Direction: N-S
Address range: 200 to 511
Direction: N-S
Address range: 200 to 511
Parkside Ave
Length: 0.20 miles
Direction: E-W
Address range: 2400 to 2499
Direction: E-W
Address range: 2400 to 2499
Highland Park Dr
Length: 0.20 miles
Direction: N-S
Address range: 200 to 499
Direction: N-S
Address range: 200 to 499
Locksley Chase St
Length: 0.20 miles
Directions: E-W, N-S, SW-NE
Address range: 2600 to 2699
Directions: E-W, N-S, SW-NE
Address range: 2600 to 2699
King Richard St
Length: 0.18 miles
Direction: N-S
Address range: 200 to 399
Direction: N-S
Address range: 200 to 399
Lela St
Length: 0.15 miles
Direction: E-W
Address range: 3000 to 3199
Direction: E-W
Address range: 3000 to 3199
Robinhood Ln (Robin Hood Dr)
Length: 0.13 miles
Directions: E-W, SE-NW
Address range: 300 to 399
Directions: E-W, SE-NW
Address range: 300 to 399
Garden Oaks Dr
Length: 0.12 miles
Direction: E-W
Address range: 2400 to 2499
Direction: E-W
Address range: 2400 to 2499
Nottingham Dr
Length: 0.11 miles
Direction: N-S
Address range: 200 to 299
Direction: N-S
Address range: 200 to 299
Midland St
Length: 0.10 miles
Direction: N-S
Address range: 200 to 399
Direction: N-S
Address range: 200 to 399
Yorkshire St
Length: 0.09 miles
Direction: E-W
Address range: 2400 to 2899
Direction: E-W
Address range: 2400 to 2899
Lincoln St
Length: 0.08 miles
Direction: E-W
Address range: 2400 to 2499
Direction: E-W
Address range: 2400 to 2499
Staffordshire Dr
Length: 0.07 miles
Direction: N-S
Address range: 300 to 399
Direction: N-S
Address range: 300 to 399
Lincolnshire Dr
Length: 0.07 miles
Direction: N-S
Address range: 300 to 399
Direction: N-S
Address range: 300 to 399
Highland Park Ct
Length: 0.06 miles
Directions: E-W, N-S, SW-NE
Address range: 1 to 199
Directions: E-W, N-S, SW-NE
Address range: 1 to 199
Adams Ct
Length: 0.05 miles
Direction: E-W
Address range: 2400 to 2499
Direction: E-W
Address range: 2400 to 2499
Monroe Ct
Length: 0.05 miles
Direction: E-W
Address range: 2400 to 2499
Direction: E-W
Address range: 2400 to 2499
Huntingdon Ct
Length: 0.04 miles
Direction: E-W
Address range: 500 to 599
Direction: E-W
Address range: 500 to 599
Robinhood Ct
Length: 0.03 miles
Direction: SW-NE
Address range: 300 to 399
Direction: SW-NE
Address range: 300 to 399
Shelly Cir
Length: 0.03 miles
Direction: E-W
Address range: 300 to 399
Direction: E-W
Address range: 300 to 399
Keats Cir
Length: 0.03 miles
Direction: E-W
Address range: 400 to 499
Direction: E-W
Address range: 400 to 499
Surrey Cir
Length: 0.02 miles
Direction: E-W
Address range: 500 to 599
Direction: E-W
Address range: 500 to 599
Lincolnshire Ct
Length: 0.02 miles
Direction: E-W
Address range: 300 to 399
Direction: E-W
Address range: 300 to 399
Railroad features:
Chicago Rock Island and Pacific RR
Length: 0.90 miles
Direction: E-W
Direction: E-W
Other features:
Delaware Crk
Length: 0.36 miles
Directions: E-W, SE-NW
Directions: E-W, SE-NW