South Fort Des Moines neighborhood in Des Moines, Iowa (IA), 50315 detailed profile
Settings
X

Business Search - 14 Million verified businesses
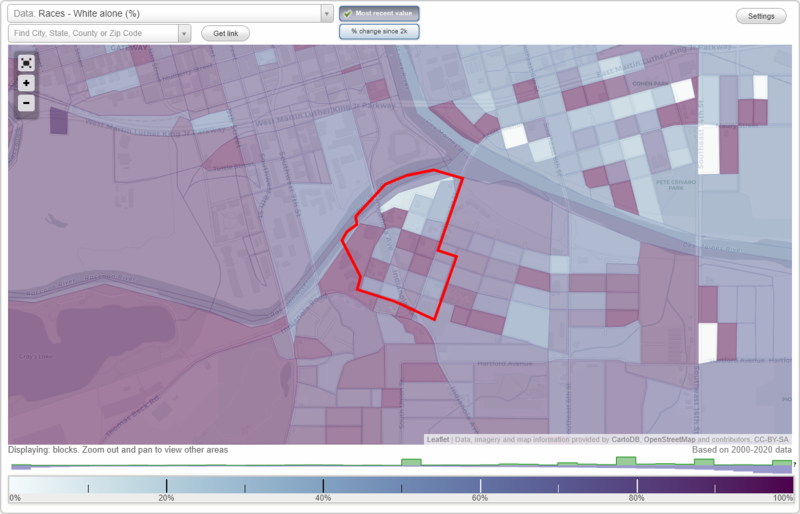
Area: 0.128 square miles
Population: 625
Population density:
| South Fort Des Moines: | 4,885 people per square mile |
| Des Moines: | 2,783 people per square mile |

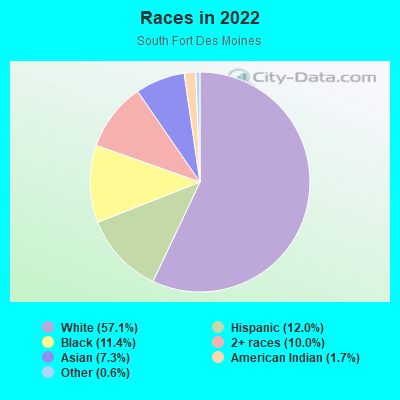
- 37757.1%White
- 7912.0%Hispanic or Latino
- 7511.4%Black
- 6610.0%Two or more races
- 487.3%Asian
- 111.7%American Indian
- 40.6%Some other race
Median household income in 2022:
| South Fort Des Moines: | $52,022 |
| Des Moines: | $58,018 |
Distribution of median household income
![Distribution of median household income]()
- 34Less than $10,000
- 35$10,000 to $19,999
- 28$20,000 to $29,999
- 38$30,000 to $39,999
- 26$40,000 to $49,999
- 25$50,000 to $59,999
- 54$60,000 to $74,999
- 34$75,000 to $99,999
- 17$100,000 to $124,999
- 5$125,000 to $149,999
- 43$200,000 or more

Distribution of owner-occupied house/condo value
![Distribution of owner-occupied house/condo value]()
- 3Less than $50,000
- 48$50,000 to $99,999
- 34$100,000 to $149,999
- 66$150,000 to $199,999
- 13$200,000 to $249,999
- 6$300,000 to $399,999
- 6$400,000 to $499,999

Distribution of rent paid by renters
![Distribution of rent paid by renters]()
- 5Less than $100
- 6$200 to $299
- 32$500 to $599
- 23$600 to $699
- 34$700 to $799
- 29$800 to $899
- 15$900 to $999
- 23$1,000 to $1,249
- 17$1,250 to $1,499
- 10$1,500 to $1,999

Median rent in 2022:
| South Fort Des Moines: | $820 |
| Des Moines: | $873 |
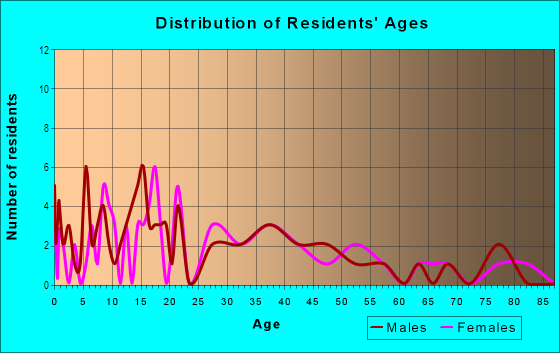
| Males: | 303 |
| Females: | 322 |
Males:
| This neighborhood: | 37.2 years |
| Whole city: | 34.7 years |
| This neighborhood: | 41.1 years |
| Whole city: | 35.5 years |
Average household size:
| South Fort Des Moines: | 1.9 people |
| Des Moines: | 2.2 people |
Percentage of family households:
| South Fort Des Moines: | 33.5% |
| Des Moines: | 40.8% |
| Here: | 23.1% |
| Des Moines: | 32.7% |
Percentage of married-couple families with children (among all households):
| South Fort Des Moines: | 18.7% |
| Des Moines: | 26.2% |
Percentage of single-mother households (among all households):
| South Fort Des Moines: | 26.4% |
| Des Moines: | 14.0% |
Percentage of never married males 15 years old and over:
Percentage of never married females 15 years old and over:
| South Fort Des Moines: | 24.5% |
| Des Moines: | 21.4% |
Percentage of never married females 15 years old and over:
| South Fort Des Moines: | 23.2% |
| city: | 19.3% |
Percentage of people that speak English not well or not at all:
| South Fort Des Moines: | 5.2% |
| Des Moines: | 5.0% |
Percentage of people born in this state:
Percentage of people born in another U.S. state:
Percentage of native residents but born outside the U.S.:
Percentage of foreign born residents:
| Here: | 67.2% |
| Des Moines: | 64.1% |
Percentage of people born in another U.S. state:
| South Fort Des Moines: | 19.0% |
| Des Moines: | 19.2% |
Percentage of native residents but born outside the U.S.:
| Here: | 0.2% |
| city: | 0.5% |
Percentage of foreign born residents:
| Here: | 13.6% |
| Des Moines: | 16.2% |
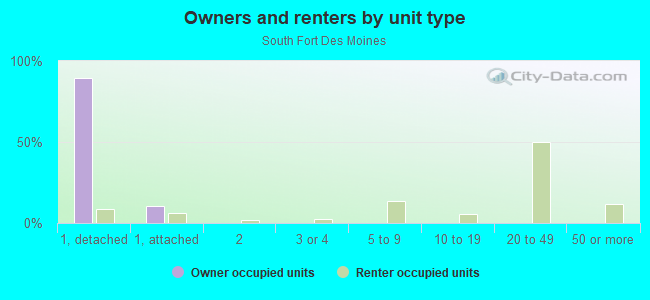
Owner-occupied
Renter-occupied

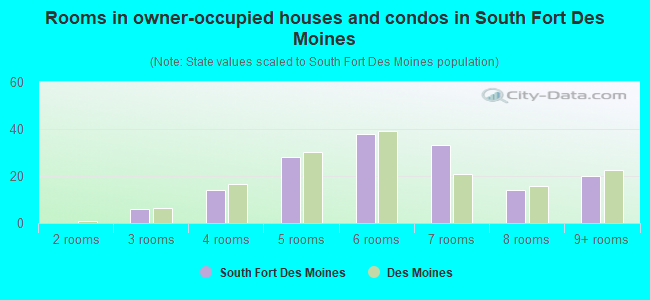
- Rooms in owner-occupied houses and condos in South Fort Des Moines
- 01 room
- 02 rooms
- 63 rooms
- 144 rooms
- 285 rooms
- 386 rooms
- 337 rooms
- 148 rooms
- 209+ rooms
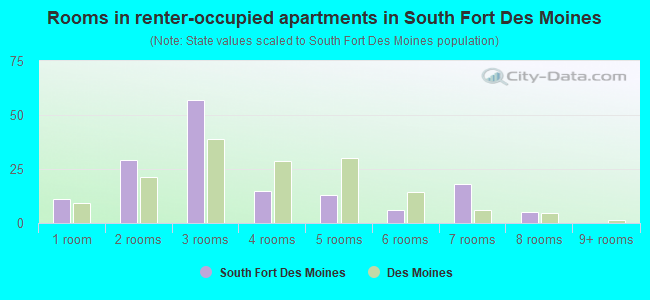
- Rooms in renter-occupied apartments in South Fort Des Moines
- 111 room
- 292 rooms
- 573 rooms
- 154 rooms
- 135 rooms
- 66 rooms
- 187 rooms
- 58 rooms
- 09+ rooms
Owner-occupied
Renter-occupied
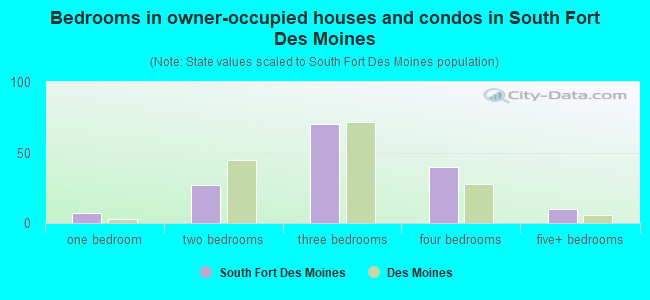
- Bedrooms in owner-occupied houses and condos in South Fort Des Moines
- 0no bedroom
- 71 bedroom
- 272 bedrooms
- 703 bedrooms
- 404 bedrooms
- 105+ bedrooms
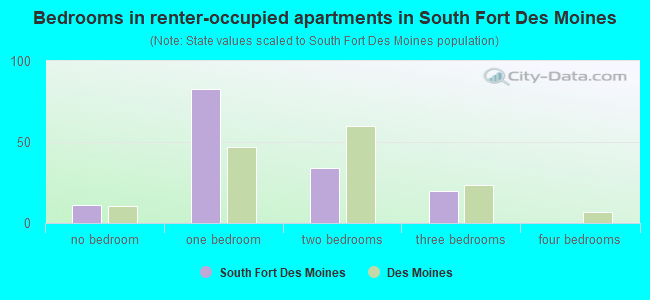
- Bedrooms in renter-occupied apartments in South Fort Des Moines
- 11no bedroom
- 831 bedroom
- 342 bedrooms
- 203 bedrooms
- 04 bedrooms
- 05+ bedrooms
Average number of cars or other vehicles available in houses/condos:
Average number of cars or other vehicles available in apartments:
| This neighborhood: | 1.6 |
| Des Moines: | 1.9 |
Average number of cars or other vehicles available in apartments:
| Here: | 1.2 |
| city: | 1.2 |
Percentage of units with a mortgage:
| South Fort Des Moines: | 71.5% |
| Des Moines: | 69.7% |
Average estimated value of detached houses in 2022 (54.0% of all units):
| South Fort Des Moines: | $128,063 |
| Des Moines: | $201,532 |
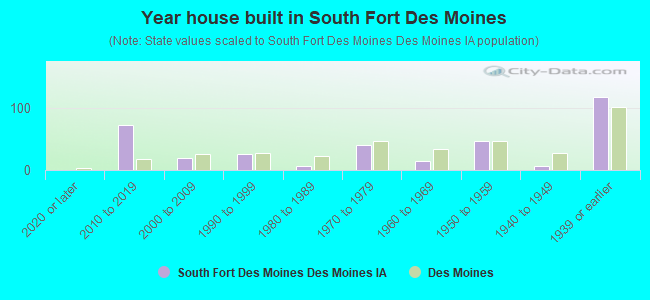
- Year house built in South Fort Des Moines
- 02020 or later
- 722010 to 2019
- 202000 to 2009
- 251990 to 1999
- 71980 to 1989
- 411970 to 1979
- 151960 to 1969
- 471950 to 1959
- 71940 to 1949
- 1171939 or earlier
City-data.com crime index for city in 2020 (higher means more crime):
| City: | 422.4 |
| U.S. average: | 219.5 |
Travel time to work (commute)
![Travel time to work (commute)]()
- 475 to 9 minutes
- 5510 to 14 minutes
- 4815 to 19 minutes
- 5920 to 24 minutes
- 1025 to 29 minutes
- 4330 to 34 minutes
- 935 to 39 minutes
- 140 to 44 minutes
- 1945 to 59 minutes
- 260 to 89 minutes
- 590 or more minutes

Means of transportation to work
![Means of transportation to work]()
- 65.2%215Drove a car alone
- 16.4%54Carpooled
- 0.3%1Bus
- 10.3%34Bicycle
- 10.9%36Worked at home

Time leaving home to go to work
![Time leaving home to go to work]()
- 2212:00 a.m. to 4:59 a.m.
- 55:00 a.m. to 5:29 a.m.
- 105:30 a.m. to 5:59 a.m.
- 196:00 a.m. to 6:29 a.m.
- 316:30 a.m. to 6:59 a.m.
- 537:00 a.m. to 7:29 a.m.
- 277:30 a.m. to 7:59 a.m.
- 288:00 a.m. to 8:29 a.m.
- 58:30 a.m. to 8:59 a.m.
- 229:00 a.m. to 9:59 a.m.
- 410:00 a.m. to 10:59 a.m.
- 311:00 a.m. to 11:59 a.m.
- 812:00 p.m. to 3:59 p.m.
- 554:00 p.m. to 11:59 p.m.

Occupations of males:
- Percentage of males in business and financial operations occupations:
Here: 2.4% city: 5.5%
- Percentage of males in computer and mathematical occupations:
Here: 3.2% city: 6.0%
- Percentage of males in architecture and engineering occupations:
Here: 1.5% city: 2.3%
- Percentage of males in education, training, and library occupations:
Here: 1.4% city: 2.1%
- Percentage of males in arts, design, entertainment, sports, and media occupations:
Here: 2.0% city: 1.6%
- Percentage of males in service occupations:
Here: 11.1% city: 13.1%
- Percentage of males in sales and office occupations:
Here: 12.9% city: 15.2%
- Percentage of males in construction, extraction, and maintenance occupations:
Here: 10.4% city: 10.0%
- Percentage of males in production occupations:
Here: 1.4% city: 9.9%
- Percentage of males in transportation occupations:
Here: 20.8% city: 6.3%
- Percentage of males in material moving occupations:
Here: 26.4% city: 7.2%
Occupations of females:
- Percentage of females in management occupations (except farmers):
Here: 5.8% city: 8.5%
- Percentage of females in business and financial operations occupations:
Here: 9.6% city: 7.3%
- Percentage of females in community and social services occupations:
Here: 7.7% city: 2.1%
- Percentage of females in legal occupations:
Here: 2.0% city: 1.3%
- Percentage of females in education, training, and library occupations:
Here: 1.3% city: 7.0%
- Percentage of females in arts, design, entertainment, sports, and media occupations:
Here: 3.0% city: 2.6%
- Percentage of females in healthcare practitioners and technical occupations:
Here: 7.0% city: 7.6%
- Percentage of females in service occupations:
Here: 12.1% city: 23.4%
- Percentage of females in sales and office occupations:
Here: 47.7% city: 27.7%
- Percentage of females in production occupations:
Here: 1.4% city: 5.0%
- Percentage of females in material moving occupations:
Here: 2.5% city: 2.1%
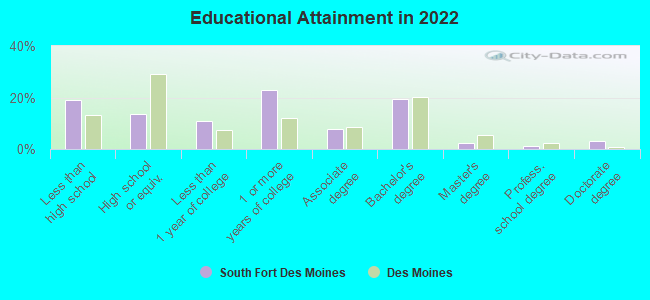
Education in this neighborhood (subdivision or community):
- Percentage of people 3 years and older in K-12 schools:
South Fort Des Moines: 18.6% Des Moines: 17.5%
- Percentage of people 3 years and older in undergraduate colleges:
South Fort Des Moines: 6.8% Des Moines: 3.7%
- Percentage of people 3 years and older in grad. or professional schools:
South Fort Des Moines: 2.9% Des Moines: 1.6%
- Percentage of students K-12 enrolled in private schools:
South Fort Des Moines: 0.0% Des Moines: 6.9%
Percentage of population below poverty level:
| South Fort Des Moines: | 10.9% |
| Des Moines: | 14.7% |
Median year owner moved in (as recorded in 2022):
Median year renter moved in (as recorded in 2022):
| South Fort Des Moines: | 2006 |
| Des Moines: | 2011 |
Median year renter moved in (as recorded in 2022):
| South Fort Des Moines: | 2018 |
| Des Moines: | 2020 |
Percentage of married-couple families with both working:
| South Fort Des Moines: | 81.8% |
| Des Moines: | 73.4% |
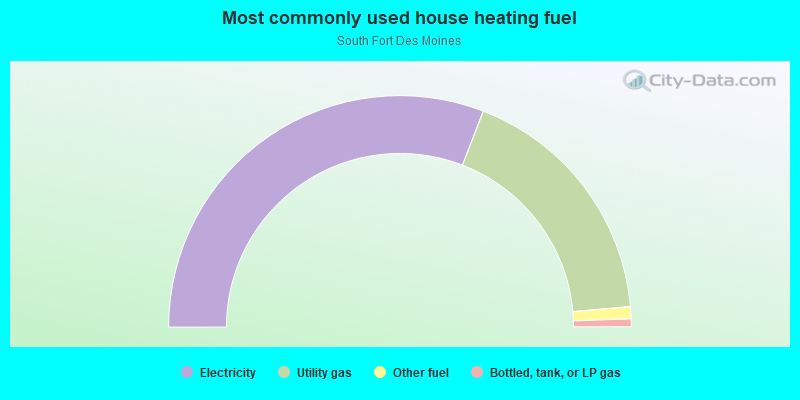
- 61.8%Electricity
- 35.5%Utility gas
- 1.7%Other fuel
- 1.1%Bottled, tank, or LP gas
Roads and streets:
SE 1st St
Length: 0.53 miles
Directions: N-S, SE-NW, SW-NE
Address range: 1300 to 1919
Directions: N-S, SE-NW, SW-NE
Address range: 1300 to 1919
S Union St
Length: 0.43 miles
Direction: SW-NE
Address range: 1300 to 1919
Direction: SW-NE
Address range: 1300 to 1919
SW 1st St
Length: 0.37 miles
Directions: N-S, SW-NE
Address range: 1400 to 1920
Directions: N-S, SW-NE
Address range: 1400 to 1920
Jackson Ave
Length: 0.27 miles
Direction: E-W
Address range: 1 to 299
Direction: E-W
Address range: 1 to 299
SW 2nd St
Length: 0.25 miles
Directions: N-S, SW-NE
Address range: 1500 to 1999
Directions: N-S, SW-NE
Address range: 1500 to 1999
Columbus Ave
Length: 0.18 miles
Directions: E-W, N-S, SE-NW, SW-NE
Address range: 1 to 199
Directions: E-W, N-S, SE-NW, SW-NE
Address range: 1 to 199
Edison Ave
Length: 0.17 miles
Direction: E-W
Address range: 1 to 199
Direction: E-W
Address range: 1 to 199
Dunham Ave
Length: 0.17 miles
Direction: E-W
Address range: 1 to 199
Direction: E-W
Address range: 1 to 199
E Edison Ave
Length: 0.17 miles
Direction: E-W
Address range: 1 to 199
Direction: E-W
Address range: 1 to 199
E Granger Ave
Length: 0.17 miles
Direction: E-W
Address range: 1 to 199
Direction: E-W
Address range: 1 to 199
E Dunham Ave
Length: 0.17 miles
Direction: E-W
Address range: 1 to 199
Direction: E-W
Address range: 1 to 199
Livingston Ave
Length: 0.16 miles
Direction: E-W
Address range: 1 to 199
Direction: E-W
Address range: 1 to 199
SE 2nd St
Length: 0.13 miles
Direction: SW-NE
Address range: 1700 to 1899
Direction: SW-NE
Address range: 1700 to 1899
Clay St
Length: 0.09 miles
Directions: E-W, SW-NE
Address range: 1 to 99
Directions: E-W, SW-NE
Address range: 1 to 99
E Jackson Ave
Length: 0.09 miles
Direction: E-W
Address range: 1 to 99
Direction: E-W
Address range: 1 to 99
Granger Ave
Length: 0.09 miles
Direction: E-W
Address range: 1 to 99
Direction: E-W
Address range: 1 to 99
E Columbus Ave
Length: 0.08 miles
Directions: E-W, SE-NW
Address range: 1 to 499
Directions: E-W, SE-NW
Address range: 1 to 499
E Livingston Ave
Length: 0.06 miles
Direction: E-W
Address range: 1 to 99
Direction: E-W
Address range: 1 to 99
Railroad features:
Abandoned RR
Length: 0.39 miles
Direction: SW-NE
Direction: SW-NE