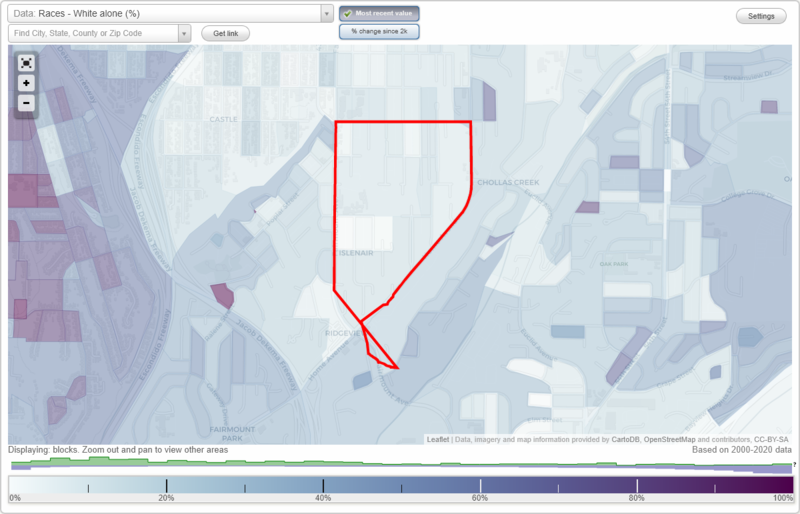
Swan Canyon neighborhood in San Diego, California (CA), 92105 detailed profile
Settings
X

Business Search - 14 Million verified businesses
Area: 0.296 square miles
Population: 3,111
Population density:
| Swan Canyon: | 10,497 people per square mile |
| San Diego: | 4,258 people per square mile |

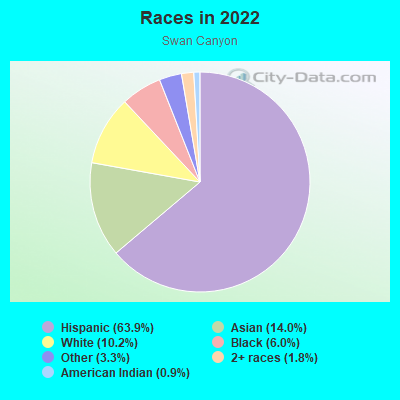
- 2,10063.9%Hispanic or Latino
- 46014.0%Asian
- 33510.2%White
- 1966.0%Black
- 1073.3%Some other race
- 601.8%Two or more races
- 300.9%American Indian
Distribution of median household income
![Distribution of median household income]()
- 55Less than $10,000
- 95$10,000 to $19,999
- 61$20,000 to $29,999
- 72$30,000 to $39,999
- 66$40,000 to $49,999
- 96$50,000 to $59,999
- 75$60,000 to $74,999
- 95$75,000 to $99,999
- 92$100,000 to $124,999
- 76$125,000 to $149,999
- 131$150,000 to $199,999
- 17$200,000 or more

Distribution of owner-occupied house/condo value
![Distribution of owner-occupied house/condo value]()
- 102Less than $50,000
- 44$50,000 to $99,999
- 6$150,000 to $199,999
- 48$200,000 to $249,999
- 111$250,000 to $299,999
- 31$300,000 to $399,999
- 57$400,000 to $499,999
- 71$500,000 to $749,999
- 18$750,000 to $999,999
- 25$1,000,000 or more

Distribution of rent paid by renters
![Distribution of rent paid by renters]()
- 9$300 to $399
- 50$400 to $499
- 9$500 to $599
- 107$700 to $799
- 42$800 to $899
- 29$900 to $999
- 61$1,000 to $1,249
- 100$1,250 to $1,499
- 341$1,500 to $1,999
- 167$2,000 or more

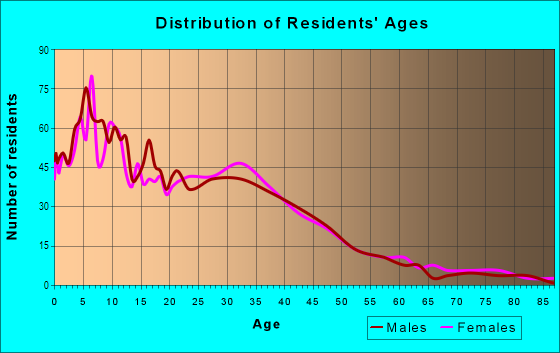
| Males: | 1,571 |
| Females: | 1,540 |
Males:
| This neighborhood: | 29.7 years |
| Whole city: | 35.4 years |
| This neighborhood: | 36.7 years |
| Whole city: | 37.2 years |
Average household size:
| Swan Canyon: | 8.4 people |
| San Diego: | 2.5 people |
Percentage of family households:
| Swan Canyon: | 55.7% |
| San Diego: | 41.7% |
| Here: | 30.5% |
| San Diego: | 43.2% |
Percentage of married-couple families with children (among all households):
| Swan Canyon: | 11.3% |
| San Diego: | 27.8% |
Percentage of single-mother households (among all households):
| Swan Canyon: | 13.2% |
| San Diego: | 7.9% |
Percentage of never married males 15 years old and over:
Percentage of never married females 15 years old and over:
| Swan Canyon: | 28.6% |
| San Diego: | 23.4% |
Percentage of never married females 15 years old and over:
| Swan Canyon: | 23.4% |
| city: | 18.8% |
Percentage of people that speak English not well or not at all:
| Swan Canyon: | 17.9% |
| San Diego: | 5.9% |
Percentage of people born in this state:
Percentage of people born in another U.S. state:
Percentage of native residents but born outside the U.S.:
Percentage of foreign born residents:
| Here: | 44.0% |
| San Diego: | 48.1% |
Percentage of people born in another U.S. state:
| Swan Canyon: | 16.0% |
| San Diego: | 24.9% |
Percentage of native residents but born outside the U.S.:
| Here: | 1.7% |
| city: | 2.4% |
Percentage of foreign born residents:
| Here: | 38.3% |
| San Diego: | 24.6% |
Owner-occupied
Renter-occupied

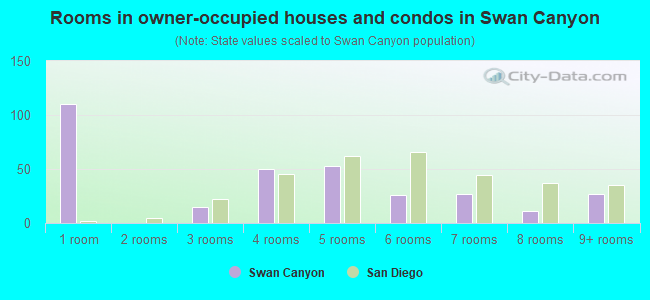
- Rooms in owner-occupied houses and condos in Swan Canyon
- 1101 room
- 02 rooms
- 153 rooms
- 504 rooms
- 535 rooms
- 266 rooms
- 277 rooms
- 118 rooms
- 279+ rooms
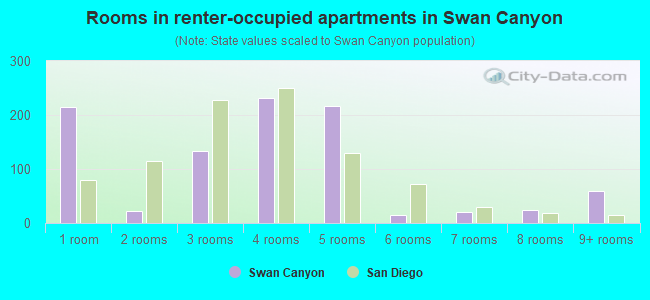
- Rooms in renter-occupied apartments in Swan Canyon
- 2151 room
- 232 rooms
- 1333 rooms
- 2324 rooms
- 2175 rooms
- 146 rooms
- 217 rooms
- 248 rooms
- 609+ rooms
Owner-occupied
Renter-occupied
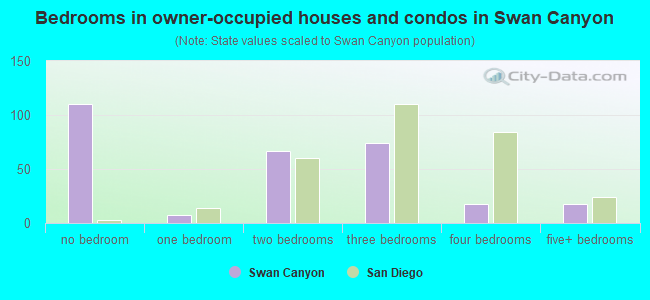
- Bedrooms in owner-occupied houses and condos in Swan Canyon
- 110no bedroom
- 71 bedroom
- 672 bedrooms
- 743 bedrooms
- 184 bedrooms
- 185+ bedrooms
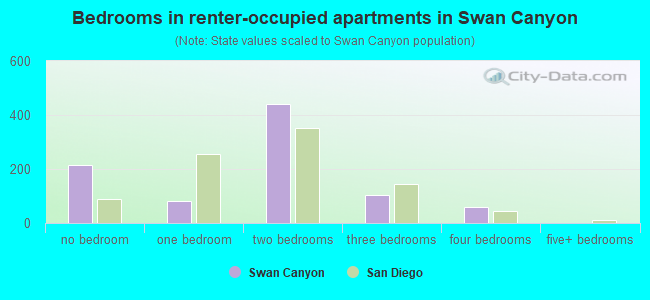
- Bedrooms in renter-occupied apartments in Swan Canyon
- 215no bedroom
- 821 bedroom
- 4412 bedrooms
- 1033 bedrooms
- 604 bedrooms
- 05+ bedrooms
Average number of cars or other vehicles available in houses/condos:
Average number of cars or other vehicles available in apartments:
| This neighborhood: | 2.3 |
| San Diego: | 2.1 |
Average number of cars or other vehicles available in apartments:
| Here: | 2.4 |
| city: | 1.6 |
Percentage of units with a mortgage:
| Swan Canyon: | 72.5% |
| San Diego: | 69.2% |
Housing prices:
- Average estimated value of detached houses in 2022 (41.9% of all units):
Swan Canyon: $551,234 San Diego: $1,227,596
- Average estimated value of townhouses or other attached units in 2022 (15.1% of all units):
This neighborhood: $406,168 city: $822,615
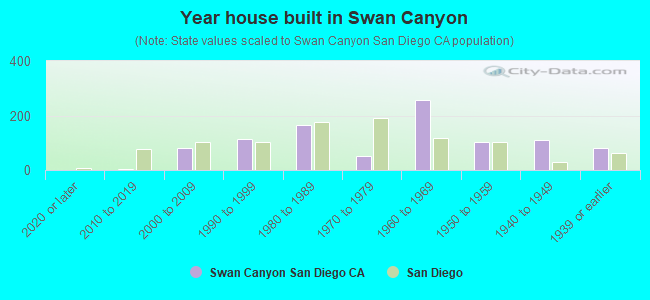
- Year house built in Swan Canyon
- 02020 or later
- 52010 to 2019
- 822000 to 2009
- 1141990 to 1999
- 1661980 to 1989
- 511970 to 1979
- 2571960 to 1969
- 1011950 to 1959
- 1111940 to 1949
- 821939 or earlier
City-data.com crime index for city in 2020 (higher means more crime):
| City: | 197.8 |
| U.S. average: | 219.5 |
Travel time to work (commute)
![Travel time to work (commute)]()
- 17Less than 5 minutes
- 55 to 9 minutes
- 25110 to 14 minutes
- 22715 to 19 minutes
- 27320 to 24 minutes
- 16125 to 29 minutes
- 23930 to 34 minutes
- 4335 to 39 minutes
- 3340 to 44 minutes
- 11045 to 59 minutes
- 1660 to 89 minutes
- 390 or more minutes

Means of transportation to work
![Means of transportation to work]()
- 59.1%971Drove a car alone
- 22.0%361Carpooled
- 2.1%34Bus
- 0.9%15Light rail, streetcar or trolley
- 0.4%7Motorcycle
- 0.7%11Bicycle
- 2.3%37Walked
- 4.9%81Other means
- 12.4%204Worked at home

Time leaving home to go to work
![Time leaving home to go to work]()
- 3412:00 a.m. to 4:59 a.m.
- 545:00 a.m. to 5:29 a.m.
- 585:30 a.m. to 5:59 a.m.
- 2626:00 a.m. to 6:29 a.m.
- 726:30 a.m. to 6:59 a.m.
- 1797:00 a.m. to 7:29 a.m.
- 507:30 a.m. to 7:59 a.m.
- 2218:00 a.m. to 8:29 a.m.
- 88:30 a.m. to 8:59 a.m.
- 639:00 a.m. to 9:59 a.m.
- 15310:00 a.m. to 10:59 a.m.
- 8011:00 a.m. to 11:59 a.m.
- 15212:00 p.m. to 3:59 p.m.
- 634:00 p.m. to 11:59 p.m.

Occupations of males:
- Percentage of males in management occupations (except farmers):
Here: 9.2% city: 12.7%
- Percentage of males in business and financial operations occupations:
Here: 4.6% city: 6.6%
- Percentage of males in computer and mathematical occupations:
Here: 2.3% city: 8.8%
- Percentage of males in community and social services occupations:
Here: 5.0% city: 1.0%
- Percentage of males in arts, design, entertainment, sports, and media occupations:
Here: 1.3% city: 2.9%
- Percentage of males in healthcare practitioners and technical occupations:
Here: 2.6% city: 3.8%
- Percentage of males in service occupations:
Here: 31.5% city: 14.6%
- Percentage of males in sales and office occupations:
Here: 8.0% city: 13.9%
- Percentage of males in construction, extraction, and maintenance occupations:
Here: 15.6% city: 5.9%
- Percentage of males in production occupations:
Here: 7.0% city: 4.6%
- Percentage of males in transportation occupations:
Here: 6.0% city: 3.9%
- Percentage of males in material moving occupations:
Here: 5.4% city: 3.3%
Occupations of females:
- Percentage of females in management occupations (except farmers):
Here: 1.5% city: 10.2%
- Percentage of females in community and social services occupations:
Here: 1.5% city: 2.5%
- Percentage of females in education, training, and library occupations:
Here: 9.8% city: 8.2%
- Percentage of females in arts, design, entertainment, sports, and media occupations:
Here: 5.3% city: 2.9%
- Percentage of females in service occupations:
Here: 36.0% city: 19.9%
- Percentage of females in sales and office occupations:
Here: 37.3% city: 22.0%
- Percentage of females in production occupations:
Here: 9.4% city: 2.8%
Percentage of people 16-64 in Armed Forces:
| Swan Canyon: | 0.4% |
| San Diego: | 4.0% |
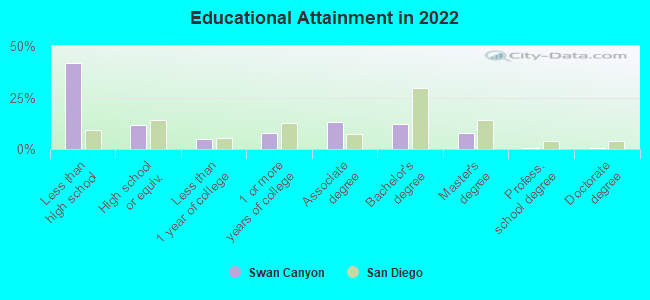
Education in this neighborhood (subdivision or community):
- Percentage of people 3 years and older in K-12 schools:
Swan Canyon: 24.5% San Diego: 13.8%
- Percentage of people 3 years and older in undergraduate colleges:
Swan Canyon: 11.9% San Diego: 8.5%
- Percentage of people 3 years and older in grad. or professional schools:
Swan Canyon: 5.4% San Diego: 2.3%
- Percentage of students K-12 enrolled in private schools:
Swan Canyon: 29.0% San Diego: 13.6%
Percentage of population below poverty level:
| Swan Canyon: | 23.0% |
| San Diego: | 11.3% |
Median year renter moved in (as recorded in 2022):
| Swan Canyon: | 2013 |
| San Diego: | 2020 |
Percentage of married-couple families with both working:
| Swan Canyon: | 78.2% |
| San Diego: | 66.0% |
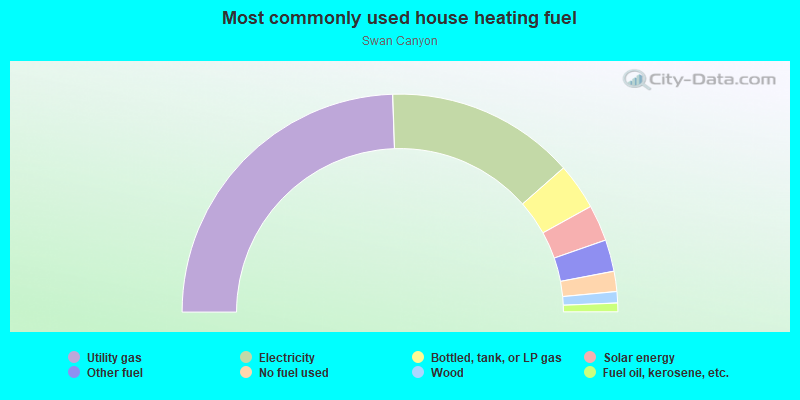
- 49.0%Utility gas
- 28.1%Electricity
- 6.9%Bottled, tank, or LP gas
- 5.4%Solar energy
- 4.7%Other fuel
- 3.0%No fuel used
- 1.7%Wood
- 1.3%Fuel oil, kerosene, etc.
Roads and streets:
Home Ave
Length: 0.70 miles
Directions: N-S, SW-NE
Address range: 4440 to 4899
Directions: N-S, SW-NE
Address range: 4440 to 4899
Redwood St
Length: 0.57 miles
Direction: E-W
Address range: 4350 to 4699
Direction: E-W
Address range: 4350 to 4699
Highland Ave
Length: 0.56 miles
Direction: N-S
Address range: 2400 to 2799
Direction: N-S
Address range: 2400 to 2799
45th St
Length: 0.52 miles
Direction: N-S
Address range: 2400 to 3099
Direction: N-S
Address range: 2400 to 3099
Quince St
Length: 0.49 miles
Direction: E-W
Address range: 4400 to 4699
Direction: E-W
Address range: 4400 to 4699
44th St
Length: 0.49 miles
Direction: N-S
Address range: 2400 to 3099
Direction: N-S
Address range: 2400 to 3099
46th St
Length: 0.43 miles
Direction: N-S
Address range: 2500 to 3099
Direction: N-S
Address range: 2500 to 3099
Olive St
Length: 0.34 miles
Direction: E-W
Address range: 4400 to 4650
Direction: E-W
Address range: 4400 to 4650
Menlo Ave
Length: 0.34 miles
Direction: N-S
Address range: 2600 to 3099
Direction: N-S
Address range: 2600 to 3099
47th St
Length: 0.26 miles
Directions: E-W, N-S, SE-NW
Address range: 2700 to 2999
Directions: E-W, N-S, SE-NW
Address range: 2700 to 2999
Maple St
Length: 0.25 miles
Direction: E-W
Address range: 4400 to 4499
Direction: E-W
Address range: 4400 to 4499
Laurel St
Length: 0.21 miles
Direction: E-W
Address range: 4400 to 4499
Direction: E-W
Address range: 4400 to 4499
Euclid Ave
Length: 0.19 miles
Direction: N-S
Address range: 3100 to 3297
Direction: N-S
Address range: 3100 to 3297
Chamoune Ave
Length: 0.15 miles
Direction: N-S
Address range: 2900 to 3099
Direction: N-S
Address range: 2900 to 3099
Roseview Pl
Length: 0.13 miles
Direction: N-S
Address range: 2500 to 2599
Direction: N-S
Address range: 2500 to 2599
Laurie Ln
Length: 0.11 miles
Direction: N-S
Address range: 2400 to 2499
Direction: N-S
Address range: 2400 to 2499