Terrace Estates neighborhood in Oxnard, California (CA), 93033 detailed profile
Settings
X

Business Search - 14 Million verified businesses
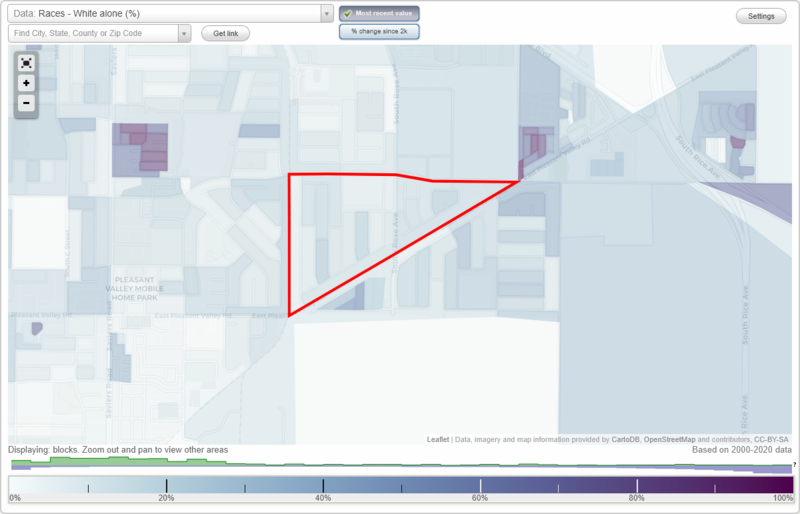
Area: 0.220 square miles
Population: 1,498
Population density:
| Terrace Estates: | 6,797 people per square mile |
| Oxnard: | 7,918 people per square mile |

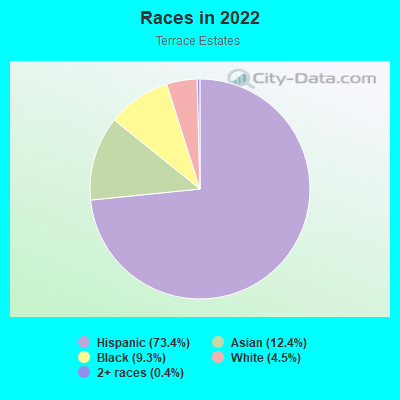
- 1,21173.4%Hispanic or Latino
- 20412.4%Asian
- 1539.3%Black
- 754.5%White
- 60.4%Two or more races
Distribution of median household income
![Distribution of median household income]()
- 24Less than $10,000
- 98$20,000 to $29,999
- 69$30,000 to $39,999
- 64$40,000 to $49,999
- 26$50,000 to $59,999
- 94$60,000 to $74,999
- 9$75,000 to $99,999
- 19$100,000 to $124,999
- 89$125,000 to $149,999
- 37$150,000 to $199,999
- 96$200,000 or more

Distribution of owner-occupied house/condo value
![Distribution of owner-occupied house/condo value]()
- 6$50,000 to $99,999
- 30$300,000 to $399,999
- 17$400,000 to $499,999
- 129$500,000 to $749,999
- 11$750,000 to $999,999

Distribution of rent paid by renters
![Distribution of rent paid by renters]()
- 29$400 to $499
- 30$1,000 to $1,249
- 24$1,250 to $1,499
- 26$1,500 to $1,999
- 25$2,000 or more

Median rent in 2022:
| Terrace Estates: | $1,761 |
| Oxnard: | $1,876 |
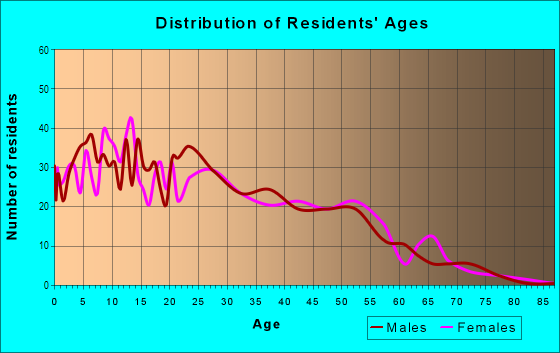
| Males: | 732 |
| Females: | 766 |
Males:
| This neighborhood: | 43.3 years |
| Whole city: | 35.1 years |
| This neighborhood: | 23.3 years |
| Whole city: | 34.3 years |
Average household size:
| Terrace Estates: | 5.4 people |
| Oxnard: | 3.6 people |
Percentage of family households:
| Terrace Estates: | 66.1% |
| Oxnard: | 51.5% |
| Here: | 55.9% |
| Oxnard: | 47.9% |
Percentage of married-couple families with children (among all households):
| Terrace Estates: | 15.8% |
| Oxnard: | 16.4% |
Percentage of single-mother households (among all households):
| Terrace Estates: | 0.2% |
| Oxnard: | 8.1% |
Percentage of never married males 15 years old and over:
Percentage of never married females 15 years old and over:
| Terrace Estates: | 31.8% |
| Oxnard: | 22.9% |
Percentage of never married females 15 years old and over:
| Terrace Estates: | 22.2% |
| city: | 20.1% |
Percentage of people that speak English not well or not at all:
| Terrace Estates: | 10.0% |
| Oxnard: | 20.2% |
Percentage of people born in this state:
Percentage of people born in another U.S. state:
Percentage of native residents but born outside the U.S.:
Percentage of foreign born residents:
| Here: | 48.2% |
| Oxnard: | 58.8% |
Percentage of people born in another U.S. state:
| Terrace Estates: | 6.8% |
| Oxnard: | 6.5% |
Percentage of native residents but born outside the U.S.:
| Here: | 0.8% |
| city: | 1.4% |
Percentage of foreign born residents:
| Here: | 44.2% |
| Oxnard: | 33.3% |
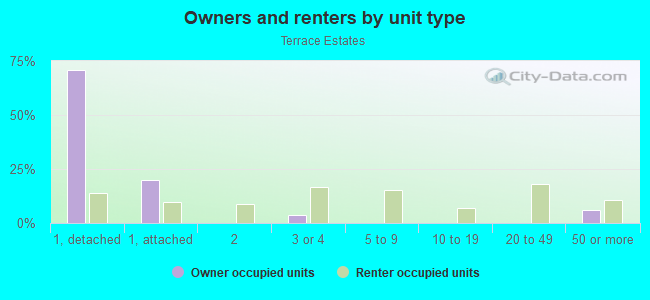
Owner-occupied
Renter-occupied

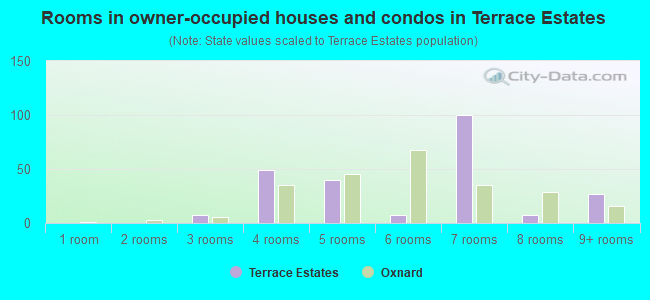
- Rooms in owner-occupied houses and condos in Terrace Estates
- 01 room
- 02 rooms
- 73 rooms
- 494 rooms
- 405 rooms
- 76 rooms
- 1007 rooms
- 78 rooms
- 279+ rooms
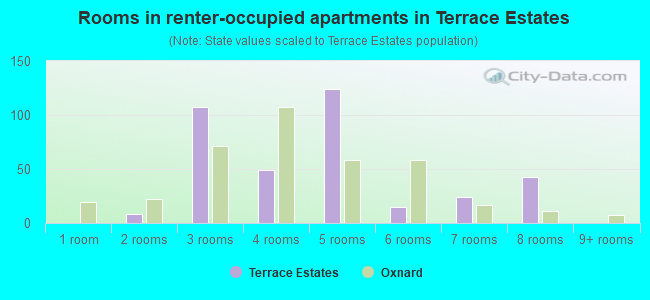
- Rooms in renter-occupied apartments in Terrace Estates
- 01 room
- 82 rooms
- 1073 rooms
- 494 rooms
- 1245 rooms
- 156 rooms
- 247 rooms
- 438 rooms
- 09+ rooms
Owner-occupied
Renter-occupied
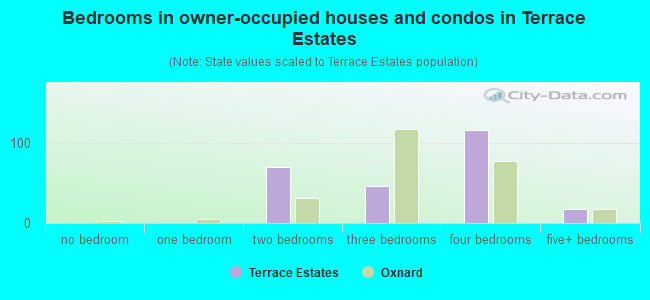
- Bedrooms in owner-occupied houses and condos in Terrace Estates
- 0no bedroom
- 01 bedroom
- 702 bedrooms
- 473 bedrooms
- 1174 bedrooms
- 185+ bedrooms
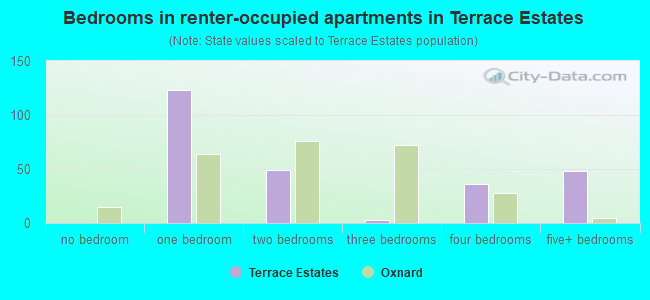
- Bedrooms in renter-occupied apartments in Terrace Estates
- 0no bedroom
- 1231 bedroom
- 492 bedrooms
- 33 bedrooms
- 364 bedrooms
- 485+ bedrooms
Average number of cars or other vehicles available in houses/condos:
Average number of cars or other vehicles available in apartments:
| This neighborhood: | 3.3 |
| Oxnard: | 2.5 |
Average number of cars or other vehicles available in apartments:
| Here: | 2.2 |
| city: | 1.9 |
Percentage of units with a mortgage:
| Terrace Estates: | 81.2% |
| Oxnard: | 65.5% |
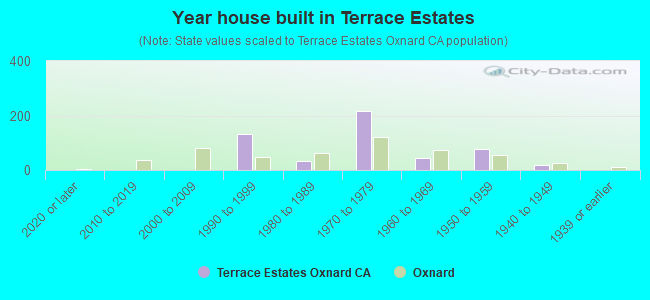
- Year house built in Terrace Estates
- 02020 or later
- 02010 to 2019
- 02000 to 2009
- 1311990 to 1999
- 321980 to 1989
- 2171970 to 1979
- 451960 to 1969
- 761950 to 1959
- 181940 to 1949
- 01939 or earlier
City-data.com crime index for city in 2020 (higher means more crime):
| City: | 220.0 |
| U.S. average: | 219.5 |
Travel time to work (commute)
![Travel time to work (commute)]()
- 715 to 9 minutes
- 7110 to 14 minutes
- 15515 to 19 minutes
- 12820 to 24 minutes
- 1,35725 to 29 minutes
- 32230 to 34 minutes
- 3740 to 44 minutes
- 2845 to 59 minutes
- 6960 to 89 minutes

Means of transportation to work
![Means of transportation to work]()
- 85.7%578Drove a car alone
- 11.7%79Carpooled
- 4.2%28Bus
- 0.9%6Bicycle
- 7.6%51Walked
- 1.5%10Worked at home

Time leaving home to go to work
![Time leaving home to go to work]()
- 12612:00 a.m. to 4:59 a.m.
- 2375:00 a.m. to 5:29 a.m.
- 2475:30 a.m. to 5:59 a.m.
- 5026:00 a.m. to 6:29 a.m.
- 3196:30 a.m. to 6:59 a.m.
- 2977:00 a.m. to 7:29 a.m.
- 867:30 a.m. to 7:59 a.m.
- 1488:00 a.m. to 8:29 a.m.
- 178:30 a.m. to 8:59 a.m.
- 119:00 a.m. to 9:59 a.m.
- 2510:00 a.m. to 10:59 a.m.
- 2611:00 a.m. to 11:59 a.m.
- 8112:00 p.m. to 3:59 p.m.
- 1144:00 p.m. to 11:59 p.m.

Occupations of males:
- Percentage of males in management occupations (except farmers):
Here: 2.1% city: 6.2%
- Percentage of males in business and financial operations occupations:
Here: 13.5% city: 2.6%
- Percentage of males in computer and mathematical occupations:
Here: 6.4% city: 2.4%
- Percentage of males in architecture and engineering occupations:
Here: 1.3% city: 3.1%
- Percentage of males in arts, design, entertainment, sports, and media occupations:
Here: 2.2% city: 1.1%
- Percentage of males in healthcare practitioners and technical occupations:
Here: 1.9% city: 1.3%
- Percentage of males in service occupations:
Here: 10.9% city: 16.9%
- Percentage of males in sales and office occupations:
Here: 39.2% city: 11.7%
- Percentage of males in farming, fishing, and forestry occupations:
Here: 5.4% city: 14.1%
- Percentage of males in construction, extraction, and maintenance occupations:
Here: 23.3% city: 9.8%
- Percentage of males in production occupations:
Here: 24.2% city: 9.6%
- Percentage of males in transportation occupations:
Here: 6.6% city: 6.5%
- Percentage of males in material moving occupations:
Here: 1.9% city: 6.3%
Occupations of females:
- Percentage of females in management occupations (except farmers):
Here: 26.0% city: 6.3%
- Percentage of females in business and financial operations occupations:
Here: 6.2% city: 5.3%
- Percentage of females in community and social services occupations:
Here: 4.8% city: 2.4%
- Percentage of females in arts, design, entertainment, sports, and media occupations:
Here: 9.6% city: 1.5%
- Percentage of females in healthcare practitioners and technical occupations:
Here: 5.4% city: 5.9%
- Percentage of females in service occupations:
Here: 35.7% city: 23.6%
- Percentage of females in sales and office occupations:
Here: 40.5% city: 27.3%
- Percentage of females in farming, fishing, and forestry occupations:
Here: 13.7% city: 8.0%
- Percentage of females in production occupations:
Here: 45.2% city: 6.8%
- Percentage of females in material moving occupations:
Here: 30.3% city: 3.7%
Percentage of people 16-64 in Armed Forces:
| Terrace Estates: | 0.2% |
| Oxnard: | 0.7% |
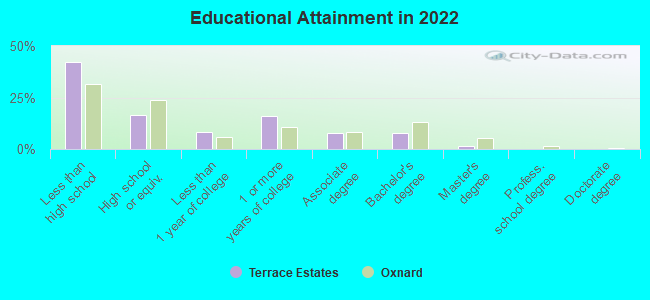
Education in this neighborhood (subdivision or community):
- Percentage of people 3 years and older in K-12 schools:
Terrace Estates: 20.6% Oxnard: 21.0%
- Percentage of people 3 years and older in undergraduate colleges:
Terrace Estates: 11.8% Oxnard: 5.2%
- Percentage of people 3 years and older in grad. or professional schools:
Terrace Estates: 1.3% Oxnard: 0.8%
- Percentage of students K-12 enrolled in private schools:
Terrace Estates: 0.0% Oxnard: 4.0%
Percentage of population below poverty level:
| Terrace Estates: | 13.1% |
| Oxnard: | 12.8% |
Median year owner moved in (as recorded in 2022):
Median year renter moved in (as recorded in 2022):
| Terrace Estates: | 2012 |
| Oxnard: | 2006 |
Median year renter moved in (as recorded in 2022):
| Terrace Estates: | 2017 |
| Oxnard: | 2019 |
Percentage of married-couple families with both working:
| Terrace Estates: | 61.9% |
| Oxnard: | 71.8% |
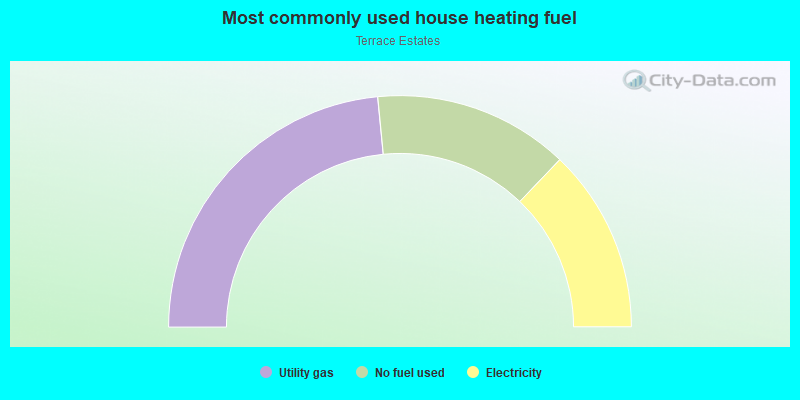
- 46.9%Utility gas
- 27.3%No fuel used
- 25.7%Electricity
Roads and streets:
E Pleasant Valley Rd
Length: 1.01 miles
Direction: SW-NE
Address range: 1110 to 1999
Direction: SW-NE
Address range: 1110 to 1999
Berkshire St
Length: 0.80 miles
Directions: E-W, N-S, SE-NW, SW-NE
Address range: 1000 to 4331
Directions: E-W, N-S, SE-NW, SW-NE
Address range: 1000 to 4331
Terrace Ave
Length: 0.47 miles
Directions: N-S, SE-NW
Address range: 4202 to 4999
Directions: N-S, SE-NW
Address range: 4202 to 4999
Hamilton Ave
Length: 0.38 miles
Directions: N-S, SE-NW
Address range: 4200 to 4999
Directions: N-S, SE-NW
Address range: 4200 to 4999
Highland Ave
Length: 0.35 miles
Directions: N-S, SE-NW
Address range: 4200 to 4899
Directions: N-S, SE-NW
Address range: 4200 to 4899
Billings St
Length: 0.28 miles
Direction: E-W
Address range: 1400 to 4406
Direction: E-W
Address range: 1400 to 4406
Dallas Dr
Length: 0.23 miles
Directions: N-S, SW-NE
Address range: 4200 to 4699
Directions: N-S, SW-NE
Address range: 4200 to 4699
Anchorage St
Length: 0.22 miles
Direction: N-S
Address range: 4400 to 4799
Direction: N-S
Address range: 4400 to 4799
Boston Way
Length: 0.19 miles
Directions: N-S, SE-NW
Address range: 4400 to 4799
Directions: N-S, SE-NW
Address range: 4400 to 4799
York St
Length: 0.18 miles
Direction: E-W
Address range: 1000 to 1399
Direction: E-W
Address range: 1000 to 1399
Browning Dr
Length: 0.18 miles
Directions: N-S, SE-NW
Address range: 4200 to 4499
Directions: N-S, SE-NW
Address range: 4200 to 4499
Concord Way
Length: 0.16 miles
Directions: N-S, SE-NW
Address range: 4400 to 4699
Directions: N-S, SE-NW
Address range: 4400 to 4699
S Rose Ave
Length: 0.16 miles
Direction: N-S
Address range: 4400 to 4749
Direction: N-S
Address range: 4400 to 4749
Drake Dr
Length: 0.14 miles
Directions: N-S, SE-NW
Address range: 4200 to 4499
Directions: N-S, SE-NW
Address range: 4200 to 4499
Yale St
Length: 0.12 miles
Directions: E-W, SE-NW
Address range: 900 to 1299
Directions: E-W, SE-NW
Address range: 900 to 1299
Eliot Dr
Length: 0.10 miles
Directions: N-S, SE-NW, SW-NE
Address range: 4200 to 4399
Directions: N-S, SE-NW, SW-NE
Address range: 4200 to 4399
Jeffreys Pl
Length: 0.09 miles
Directions: E-W, SW-NE
Address range: 1900 to 1999
Directions: E-W, SW-NE
Address range: 1900 to 1999
Keats Pl
Length: 0.06 miles
Direction: E-W
Direction: E-W
Berkshire Ct
Length: 0.03 miles
Direction: SE-NW
Address range: 4300 to 4399
Direction: SE-NW
Address range: 4300 to 4399