Thai Town neighborhood in Los Angeles, California (CA), 90027 detailed profile
Settings
X

Business Search - 14 Million verified businesses
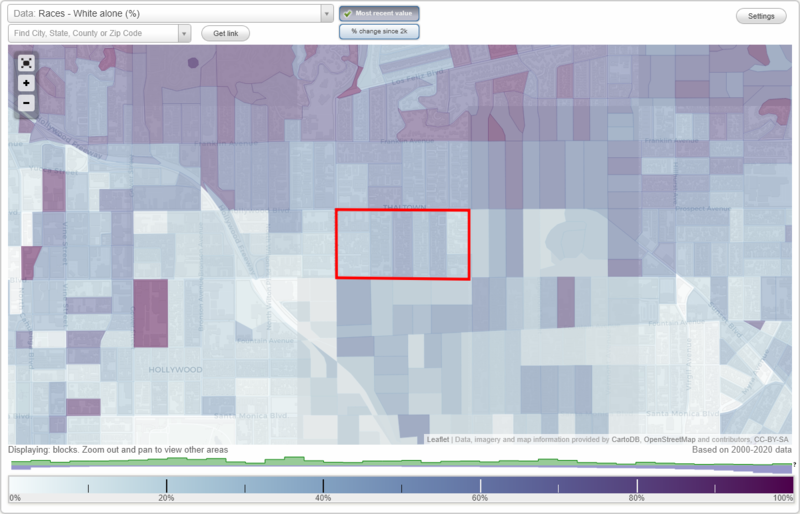
Area: 0.123 square miles
Population: 4,804
Population density:
| Thai Town: | 38,929 people per square mile |
| Los Angeles: | 8,148 people per square mile |

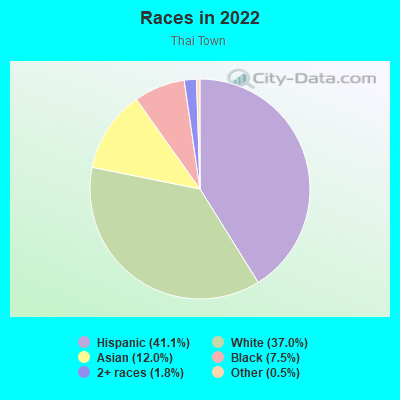
- 1,98541.1%Hispanic or Latino
- 1,78637.0%White
- 58112.0%Asian
- 3647.5%Black
- 891.8%Two or more races
- 250.5%Some other race
Median household income in 2022:
| Thai Town: | $47,579 |
| Los Angeles: | $76,135 |
Distribution of median household income
![Distribution of median household income]()
- 232Less than $10,000
- 291$10,000 to $19,999
- 264$20,000 to $29,999
- 139$30,000 to $39,999
- 117$40,000 to $49,999
- 184$50,000 to $59,999
- 207$60,000 to $74,999
- 295$75,000 to $99,999
- 120$100,000 to $124,999
- 104$125,000 to $149,999
- 77$150,000 to $199,999
- 100$200,000 or more

Distribution of owner-occupied house/condo value
![Distribution of owner-occupied house/condo value]()
- 132$400,000 to $499,999
- 35$500,000 to $749,999
- 52$750,000 to $999,999
- 25$1,000,000 or more

Distribution of rent paid by renters
![Distribution of rent paid by renters]()
- 43Less than $100
- 18$100 to $199
- 296$200 to $299
- 70$300 to $399
- 94$400 to $499
- 67$500 to $599
- 107$600 to $699
- 83$700 to $799
- 174$800 to $899
- 65$900 to $999
- 230$1,000 to $1,249
- 332$1,250 to $1,499
- 608$1,500 to $1,999
- 445$2,000 or more

Median rent in 2022:
| Thai Town: | $1,462 |
| Los Angeles: | $1,648 |
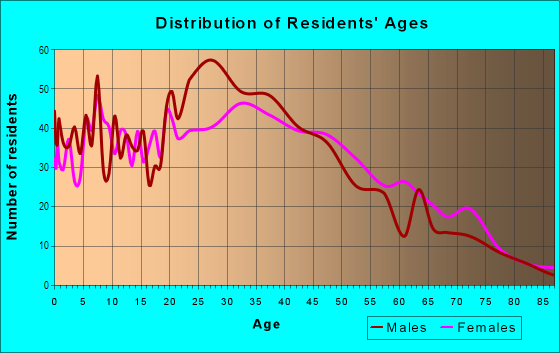
| Males: | 2,556 |
| Females: | 2,248 |
Males:
| This neighborhood: | 40.5 years |
| Whole city: | 36.5 years |
| This neighborhood: | 43.9 years |
| Whole city: | 37.9 years |
Average household size:
| Thai Town: | 3.7 people |
| Los Angeles: | 2.6 people |
Percentage of family households:
| Thai Town: | 33.6% |
| Los Angeles: | 40.1% |
| Here: | 31.5% |
| Los Angeles: | 36.7% |
Percentage of married-couple families with children (among all households):
| Thai Town: | 30.5% |
| Los Angeles: | 24.3% |
Percentage of single-mother households (among all households):
| Thai Town: | 1.9% |
| Los Angeles: | 9.9% |
Percentage of never married males 15 years old and over:
Percentage of never married females 15 years old and over:
| Thai Town: | 27.1% |
| Los Angeles: | 24.7% |
Percentage of never married females 15 years old and over:
| Thai Town: | 21.1% |
| city: | 22.0% |
Percentage of people that speak English not well or not at all:
| Thai Town: | 17.3% |
| Los Angeles: | 13.8% |
Percentage of people born in this state:
Percentage of people born in another U.S. state:
Percentage of native residents but born outside the U.S.:
Percentage of foreign born residents:
| Here: | 38.8% |
| Los Angeles: | 46.9% |
Percentage of people born in another U.S. state:
| Thai Town: | 17.4% |
| Los Angeles: | 15.7% |
Percentage of native residents but born outside the U.S.:
| Here: | 1.0% |
| city: | 1.6% |
Percentage of foreign born residents:
| Here: | 42.8% |
| Los Angeles: | 35.7% |
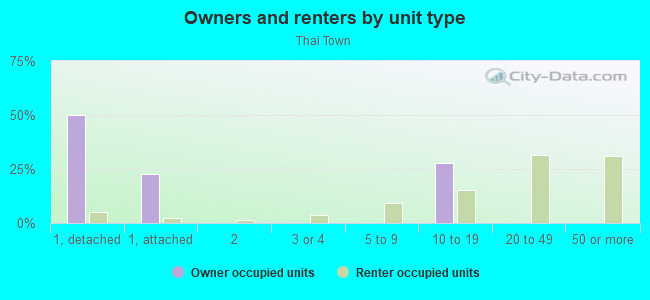
Owner-occupied
Renter-occupied

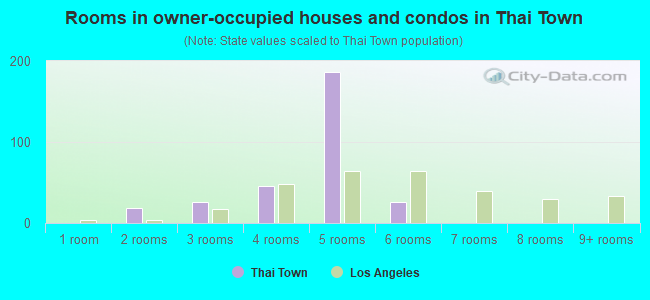
- Rooms in owner-occupied houses and condos in Thai Town
- 01 room
- 182 rooms
- 263 rooms
- 464 rooms
- 1865 rooms
- 266 rooms
- 07 rooms
- 08 rooms
- 09+ rooms
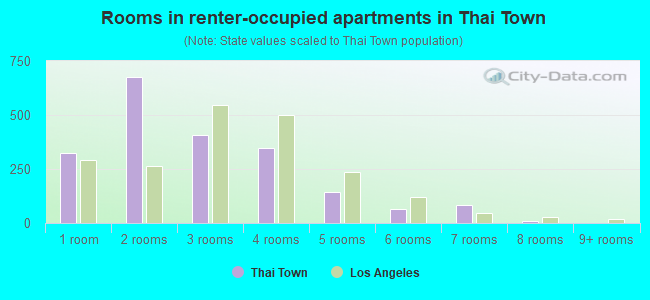
- Rooms in renter-occupied apartments in Thai Town
- 3231 room
- 6752 rooms
- 4093 rooms
- 3494 rooms
- 1425 rooms
- 656 rooms
- 837 rooms
- 78 rooms
- 09+ rooms
Owner-occupied
Renter-occupied
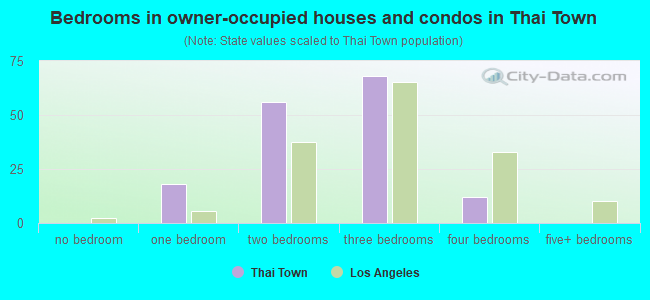
- Bedrooms in owner-occupied houses and condos in Thai Town
- 0no bedroom
- 181 bedroom
- 562 bedrooms
- 683 bedrooms
- 124 bedrooms
- 05+ bedrooms
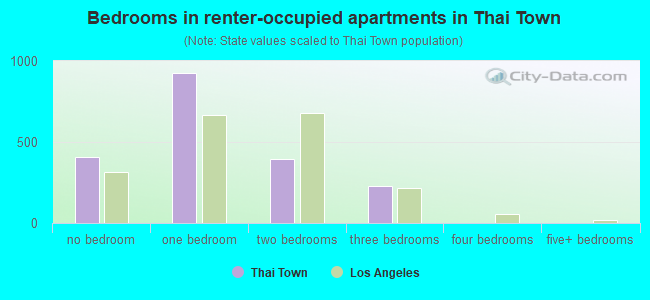
- Bedrooms in renter-occupied apartments in Thai Town
- 405no bedroom
- 9241 bedroom
- 3942 bedrooms
- 2263 bedrooms
- 04 bedrooms
- 05+ bedrooms
Average number of cars or other vehicles available in houses/condos:
Average number of cars or other vehicles available in apartments:
| This neighborhood: | |
| Los Angeles: |
Average number of cars or other vehicles available in apartments:
| Here: | 0.9 |
| city: | 1.3 |
Percentage of units with a mortgage:
| Thai Town: | 86.9% |
| Los Angeles: | 68.9% |
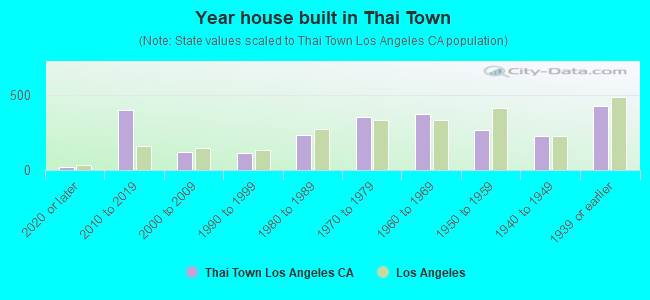
- Year house built in Thai Town
- 232020 or later
- 4022010 to 2019
- 1202000 to 2009
- 1141990 to 1999
- 2321980 to 1989
- 3541970 to 1979
- 3691960 to 1969
- 2691950 to 1959
- 2271940 to 1949
- 4271939 or earlier
City-data.com crime index for city in 2020 (higher means more crime):
| City: | 327.4 |
| U.S. average: | 219.5 |
Travel time to work (commute)
![Travel time to work (commute)]()
- 50Less than 5 minutes
- 975 to 9 minutes
- 10610 to 14 minutes
- 21515 to 19 minutes
- 18620 to 24 minutes
- 3825 to 29 minutes
- 39130 to 34 minutes
- 7035 to 39 minutes
- 17640 to 44 minutes
- 20945 to 59 minutes
- 19460 to 89 minutes
- 1990 or more minutes

Means of transportation to work
![Means of transportation to work]()
- 45.7%1,060Drove a car alone
- 5.6%130Carpooled
- 10.6%245Bus
- 2.9%68Subway or elevated rail
- 0.8%19Taxi
- 1.9%43Motorcycle
- 4.8%111Bicycle
- 6.0%138Walked
- 1.8%41Other means
- 25.7%595Worked at home

Time leaving home to go to work
![Time leaving home to go to work]()
- 4612:00 a.m. to 4:59 a.m.
- 415:00 a.m. to 5:29 a.m.
- 445:30 a.m. to 5:59 a.m.
- 816:00 a.m. to 6:29 a.m.
- 2056:30 a.m. to 6:59 a.m.
- 1687:00 a.m. to 7:29 a.m.
- 1047:30 a.m. to 7:59 a.m.
- 3298:00 a.m. to 8:29 a.m.
- 1778:30 a.m. to 8:59 a.m.
- 1849:00 a.m. to 9:59 a.m.
- 2410:00 a.m. to 10:59 a.m.
- 5311:00 a.m. to 11:59 a.m.
- 16812:00 p.m. to 3:59 p.m.
- 1334:00 p.m. to 11:59 p.m.

Occupations of males:
- Percentage of males in management occupations (except farmers):
Here: 7.3% city: 10.6%
- Percentage of males in business and financial operations occupations:
Here: 2.2% city: 5.0%
- Percentage of males in computer and mathematical occupations:
Here: 3.7% city: 3.6%
- Percentage of males in architecture and engineering occupations:
Here: 1.8% city: 2.2%
- Percentage of males in legal occupations:
Here: 1.1% city: 1.8%
- Percentage of males in education, training, and library occupations:
Here: 3.1% city: 3.2%
- Percentage of males in arts, design, entertainment, sports, and media occupations:
Here: 9.4% city: 8.0%
- Percentage of males in service occupations:
Here: 16.0% city: 16.2%
- Percentage of males in sales and office occupations:
Here: 17.8% city: 15.1%
- Percentage of males in construction, extraction, and maintenance occupations:
Here: 1.7% city: 9.6%
- Percentage of males in production occupations:
Here: 8.9% city: 5.9%
- Percentage of males in transportation occupations:
Here: 7.3% city: 5.6%
- Percentage of males in material moving occupations:
Here: 11.3% city: 4.4%
Occupations of females:
- Percentage of females in management occupations (except farmers):
Here: 3.7% city: 10.5%
- Percentage of females in business and financial operations occupations:
Here: 11.0% city: 6.5%
- Percentage of females in computer and mathematical occupations:
Here: 6.1% city: 1.5%
- Percentage of females in community and social services occupations:
Here: 3.2% city: 2.3%
- Percentage of females in legal occupations:
Here: 2.3% city: 2.1%
- Percentage of females in education, training, and library occupations:
Here: 5.6% city: 7.1%
- Percentage of females in arts, design, entertainment, sports, and media occupations:
Here: 7.2% city: 6.3%
- Percentage of females in healthcare practitioners and technical occupations:
Here: 4.1% city: 6.5%
- Percentage of females in service occupations:
Here: 32.7% city: 23.6%
- Percentage of females in sales and office occupations:
Here: 21.0% city: 24.7%
- Percentage of females in material moving occupations:
Here: 2.6% city: 2.0%
Percentage of people 16-64 in Armed Forces:
| Thai Town: | 0.0% |
| Los Angeles: | 0.1% |
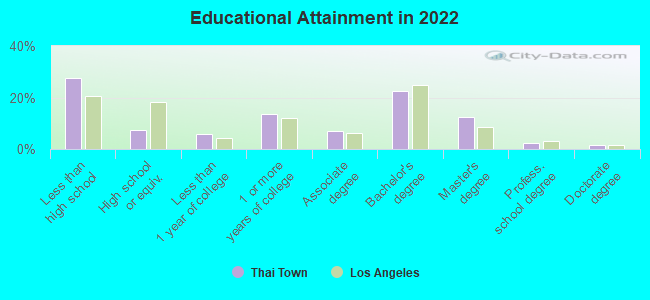
Education in this neighborhood (subdivision or community):
- Percentage of people 3 years and older in K-12 schools:
Thai Town: 17.7% Los Angeles: 14.4%
- Percentage of people 3 years and older in undergraduate colleges:
Thai Town: 6.9% Los Angeles: 6.0%
- Percentage of people 3 years and older in grad. or professional schools:
Thai Town: 1.7% Los Angeles: 2.1%
- Percentage of students K-12 enrolled in private schools:
Thai Town: 28.8% Los Angeles: 12.1%
Percentage of population below poverty level:
| Thai Town: | 27.6% |
| Los Angeles: | 16.8% |
Median year renter moved in (as recorded in 2022):
| Thai Town: | 2008 |
| Los Angeles: | 2018 |
Percentage of married-couple families with both working:
| Thai Town: | 72.2% |
| Los Angeles: | 63.8% |
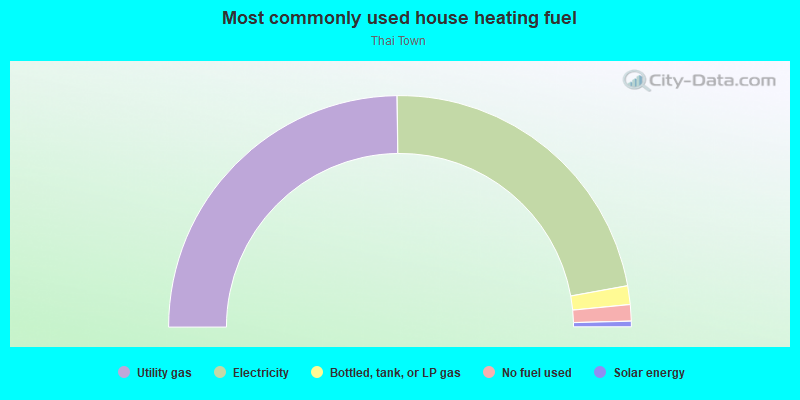
- 49.6%Utility gas
- 44.7%Electricity
- 2.6%Bottled, tank, or LP gas
- 2.3%No fuel used
- 0.8%Solar energy
Roads and streets:
Sunset Blvd (W Sunset Blvd)
Length: 0.34 miles
Direction: E-W
Address range: 5150 to 5399
Direction: E-W
Address range: 5150 to 5399
N Serrano Ave
Length: 0.17 miles
Direction: N-S
Address range: 1500 to 1619
Direction: N-S
Address range: 1500 to 1619
Winona Blvd
Length: 0.09 miles
Direction: N-S
Address range: 1500 to 1543
Direction: N-S
Address range: 1500 to 1543