The Flats neighborhood in Wilmington, Delaware (DE), 19805 detailed profile
Settings
X

Business Search - 14 Million verified businesses
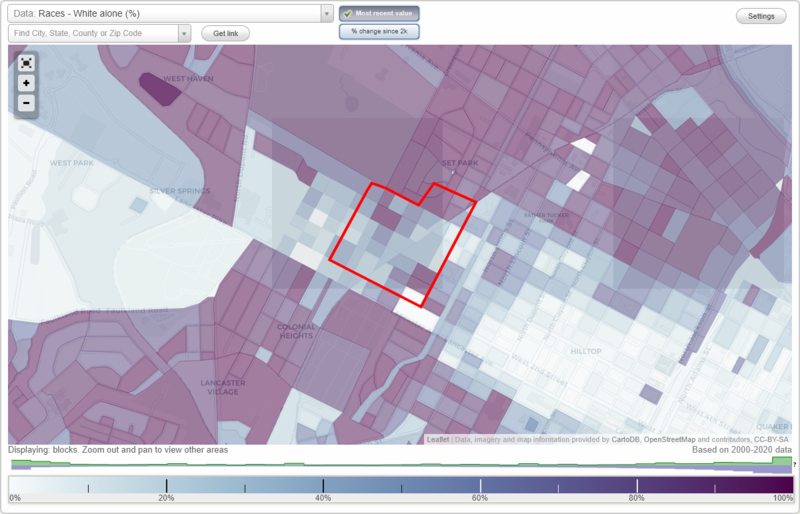
Area: 0.122 square miles
Population: 1,350
Population density:
| The Flats: | 11,046 people per square mile |
| Wilmington: | 6,597 people per square mile |

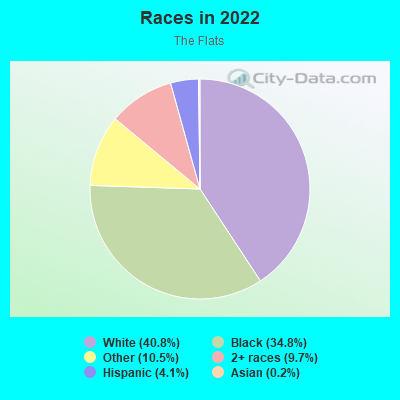
- 63740.8%White
- 54334.8%Black
- 16410.5%Some other race
- 1519.7%Two or more races
- 644.1%Hispanic or Latino
- 30.2%Asian
Distribution of median household income
![Distribution of median household income]()
- 131Less than $10,000
- 73$10,000 to $19,999
- 153$20,000 to $29,999
- 51$30,000 to $39,999
- 30$40,000 to $49,999
- 57$50,000 to $59,999
- 8$60,000 to $74,999
- 85$75,000 to $99,999
- 12$100,000 to $124,999
- 9$125,000 to $149,999
- 160$150,000 to $199,999
- 64$200,000 or more

Distribution of owner-occupied house/condo value
![Distribution of owner-occupied house/condo value]()
- 9Less than $50,000
- 30$50,000 to $99,999
- 75$100,000 to $149,999
- 32$150,000 to $199,999
- 43$200,000 to $249,999
- 98$250,000 to $299,999
- 67$300,000 to $399,999
- 52$400,000 to $499,999
- 73$500,000 to $749,999
- 64$750,000 to $999,999
- 23$1,000,000 or more

Distribution of rent paid by renters
![Distribution of rent paid by renters]()
- 34$100 to $199
- 27$500 to $599
- 16$700 to $799
- 158$800 to $899
- 39$900 to $999
- 323$1,000 to $1,249
- 38$1,250 to $1,499
- 8$1,500 to $1,999
- 13$2,000 or more

Median rent in 2022:
| The Flats: | $951 |
| Wilmington: | $941 |
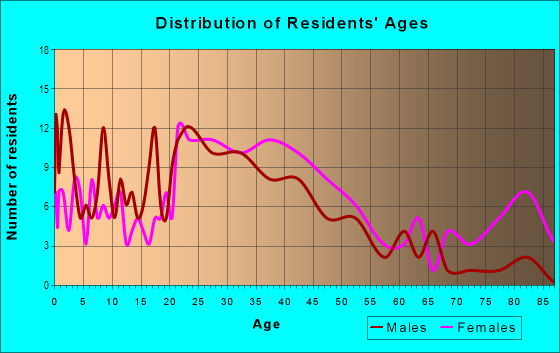
| Males: | 453 |
| Females: | 897 |
Males:
| This neighborhood: | 47.5 years |
| Whole city: | 37.1 years |
| This neighborhood: | 44.8 years |
| Whole city: | 41.1 years |
Average household size:
| The Flats: | 2.1 people |
| Wilmington: | 2.1 people |
Percentage of family households:
| The Flats: | 42.1% |
| Wilmington: | 32.8% |
| Here: | 28.1% |
| Wilmington: | 20.9% |
Percentage of married-couple families with children (among all households):
| The Flats: | 27.5% |
| Wilmington: | 13.2% |
Percentage of single-mother households (among all households):
| The Flats: | 23.3% |
| Wilmington: | 24.1% |
Percentage of never married males 15 years old and over:
Percentage of never married females 15 years old and over:
| The Flats: | 16.9% |
| Wilmington: | 22.2% |
Percentage of never married females 15 years old and over:
| The Flats: | 29.2% |
| city: | 28.6% |
Percentage of people that speak English not well or not at all:
| The Flats: | 0.2% |
| Wilmington: | 2.4% |
Percentage of people born in this state:
Percentage of people born in another U.S. state:
Percentage of native residents but born outside the U.S.:
Percentage of foreign born residents:
| Here: | 60.0% |
| Wilmington: | 45.5% |
Percentage of people born in another U.S. state:
| The Flats: | 37.9% |
| Wilmington: | 43.0% |
Percentage of native residents but born outside the U.S.:
| Here: | 0.9% |
| city: | 3.5% |
Percentage of foreign born residents:
| Here: | 1.1% |
| Wilmington: | 8.0% |
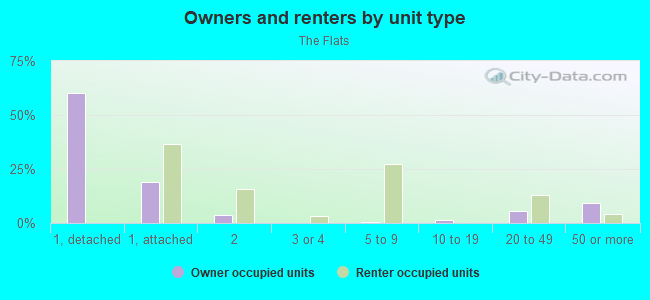
Owner-occupied
Renter-occupied

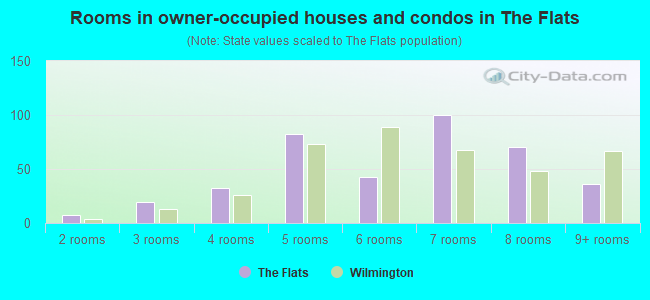
- Rooms in owner-occupied houses and condos in The Flats
- 01 room
- 72 rooms
- 193 rooms
- 324 rooms
- 825 rooms
- 436 rooms
- 1007 rooms
- 708 rooms
- 369+ rooms
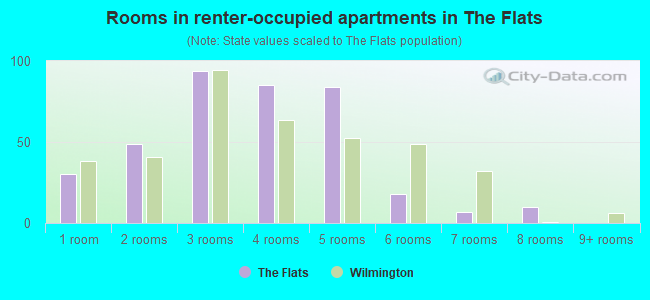
- Rooms in renter-occupied apartments in The Flats
- 301 room
- 492 rooms
- 943 rooms
- 854 rooms
- 845 rooms
- 186 rooms
- 77 rooms
- 108 rooms
- 09+ rooms
Owner-occupied
Renter-occupied
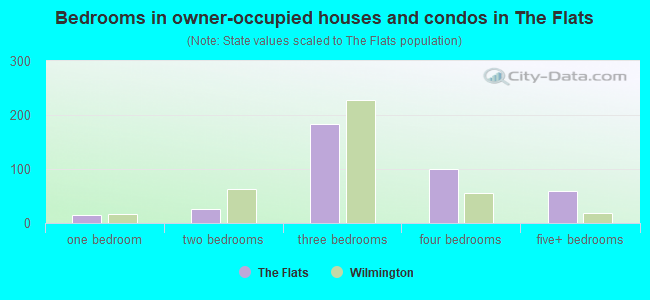
- Bedrooms in owner-occupied houses and condos in The Flats
- 0no bedroom
- 151 bedroom
- 262 bedrooms
- 1833 bedrooms
- 1004 bedrooms
- 605+ bedrooms
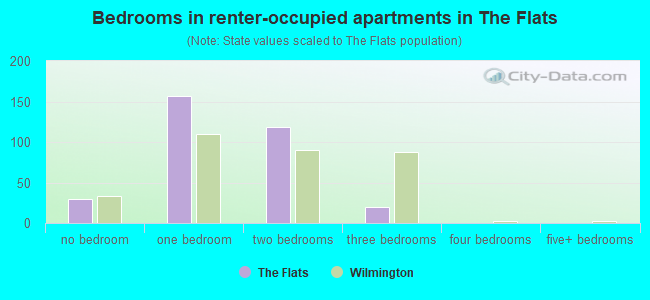
- Bedrooms in renter-occupied apartments in The Flats
- 30no bedroom
- 1571 bedroom
- 1182 bedrooms
- 203 bedrooms
- 04 bedrooms
- 05+ bedrooms
Average number of cars or other vehicles available in houses/condos:
Average number of cars or other vehicles available in apartments:
| This neighborhood: | 1.8 |
| Wilmington: | 1.6 |
Average number of cars or other vehicles available in apartments:
| Here: | 0.6 |
| city: | 0.9 |
Percentage of units with a mortgage:
| The Flats: | 80.7% |
| Wilmington: | 67.1% |
Housing prices:
- Average estimated value of detached houses in 2022 (36.2% of all units):
The Flats: $343,448 Delaware: $419,599
- Average estimated value of townhouses or other attached units in 2022 (28.1% of all units):
This neighborhood: $233,860 Delaware: $291,415
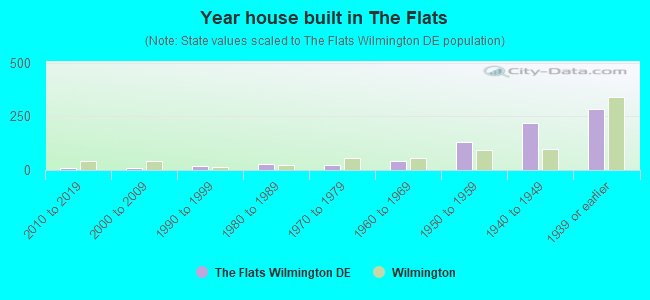
- Year house built in The Flats
- 12020 or later
- 72010 to 2019
- 72000 to 2009
- 201990 to 1999
- 291980 to 1989
- 231970 to 1979
- 421960 to 1969
- 1321950 to 1959
- 2201940 to 1949
- 2851939 or earlier
City-data.com crime index for city in 2020 (higher means more crime):
| City: | 649.2 |
| U.S. average: | 219.5 |
Travel time to work (commute)
![Travel time to work (commute)]()
- 16Less than 5 minutes
- 375 to 9 minutes
- 4910 to 14 minutes
- 9515 to 19 minutes
- 13420 to 24 minutes
- 6925 to 29 minutes
- 6730 to 34 minutes
- 235 to 39 minutes
- 3240 to 44 minutes
- 4045 to 59 minutes
- 3760 to 89 minutes
- 1090 or more minutes

Means of transportation to work
![Means of transportation to work]()
- 69.1%413Drove a car alone
- 12.7%76Carpooled
- 10.4%62Bus
- 7.0%42Long-distance train or commuter rail
- 1.0%6Bicycle
- 7.0%42Walked
- 10.7%64Worked at home

Time leaving home to go to work
![Time leaving home to go to work]()
- 4112:00 a.m. to 4:59 a.m.
- 185:00 a.m. to 5:29 a.m.
- 805:30 a.m. to 5:59 a.m.
- 136:00 a.m. to 6:29 a.m.
- 786:30 a.m. to 6:59 a.m.
- 1267:00 a.m. to 7:29 a.m.
- 707:30 a.m. to 7:59 a.m.
- 618:00 a.m. to 8:29 a.m.
- 448:30 a.m. to 8:59 a.m.
- 259:00 a.m. to 9:59 a.m.
- 210:00 a.m. to 10:59 a.m.
- 711:00 a.m. to 11:59 a.m.
- 1612:00 p.m. to 3:59 p.m.
- 44:00 p.m. to 11:59 p.m.

Occupations of males:
- Percentage of males in management occupations (except farmers):
Here: 7.2% city: 8.8%
- Percentage of males in computer and mathematical occupations:
Here: 3.3% city: 3.9%
- Percentage of males in architecture and engineering occupations:
Here: 1.6% city: 3.0%
- Percentage of males in community and social services occupations:
Here: 2.0% city: 3.6%
- Percentage of males in legal occupations:
Here: 15.9% city: 3.3%
- Percentage of males in education, training, and library occupations:
Here: 2.7% city: 2.6%
- Percentage of males in arts, design, entertainment, sports, and media occupations:
Here: 2.9% city: 1.7%
- Percentage of males in service occupations:
Here: 46.6% city: 18.7%
- Percentage of males in construction, extraction, and maintenance occupations:
Here: 2.5% city: 6.3%
- Percentage of males in transportation occupations:
Here: 3.8% city: 7.6%
Occupations of females:
- Percentage of females in management occupations (except farmers):
Here: 2.2% city: 10.8%
- Percentage of females in business and financial operations occupations:
Here: 3.2% city: 10.0%
- Percentage of females in computer and mathematical occupations:
Here: 1.6% city: 2.3%
- Percentage of females in community and social services occupations:
Here: 6.7% city: 4.0%
- Percentage of females in legal occupations:
Here: 7.5% city: 2.6%
- Percentage of females in education, training, and library occupations:
Here: 6.0% city: 9.1%
- Percentage of females in healthcare practitioners and technical occupations:
Here: 3.2% city: 8.1%
- Percentage of females in service occupations:
Here: 63.9% city: 21.3%
- Percentage of females in sales and office occupations:
Here: 6.6% city: 21.1%
Percentage of people 16-64 in Armed Forces:
| The Flats: | 0.0% |
| Wilmington: | 0.4% |
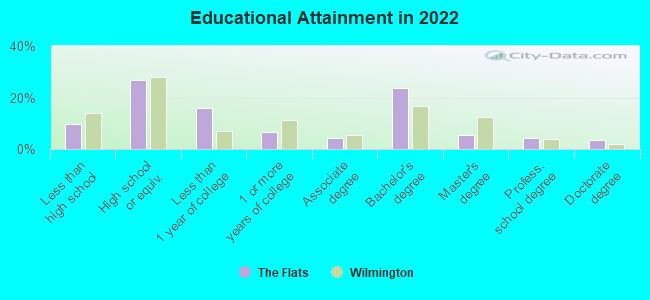
Education in this neighborhood (subdivision or community):
- Percentage of people 3 years and older in K-12 schools:
The Flats: 32.8% Wilmington: 16.0%
- Percentage of people 3 years and older in undergraduate colleges:
The Flats: 6.3% Wilmington: 3.1%
- Percentage of people 3 years and older in grad. or professional schools:
The Flats: 1.6% Wilmington: 2.8%
- Percentage of students K-12 enrolled in private schools:
The Flats: 34.8% Wilmington: 8.2%
Percentage of population below poverty level:
| The Flats: | 21.6% |
| Wilmington: | 22.2% |
Median year owner moved in (as recorded in 2022):
Median year renter moved in (as recorded in 2022):
| The Flats: | 2007 |
| Wilmington: | 2010 |
Median year renter moved in (as recorded in 2022):
| The Flats: | 2017 |
| Wilmington: | 2020 |
Percentage of married-couple families with both working:
| The Flats: | 101.2% |
| Wilmington: | 84.9% |
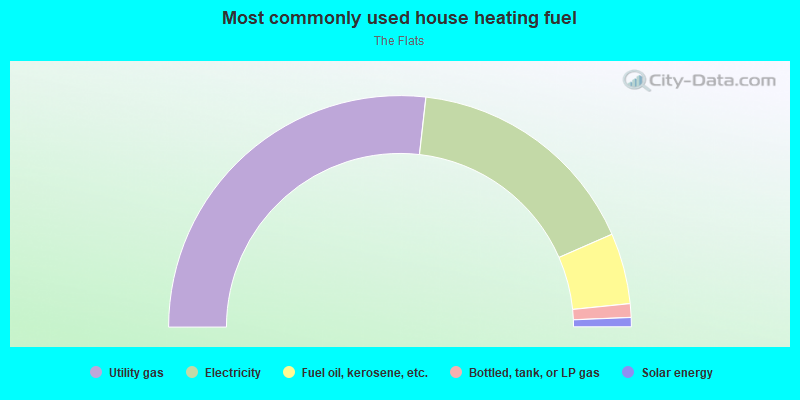
- 53.6%Utility gas
- 33.3%Electricity
- 9.9%Fuel oil, kerosene, etc.
- 1.9%Bottled, tank, or LP gas
- 1.3%Solar energy
Roads and streets:
Bayard Ave
Length: 0.39 miles
Directions: E-W, SW-NE
Address range: 200 to 899
Directions: E-W, SW-NE
Address range: 200 to 899
W 3rd St
Length: 0.37 miles
Directions: E-W, SE-NW, SW-NE
Address range: 2200 to 2699
Directions: E-W, SE-NW, SW-NE
Address range: 2200 to 2699
W 4th St
Length: 0.36 miles
Directions: E-W, SE-NW
Address range: 2202 to 2699
Directions: E-W, SE-NW
Address range: 2202 to 2699
W 6th St
Length: 0.36 miles
Directions: E-W, SE-NW
Address range: 2200 to 2699
Directions: E-W, SE-NW
Address range: 2200 to 2699
Woodlawn Ave
Length: 0.28 miles
Direction: SW-NE
Address range: 200 to 763
Direction: SW-NE
Address range: 200 to 763
Hawley St
Length: 0.28 miles
Direction: SW-NE
Address range: 600 to 699
Direction: SW-NE
Address range: 600 to 699
Greenhill Ave
Length: 0.26 miles
Direction: SW-NE
Address range: 200 to 599
Direction: SW-NE
Address range: 200 to 599
W 5th St
Length: 0.26 miles
Directions: E-W, SE-NW, SW-NE
Address range: 2200 to 2699
Directions: E-W, SE-NW, SW-NE
Address range: 2200 to 2699
W 2nd St
Length: 0.25 miles
Directions: E-W, SE-NW
Address range: 2300 to 2699
Directions: E-W, SE-NW
Address range: 2300 to 2699
W 7th St
Length: 0.25 miles
Directions: E-W, SE-NW
Address range: 2200 to 2499
Directions: E-W, SE-NW
Address range: 2200 to 2499
Rodman St
Length: 0.21 miles
Direction: SW-NE
Address range: 200 to 699
Direction: SW-NE
Address range: 200 to 699
Webb St
Length: 0.20 miles
Direction: SW-NE
Address range: 200 to 499
Direction: SW-NE
Address range: 200 to 499
Ferris St
Length: 0.19 miles
Direction: SW-NE
Address range: 400 to 699
Direction: SW-NE
Address range: 400 to 699
Pyle St
Length: 0.18 miles
Direction: E-W
Address range: 2200 to 2399
Direction: E-W
Address range: 2200 to 2399
W Second St
Length: 0.09 miles
Direction: E-W
Direction: E-W
West St
Length: 0.08 miles
Direction: SW-NE
Direction: SW-NE
W 8th St
Length: 0.05 miles
Direction: E-W
Address range: 2210 to 2214
Direction: E-W
Address range: 2210 to 2214
N Bedford Ct
Length: 0.04 miles
Direction: N-S
Direction: N-S
Railroad features:
Csx RR
Length: 0.50 miles
Direction: SW-NE
Direction: SW-NE