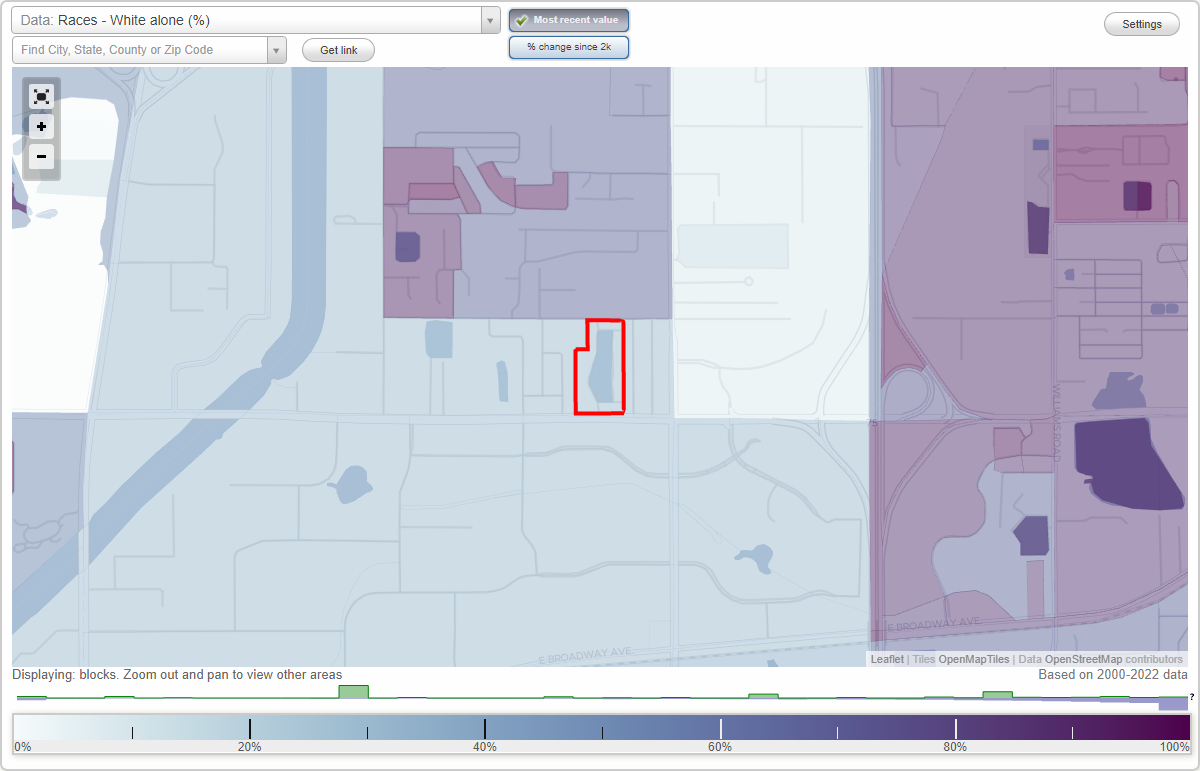
Townhomes at Sabal Pointe neighborhood in Tampa, Florida (FL), 33610 detailed profile
Settings
X

Business Search - 14 Million verified businesses
Area: 0.028 square miles
Population: 359
Population density:
| Townhomes at Sabal Pointe: | 12,718 people per square mile |
| Tampa: | 3,553 people per square mile |

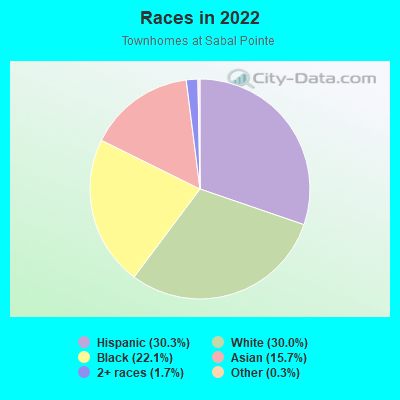
- 10830.3%Hispanic or Latino
- 10730.0%White
- 7922.1%Black
- 5615.7%Asian
- 61.7%Two or more races
- 10.3%Some other race
Median household income in 2022:
| Townhomes at Sabal Pointe: | $71,157 |
| Tampa: | $71,089 |
Distribution of median household income
![Distribution of median household income]()
- 17Less than $10,000
- 6$10,000 to $19,999
- 12$20,000 to $29,999
- 15$30,000 to $39,999
- 6$40,000 to $49,999
- 10$50,000 to $59,999
- 11$60,000 to $74,999
- 35$75,000 to $99,999
- 17$100,000 to $124,999
- 7$125,000 to $149,999
- 8$150,000 to $199,999
- 5$200,000 or more

Distribution of owner-occupied house/condo value
![Distribution of owner-occupied house/condo value]()
- 10Less than $50,000
- 19$50,000 to $99,999
- 11$100,000 to $149,999
- 4$150,000 to $199,999
- 7$200,000 to $249,999
- 9$250,000 to $299,999
- 5$300,000 to $399,999
- 9$400,000 to $499,999

Distribution of rent paid by renters
![Distribution of rent paid by renters]()
- 2$500 to $599
- 1$600 to $699
- 1$800 to $899
- 4$900 to $999
- 29$1,000 to $1,249
- 13$1,250 to $1,499
- 28$1,500 to $1,999

Median rent in 2022:
| Townhomes at Sabal Pointe: | $1,303 |
| Tampa: | $1,444 |
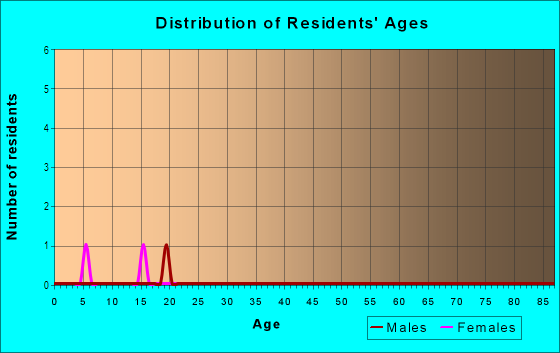
| Males: | 160 |
| Females: | 198 |
Males:
| This neighborhood: | 33.1 years |
| Whole city: | 35.5 years |
| This neighborhood: | 31.2 years |
| Whole city: | 35.1 years |
Average household size:
| Townhomes at Sabal Pointe: | 2.5 people |
| Tampa: | 2.3 people |
Percentage of family households:
| Townhomes at Sabal Pointe: | 47.2% |
| Tampa: | 39.9% |
| Here: | 28.7% |
| Tampa: | 35.4% |
Percentage of married-couple families with children (among all households):
| Townhomes at Sabal Pointe: | 15.9% |
| Tampa: | 25.1% |
Percentage of single-mother households (among all households):
| Townhomes at Sabal Pointe: | 21.2% |
| Tampa: | 12.2% |
Percentage of never married males 15 years old and over:
Percentage of never married females 15 years old and over:
| Townhomes at Sabal Pointe: | 20.5% |
| Tampa: | 23.6% |
Percentage of never married females 15 years old and over:
| Townhomes at Sabal Pointe: | 20.9% |
| city: | 20.9% |
Percentage of people that speak English not well or not at all:
| Townhomes at Sabal Pointe: | 6.5% |
| Tampa: | 6.4% |
Percentage of people born in this state:
Percentage of people born in another U.S. state:
Percentage of native residents but born outside the U.S.:
Percentage of foreign born residents:
| Here: | 47.4% |
| Tampa: | 39.7% |
Percentage of people born in another U.S. state:
| Townhomes at Sabal Pointe: | 23.3% |
| Tampa: | 35.7% |
Percentage of native residents but born outside the U.S.:
| Here: | 2.6% |
| city: | 4.6% |
Percentage of foreign born residents:
| Here: | 26.7% |
| Tampa: | 20.0% |
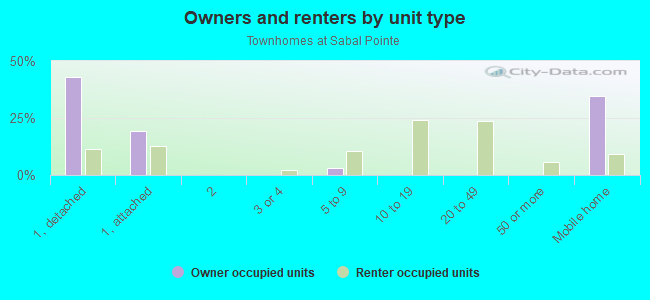
Owner-occupied
Renter-occupied

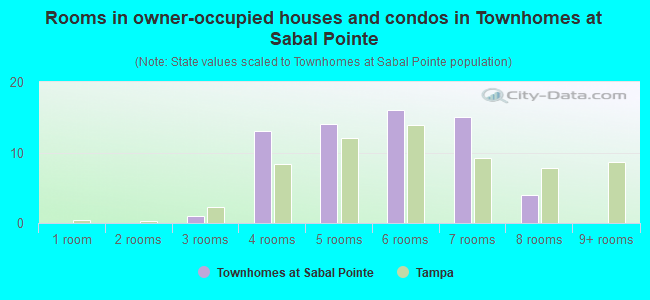
- Rooms in owner-occupied houses and condos in Townhomes at Sabal Pointe
- 01 room
- 02 rooms
- 13 rooms
- 134 rooms
- 145 rooms
- 166 rooms
- 157 rooms
- 48 rooms
- 09+ rooms
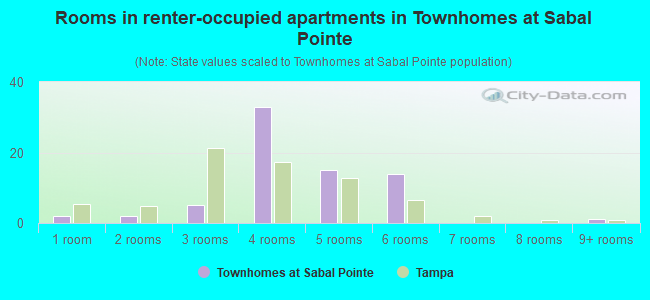
- Rooms in renter-occupied apartments in Townhomes at Sabal Pointe
- 21 room
- 22 rooms
- 53 rooms
- 334 rooms
- 155 rooms
- 146 rooms
- 07 rooms
- 08 rooms
- 19+ rooms
Owner-occupied
Renter-occupied
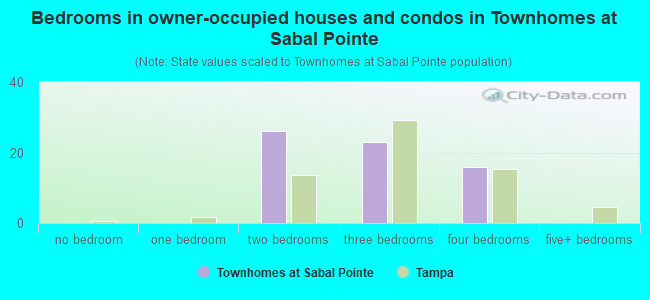
- Bedrooms in owner-occupied houses and condos in Townhomes at Sabal Pointe
- 0no bedroom
- 01 bedroom
- 262 bedrooms
- 233 bedrooms
- 164 bedrooms
- 05+ bedrooms
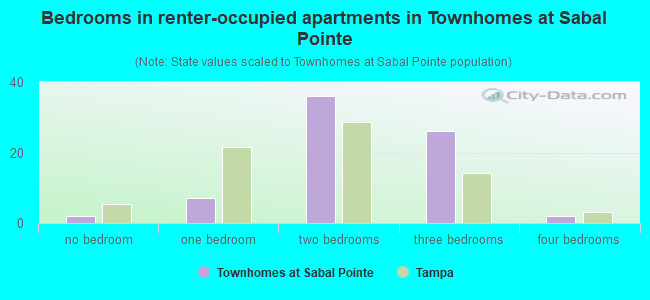
- Bedrooms in renter-occupied apartments in Townhomes at Sabal Pointe
- 2no bedroom
- 71 bedroom
- 362 bedrooms
- 263 bedrooms
- 24 bedrooms
- 05+ bedrooms
Average number of cars or other vehicles available in houses/condos:
Average number of cars or other vehicles available in apartments:
| This neighborhood: | 2.0 |
| Tampa: | 1.9 |
Average number of cars or other vehicles available in apartments:
| Here: | 1.5 |
| city: | 1.3 |
Percentage of units with a mortgage:
| Townhomes at Sabal Pointe: | 51.1% |
| Tampa: | 65.8% |
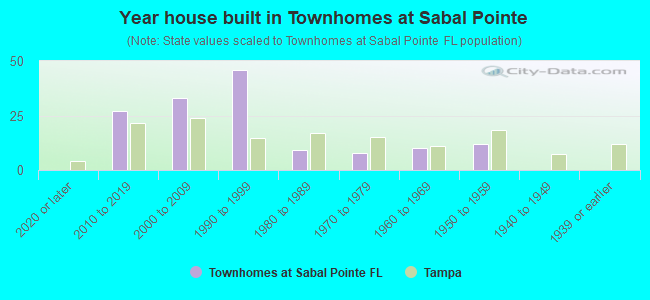
- Year house built in Townhomes at Sabal Pointe
- 02020 or later
- 272010 to 2019
- 332000 to 2009
- 461990 to 1999
- 91980 to 1989
- 81970 to 1979
- 101960 to 1969
- 121950 to 1959
- 01940 to 1949
- 01939 or earlier
City-data.com crime index for city in 2020 (higher means more crime):
| City: | 212.7 |
| U.S. average: | 219.5 |
Travel time to work (commute)
![Travel time to work (commute)]()
- 5Less than 5 minutes
- 195 to 9 minutes
- 2210 to 14 minutes
- 2715 to 19 minutes
- 1120 to 24 minutes
- 3230 to 34 minutes
- 735 to 39 minutes
- 340 to 44 minutes
- 945 to 59 minutes
- 1160 to 89 minutes
- 290 or more minutes

Means of transportation to work
![Means of transportation to work]()
- 71.1%126Drove a car alone
- 10.7%19Carpooled
- 2.3%4Walked
- 0.6%1Other means
- 13.0%23Worked at home

Time leaving home to go to work
![Time leaving home to go to work]()
- 212:00 a.m. to 4:59 a.m.
- 15:00 a.m. to 5:29 a.m.
- 165:30 a.m. to 5:59 a.m.
- 156:00 a.m. to 6:29 a.m.
- 76:30 a.m. to 6:59 a.m.
- 127:00 a.m. to 7:29 a.m.
- 137:30 a.m. to 7:59 a.m.
- 168:00 a.m. to 8:29 a.m.
- 158:30 a.m. to 8:59 a.m.
- 159:00 a.m. to 9:59 a.m.
- 610:00 a.m. to 10:59 a.m.
- 511:00 a.m. to 11:59 a.m.
- 612:00 p.m. to 3:59 p.m.
- 164:00 p.m. to 11:59 p.m.

Occupations of males:
- Percentage of males in management occupations (except farmers):
Here: 15.3% city: 14.3%
- Percentage of males in business and financial operations occupations:
Here: 14.6% city: 7.8%
- Percentage of males in computer and mathematical occupations:
Here: 22.3% city: 6.0%
- Percentage of males in community and social services occupations:
Here: 1.3% city: 0.5%
- Percentage of males in healthcare practitioners and technical occupations:
Here: 8.7% city: 4.9%
- Percentage of males in service occupations:
Here: 9.9% city: 13.7%
- Percentage of males in sales and office occupations:
Here: 5.9% city: 16.3%
- Percentage of males in construction, extraction, and maintenance occupations:
Here: 8.7% city: 8.2%
- Percentage of males in production occupations:
Here: 6.2% city: 3.7%
- Percentage of males in transportation occupations:
Here: 5.1% city: 5.8%
Occupations of females:
- Percentage of females in management occupations (except farmers):
Here: 1.8% city: 10.9%
- Percentage of females in business and financial operations occupations:
Here: 11.1% city: 8.5%
- Percentage of females in computer and mathematical occupations:
Here: 5.1% city: 2.4%
- Percentage of females in community and social services occupations:
Here: 3.8% city: 2.1%
- Percentage of females in education, training, and library occupations:
Here: 6.3% city: 7.2%
- Percentage of females in healthcare practitioners and technical occupations:
Here: 10.4% city: 10.3%
- Percentage of females in service occupations:
Here: 27.3% city: 19.1%
- Percentage of females in sales and office occupations:
Here: 29.6% city: 27.1%
- Percentage of females in transportation occupations:
Here: 1.0% city: 1.3%
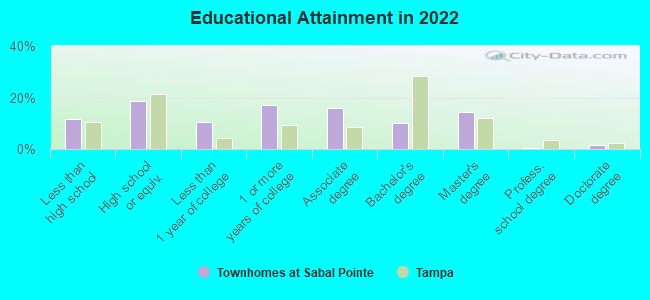
Education in this neighborhood (subdivision or community):
- Percentage of people 3 years and older in K-12 schools:
Townhomes at Sabal Pointe: 16.2% Tampa: 14.3%
- Percentage of people 3 years and older in undergraduate colleges:
Townhomes at Sabal Pointe: 4.0% Tampa: 7.8%
- Percentage of people 3 years and older in grad. or professional schools:
Townhomes at Sabal Pointe: 0.9% Tampa: 2.0%
- Percentage of students K-12 enrolled in private schools:
Townhomes at Sabal Pointe: 1.8% Tampa: 12.5%
Percentage of population below poverty level:
| Townhomes at Sabal Pointe: | 14.9% |
| Tampa: | 16.3% |
Median year owner moved in (as recorded in 2022):
Median year renter moved in (as recorded in 2022):
| Townhomes at Sabal Pointe: | 2011 |
| Tampa: | 2013 |
Median year renter moved in (as recorded in 2022):
| Townhomes at Sabal Pointe: | 2018 |
| Tampa: | 2020 |
Percentage of married-couple families with both working:
| Townhomes at Sabal Pointe: | 56.2% |
| Tampa: | 70.4% |
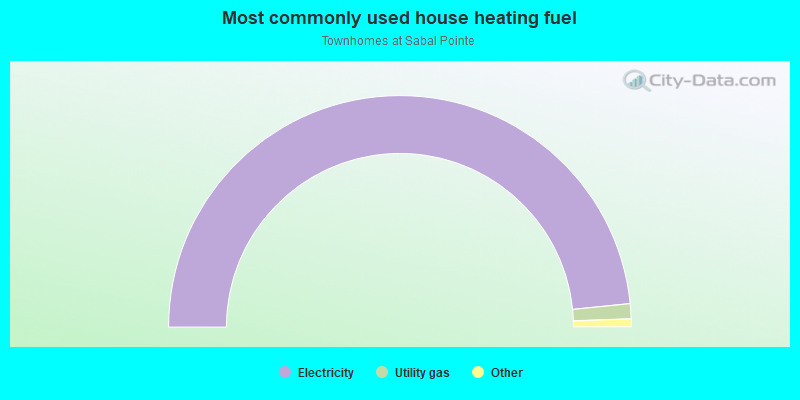
- 96.7%Electricity
- 2.1%Utility gas
- 0.6%Other fuel
- 0.5%No fuel used