University of Arizona Campus neighborhood in Tucson, Arizona (AZ), 85719, 85721 detailed profile
Settings
X

Business Search - 14 Million verified businesses
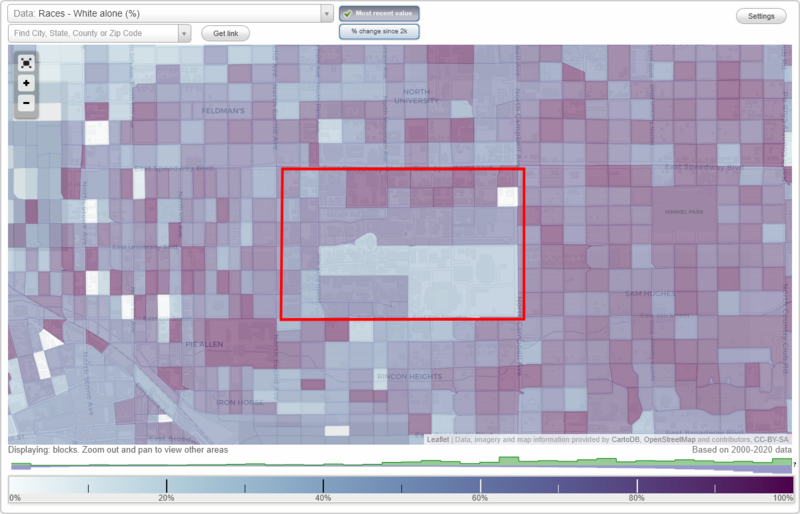
Area: 0.515 square miles
Population: 571
Population density:
| University of Arizona Campus: | 1,108 people per square mile |
| Tucson: | 2,808 people per square mile |

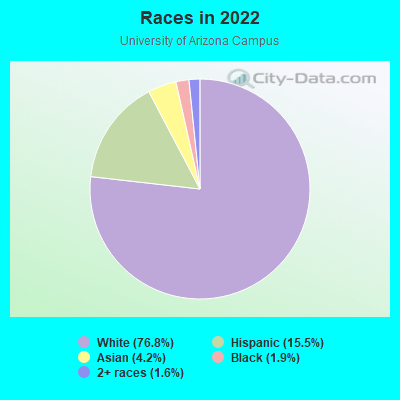
- 43676.8%White
- 8815.5%Hispanic or Latino
- 244.2%Asian
- 111.9%Black
- 91.6%Two or more races
Median household income in 2022:
| University of Arizona Campus: | $83,601 |
| Tucson: | $51,281 |
Distribution of median household income
![Distribution of median household income]()
- 27Less than $10,000
- 14$10,000 to $19,999
- 14$20,000 to $29,999
- 17$30,000 to $39,999
- 7$40,000 to $49,999
- 9$50,000 to $59,999
- 27$60,000 to $74,999
- 58$75,000 to $99,999
- 20$100,000 to $124,999
- 19$125,000 to $149,999
- 20$150,000 to $199,999
- 21$200,000 or more

Distribution of owner-occupied house/condo value
![Distribution of owner-occupied house/condo value]()
- 2$50,000 to $99,999
- 13$200,000 to $249,999
- 27$250,000 to $299,999
- 15$300,000 to $399,999
- 38$400,000 to $499,999
- 28$500,000 to $749,999
- 15$750,000 to $999,999
- 5$1,000,000 or more

Distribution of rent paid by renters
![Distribution of rent paid by renters]()
- 4$500 to $599
- 14$600 to $699
- 18$700 to $799
- 16$800 to $899
- 3$900 to $999
- 8$1,000 to $1,249
- 10$1,250 to $1,499
- 8$1,500 to $1,999
- 23$2,000 or more

Median rent in 2022:
| University of Arizona Campus: | $897 |
| Tucson: | $912 |
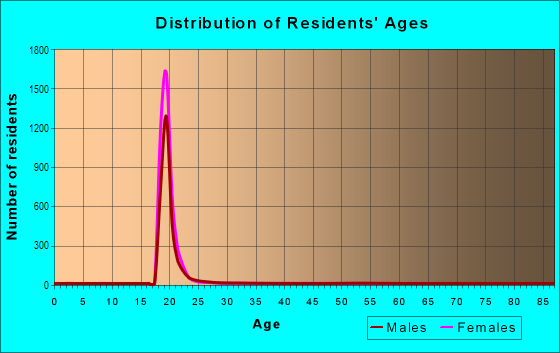
| Males: | 219 |
| Females: | 351 |
Males:
| This neighborhood: | 34.7 years |
| Whole city: | 33.1 years |
| This neighborhood: | 33.6 years |
| Whole city: | 34.8 years |
Average household size:
| University of Arizona Campus: | 2.1 people |
| Tucson: | 2.3 people |
Percentage of family households:
| University of Arizona Campus: | 25.7% |
| Tucson: | 37.6% |
| Here: | 28.0% |
| Tucson: | 31.5% |
Percentage of married-couple families with children (among all households):
| University of Arizona Campus: | 29.7% |
| Tucson: | 24.4% |
Percentage of single-mother households (among all households):
| University of Arizona Campus: | 11.6% |
| Tucson: | 12.1% |
Percentage of never married males 15 years old and over:
Percentage of never married females 15 years old and over:
| University of Arizona Campus: | 18.1% |
| Tucson: | 24.8% |
Percentage of never married females 15 years old and over:
| University of Arizona Campus: | 37.8% |
| city: | 20.6% |
Percentage of people that speak English not well or not at all:
| University of Arizona Campus: | 0.0% |
| Tucson: | 4.5% |
Percentage of people born in this state:
Percentage of people born in another U.S. state:
Percentage of native residents but born outside the U.S.:
Percentage of foreign born residents:
| Here: | 38.8% |
| Tucson: | 46.2% |
Percentage of people born in another U.S. state:
| University of Arizona Campus: | 48.1% |
| Tucson: | 38.2% |
Percentage of native residents but born outside the U.S.:
| Here: | 1.2% |
| city: | 1.8% |
Percentage of foreign born residents:
| Here: | 11.9% |
| Tucson: | 13.7% |
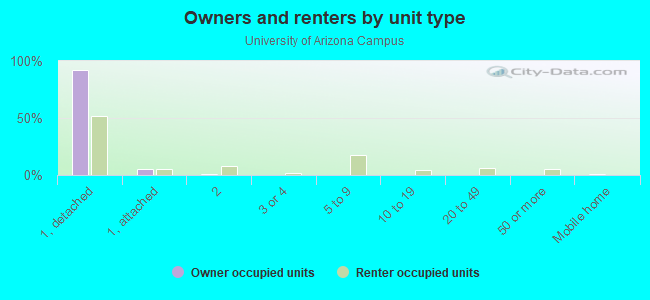
Owner-occupied
Renter-occupied

- Rooms in owner-occupied houses and condos in University of Arizona Campus
- 01 room
- 02 rooms
- 03 rooms
- 224 rooms
- 165 rooms
- 406 rooms
- 187 rooms
- 228 rooms
- 189+ rooms
- Rooms in renter-occupied apartments in University of Arizona Campus
- 81 room
- 122 rooms
- 283 rooms
- 154 rooms
- 105 rooms
- 136 rooms
- 37 rooms
- 118 rooms
- 29+ rooms
Owner-occupied
Renter-occupied
- Bedrooms in owner-occupied houses and condos in University of Arizona Campus
- 0no bedroom
- 11 bedroom
- 412 bedrooms
- 603 bedrooms
- 334 bedrooms
- 25+ bedrooms
- Bedrooms in renter-occupied apartments in University of Arizona Campus
- 9no bedroom
- 281 bedroom
- 382 bedrooms
- 263 bedrooms
- 34 bedrooms
- 05+ bedrooms
Average number of cars or other vehicles available in houses/condos:
Average number of cars or other vehicles available in apartments:
| This neighborhood: | 1.9 |
| Tucson: | 1.9 |
Average number of cars or other vehicles available in apartments:
| Here: | 1.7 |
| city: | 1.3 |
Percentage of units with a mortgage:
| University of Arizona Campus: | 55.2% |
| Tucson: | 59.8% |
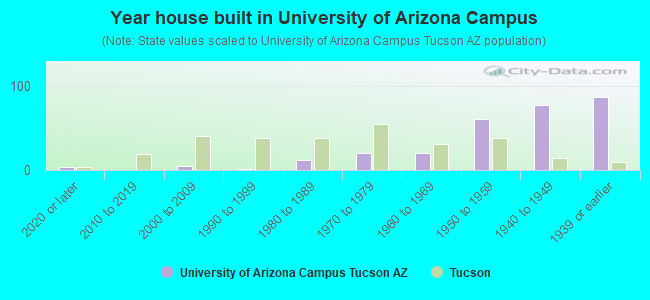
- Year house built in University of Arizona Campus
- 42020 or later
- 02010 to 2019
- 52000 to 2009
- 11990 to 1999
- 121980 to 1989
- 201970 to 1979
- 201960 to 1969
- 601950 to 1959
- 771940 to 1949
- 861939 or earlier
City-data.com crime index for city in 2020 (higher means more crime):
| City: | 397.7 |
| U.S. average: | 219.5 |
Travel time to work (commute)
![Travel time to work (commute)]()
- 4Less than 5 minutes
- 355 to 9 minutes
- 7210 to 14 minutes
- 3815 to 19 minutes
- 2320 to 24 minutes
- 1125 to 29 minutes
- 1130 to 34 minutes
- 1440 to 44 minutes
- 845 to 59 minutes
- 190 or more minutes

Means of transportation to work
![Means of transportation to work]()
- 43.2%131Drove a car alone
- 7.9%24Carpooled
- 6.9%21Bicycle
- 14.8%45Walked
- 26.4%80Worked at home

Time leaving home to go to work
![Time leaving home to go to work]()
- 412:00 a.m. to 4:59 a.m.
- 255:30 a.m. to 5:59 a.m.
- 26:00 a.m. to 6:29 a.m.
- 86:30 a.m. to 6:59 a.m.
- 87:00 a.m. to 7:29 a.m.
- 137:30 a.m. to 7:59 a.m.
- 248:00 a.m. to 8:29 a.m.
- 388:30 a.m. to 8:59 a.m.
- 179:00 a.m. to 9:59 a.m.
- 1610:00 a.m. to 10:59 a.m.
- 811:00 a.m. to 11:59 a.m.
- 2812:00 p.m. to 3:59 p.m.
- 264:00 p.m. to 11:59 p.m.

Occupations of males:
- Percentage of males in management occupations (except farmers):
Here: 11.7% city: 7.7%
- Percentage of males in business and financial operations occupations:
Here: 4.0% city: 3.8%
- Percentage of males in computer and mathematical occupations:
Here: 8.0% city: 4.5%
- Percentage of males in architecture and engineering occupations:
Here: 1.8% city: 4.0%
- Percentage of males in life, physical, and social science occupations:
Here: 2.7% city: 1.1%
- Percentage of males in community and social services occupations:
Here: 3.3% city: 1.0%
- Percentage of males in legal occupations:
Here: 5.5% city: 0.6%
- Percentage of males in education, training, and library occupations:
Here: 9.1% city: 4.7%
- Percentage of males in arts, design, entertainment, sports, and media occupations:
Here: 4.7% city: 1.6%
- Percentage of males in healthcare practitioners and technical occupations:
Here: 2.6% city: 3.0%
- Percentage of males in service occupations:
Here: 11.1% city: 20.4%
- Percentage of males in sales and office occupations:
Here: 25.4% city: 16.2%
- Percentage of males in farming, fishing, and forestry occupations:
Here: 1.3% city: 0.3%
- Percentage of males in production occupations:
Here: 5.2% city: 5.2%
- Percentage of males in material moving occupations:
Here: 2.7% city: 5.3%
Occupations of females:
- Percentage of females in management occupations (except farmers):
Here: 20.5% city: 8.2%
- Percentage of females in business and financial operations occupations:
Here: 7.2% city: 4.7%
- Percentage of females in life, physical, and social science occupations:
Here: 1.8% city: 1.1%
- Percentage of females in community and social services occupations:
Here: 2.1% city: 2.9%
- Percentage of females in legal occupations:
Here: 3.4% city: 1.0%
- Percentage of females in education, training, and library occupations:
Here: 13.0% city: 8.8%
- Percentage of females in arts, design, entertainment, sports, and media occupations:
Here: 2.1% city: 2.6%
- Percentage of females in healthcare practitioners and technical occupations:
Here: 14.8% city: 8.3%
- Percentage of females in service occupations:
Here: 22.7% city: 24.9%
- Percentage of females in sales and office occupations:
Here: 11.6% city: 29.9%
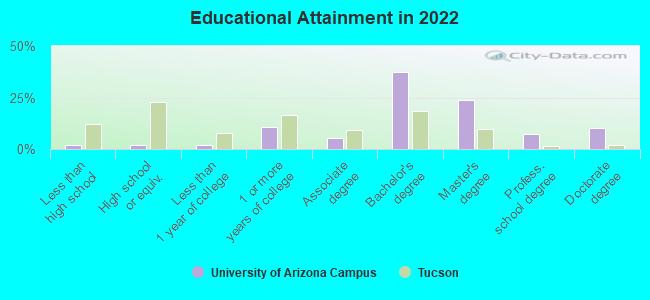
Education in this neighborhood (subdivision or community):
- Percentage of people 3 years and older in K-12 schools:
University of Arizona Campus: 5.3% Tucson: 15.1%
- Percentage of people 3 years and older in undergraduate colleges:
University of Arizona Campus: 20.5% Tucson: 9.7%
- Percentage of people 3 years and older in grad. or professional schools:
University of Arizona Campus: 9.6% Tucson: 2.1%
- Percentage of students K-12 enrolled in private schools:
University of Arizona Campus: 26.7% Tucson: 9.2%
Percentage of population below poverty level:
| University of Arizona Campus: | 18.7% |
| Tucson: | 19.2% |
Median year owner moved in (as recorded in 2022):
Median year renter moved in (as recorded in 2022):
| University of Arizona Campus: | 2002 |
| Tucson: | 2012 |
Median year renter moved in (as recorded in 2022):
| University of Arizona Campus: | 2018 |
| Tucson: | 2020 |
Percentage of married-couple families with both working:
| University of Arizona Campus: | 84.3% |
| Tucson: | 63.0% |
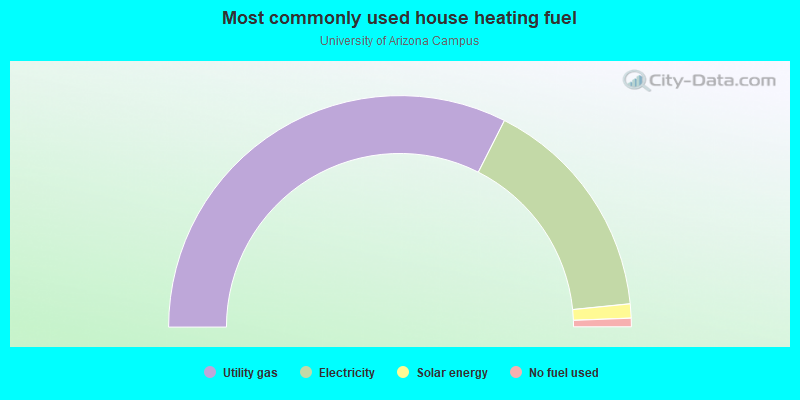
- 65.0%Utility gas
- 31.9%Electricity
- 2.0%Solar energy
- 1.2%No fuel used
Roads and streets:
E University Blvd
Length: 1.84 miles
Directions: E-W, N-S, SE-NW, SW-NE
Address range: 900 to 1899
Directions: E-W, N-S, SE-NW, SW-NE
Address range: 900 to 1899
E 6th St
Length: 0.98 miles
Directions: E-W, N-S
Address range: 900 to 1899
Directions: E-W, N-S
Address range: 900 to 1899
E 2nd St
Length: 0.97 miles
Direction: E-W
Address range: 900 to 1899
Direction: E-W
Address range: 900 to 1899
E 1st St
Length: 0.59 miles
Direction: E-W
Address range: 900 to 1899
Direction: E-W
Address range: 900 to 1899
N Campbell Ave
Length: 0.49 miles
Direction: N-S
Address range: 500 to 1054
Direction: N-S
Address range: 500 to 1054
N Park Ave
Length: 0.46 miles
Directions: N-S, SE-NW
Address range: 500 to 1000
Directions: N-S, SE-NW
Address range: 500 to 1000
N Tyndall Ave
Length: 0.45 miles
Direction: N-S
Address range: 500 to 999
Direction: N-S
Address range: 500 to 999
E 4th St
Length: 0.41 miles
Direction: E-W
Address range: 900 to 1499
Direction: E-W
Address range: 900 to 1499
E North Campus Dr
Length: 0.40 miles
Direction: E-W
Address range: 1000 to 1199
Direction: E-W
Address range: 1000 to 1199
4th St
Length: 0.40 miles
Direction: E-W
Address range: 1000 to 1399
Direction: E-W
Address range: 1000 to 1399
N Warren Ave
Length: 0.34 miles
Directions: N-S, SE-NW, SW-NE
Address range: 1000 to 1036
Directions: N-S, SE-NW, SW-NE
Address range: 1000 to 1036
Enke Dr
Length: 0.34 miles
Directions: E-W, N-S, SE-NW
Directions: E-W, N-S, SE-NW
Lowell St
Length: 0.32 miles
Direction: E-W
Address range: 1000 to 1269
Direction: E-W
Address range: 1000 to 1269
N Highland Ave
Length: 0.25 miles
Direction: N-S
Address range: 500 to 1048
Direction: N-S
Address range: 500 to 1048
S Campus Dr
Length: 0.25 miles
Directions: E-W, N-S, SW-NE
Address range: 1000 to 1199
Directions: E-W, N-S, SW-NE
Address range: 1000 to 1199
N Cherry Ave
Length: 0.22 miles
Direction: N-S
Address range: 800 to 1048
Direction: N-S
Address range: 800 to 1048
Cherry Ave
Length: 0.15 miles
Direction: N-S
Direction: N-S
E South Campus Dr
Length: 0.15 miles
Direction: E-W
Address range: 1014 to 1299
Direction: E-W
Address range: 1014 to 1299
E 5th St
Length: 0.12 miles
Directions: E-W, N-S
Address range: 900 to 1498
Directions: E-W, N-S
Address range: 900 to 1498
N Vine Ave
Length: 0.12 miles
Direction: N-S
Address range: 1000 to 1098
Direction: N-S
Address range: 1000 to 1098
N Mountain Ave
Length: 0.11 miles
Direction: N-S
Address range: 1000 to 1049
Direction: N-S
Address range: 1000 to 1049
N Martin Ave
Length: 0.11 miles
Direction: N-S
Address range: 1000 to 1099
Direction: N-S
Address range: 1000 to 1099
E Hawthorne St
Length: 0.10 miles
Direction: E-W
Direction: E-W
Martin Ave
Length: 0.07 miles
Direction: N-S
Direction: N-S
N Santa Rita Ave
Length: 0.06 miles
Direction: N-S
Address range: 500 to 599
Direction: N-S
Address range: 500 to 599
N Fremont Ave
Length: 0.06 miles
Direction: N-S
Address range: 500 to 599
Direction: N-S
Address range: 500 to 599
Vine Ave
Length: 0.05 miles
Direction: N-S
Direction: N-S
Santa Rita Ave
Length: 0.02 miles
Direction: N-S
Direction: N-S