Ventura neighborhood in Palo Alto, California (CA), 94306 detailed profile
Settings
X

Business Search - 14 Million verified businesses
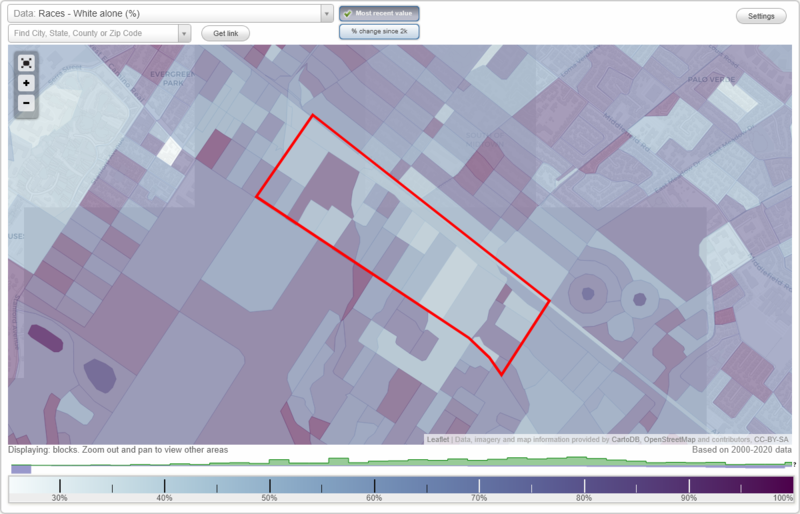
Area: 0.332 square miles
Population: 2,579
Population density:
| Ventura: | 7,766 people per square mile |
| Palo Alto: | 2,789 people per square mile |

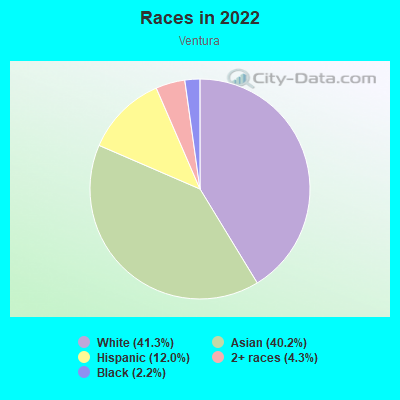
- 1,14841.3%White
- 1,11940.2%Asian
- 33512.0%Hispanic or Latino
- 1204.3%Two or more races
- 612.2%Black
Median household income in 2022:
| Ventura: | $204,692 |
| Palo Alto: | $179,707 |
Distribution of median household income
![Distribution of median household income]()
- 66Less than $10,000
- 77$10,000 to $19,999
- 167$20,000 to $29,999
- 72$30,000 to $39,999
- 61$40,000 to $49,999
- 86$50,000 to $59,999
- 56$60,000 to $74,999
- 134$75,000 to $99,999
- 57$100,000 to $124,999
- 47$125,000 to $149,999
- 169$150,000 to $199,999
- 647$200,000 or more

Distribution of owner-occupied house/condo value
![Distribution of owner-occupied house/condo value]()
- 25$150,000 to $199,999
- 20$400,000 to $499,999
- 11$500,000 to $749,999
- 50$750,000 to $999,999
- 435$1,000,000 or more

Distribution of rent paid by renters
![Distribution of rent paid by renters]()
- 103Less than $100
- 63$200 to $299
- 13$300 to $399
- 26$400 to $499
- 21$1,000 to $1,249
- 42$1,250 to $1,499
- 32$1,500 to $1,999
- 756$2,000 or more

Median rent in 2022:
| Ventura: | $2,604 |
| Palo Alto: | $2,001 |
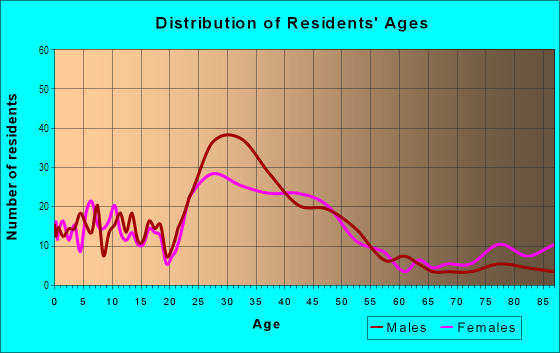
| Males: | 1,249 |
| Females: | 1,330 |
Males:
| This neighborhood: | 38.9 years |
| Whole city: | 47.1 years |
| This neighborhood: | 41.2 years |
| Whole city: | 48.1 years |
Average household size:
| Ventura: | 2.4 people |
| Palo Alto: | 2.3 people |
Percentage of family households:
| Ventura: | 37.6% |
| Palo Alto: | 42.2% |
| Here: | 43.3% |
| Palo Alto: | 52.1% |
Percentage of married-couple families with children (among all households):
| Ventura: | 46.6% |
| Palo Alto: | 37.5% |
Percentage of single-mother households (among all households):
| Ventura: | 7.3% |
| Palo Alto: | 3.5% |
Percentage of never married males 15 years old and over:
Percentage of never married females 15 years old and over:
| Ventura: | 18.4% |
| Palo Alto: | 17.4% |
Percentage of never married females 15 years old and over:
| Ventura: | 21.0% |
| city: | 11.8% |
Percentage of people that speak English not well or not at all:
| Ventura: | 3.0% |
| Palo Alto: | 3.7% |
Percentage of people born in this state:
Percentage of people born in another U.S. state:
Percentage of native residents but born outside the U.S.:
Percentage of foreign born residents:
| Here: | 32.0% |
| Palo Alto: | 36.4% |
Percentage of people born in another U.S. state:
| Ventura: | 24.8% |
| Palo Alto: | 28.3% |
Percentage of native residents but born outside the U.S.:
| Here: | 1.6% |
| city: | 3.7% |
Percentage of foreign born residents:
| Here: | 41.6% |
| Palo Alto: | 31.6% |
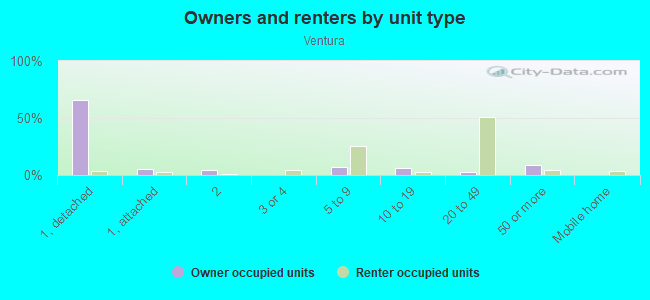
Owner-occupied
Renter-occupied

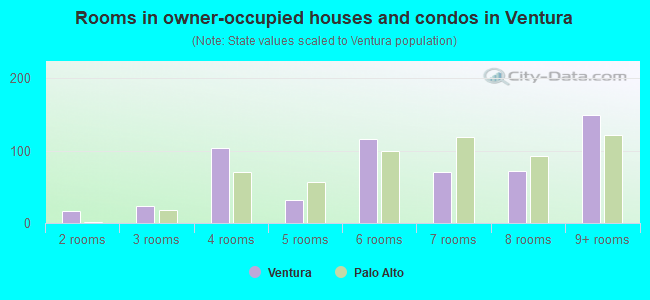
- Rooms in owner-occupied houses and condos in Ventura
- 01 room
- 162 rooms
- 233 rooms
- 1044 rooms
- 325 rooms
- 1166 rooms
- 717 rooms
- 728 rooms
- 1499+ rooms
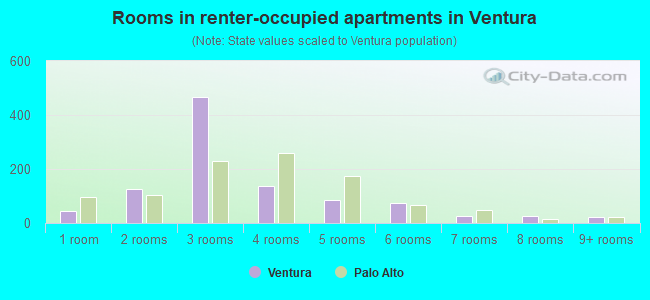
- Rooms in renter-occupied apartments in Ventura
- 461 room
- 1262 rooms
- 4683 rooms
- 1384 rooms
- 855 rooms
- 756 rooms
- 257 rooms
- 278 rooms
- 219+ rooms
Owner-occupied
Renter-occupied
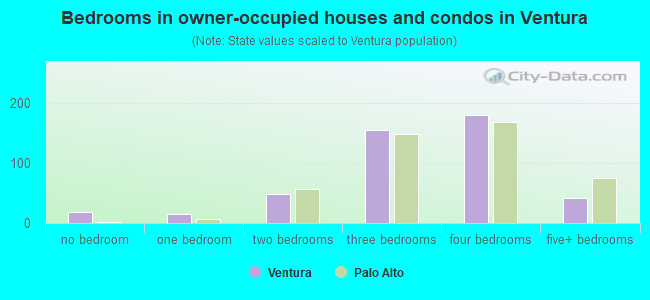
- Bedrooms in owner-occupied houses and condos in Ventura
- 18no bedroom
- 151 bedroom
- 492 bedrooms
- 1553 bedrooms
- 1804 bedrooms
- 415+ bedrooms
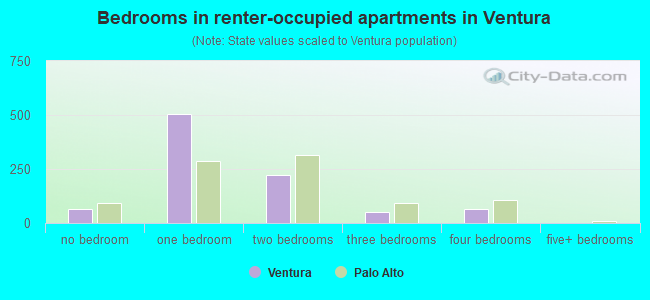
- Bedrooms in renter-occupied apartments in Ventura
- 63no bedroom
- 5041 bedroom
- 2202 bedrooms
- 513 bedrooms
- 644 bedrooms
- 05+ bedrooms
Average number of cars or other vehicles available in houses/condos:
Average number of cars or other vehicles available in apartments:
| This neighborhood: | 2.3 |
| Palo Alto: | 2.1 |
Average number of cars or other vehicles available in apartments:
| Here: | 1.2 |
| city: | 1.1 |
Percentage of units with a mortgage:
| Ventura: | 66.9% |
| Palo Alto: | 58.3% |
Average estimated value of detached houses in 2022 (32.5% of all units):
| Ventura: | $2,762,721 |
| California: | $988,808 |
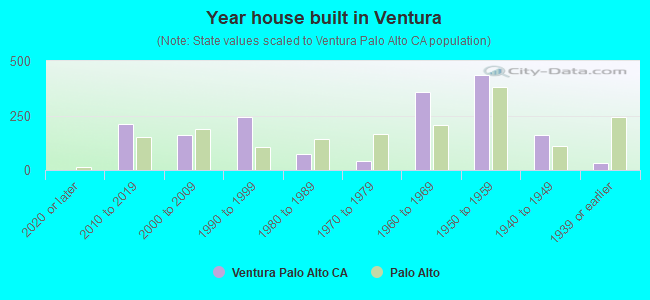
- Year house built in Ventura
- 02020 or later
- 2102010 to 2019
- 1592000 to 2009
- 2411990 to 1999
- 751980 to 1989
- 391970 to 1979
- 3581960 to 1969
- 4341950 to 1959
- 1601940 to 1949
- 301939 or earlier
City-data.com crime index for city in 2020 (higher means more crime):
| City: | 180.8 |
| U.S. average: | 219.5 |
Travel time to work (commute)
![Travel time to work (commute)]()
- 7Less than 5 minutes
- 245 to 9 minutes
- 21310 to 14 minutes
- 20715 to 19 minutes
- 31620 to 24 minutes
- 9025 to 29 minutes
- 19830 to 34 minutes
- 2435 to 39 minutes
- 6740 to 44 minutes
- 7445 to 59 minutes
- 2760 to 89 minutes
- 1590 or more minutes

Means of transportation to work
![Means of transportation to work]()
- 54.6%865Drove a car alone
- 10.1%160Carpooled
- 8.1%129Bus
- 4.7%75Subway or elevated rail
- 4.1%65Long-distance train or commuter rail
- 2.5%40Taxi
- 6.5%103Bicycle
- 3.6%57Walked
- 1.9%30Other means
- 28.7%455Worked at home

Time leaving home to go to work
![Time leaving home to go to work]()
- 3812:00 a.m. to 4:59 a.m.
- 55:00 a.m. to 5:29 a.m.
- 255:30 a.m. to 5:59 a.m.
- 826:00 a.m. to 6:29 a.m.
- 276:30 a.m. to 6:59 a.m.
- 447:00 a.m. to 7:29 a.m.
- 657:30 a.m. to 7:59 a.m.
- 2598:00 a.m. to 8:29 a.m.
- 1558:30 a.m. to 8:59 a.m.
- 3859:00 a.m. to 9:59 a.m.
- 9610:00 a.m. to 10:59 a.m.
- 911:00 a.m. to 11:59 a.m.
- 5312:00 p.m. to 3:59 p.m.
- 74:00 p.m. to 11:59 p.m.

Occupations of males:
- Percentage of males in management occupations (except farmers):
Here: 13.1% city: 19.1%
- Percentage of males in business and financial operations occupations:
Here: 7.3% city: 7.0%
- Percentage of males in computer and mathematical occupations:
Here: 12.7% city: 22.2%
- Percentage of males in architecture and engineering occupations:
Here: 22.7% city: 10.1%
- Percentage of males in life, physical, and social science occupations:
Here: 6.0% city: 6.4%
- Percentage of males in community and social services occupations:
Here: 1.5% city: 0.8%
- Percentage of males in education, training, and library occupations:
Here: 4.1% city: 7.2%
- Percentage of males in arts, design, entertainment, sports, and media occupations:
Here: 7.1% city: 3.2%
- Percentage of males in sales and office occupations:
Here: 7.7% city: 5.7%
- Percentage of males in construction, extraction, and maintenance occupations:
Here: 2.7% city: 1.7%
- Percentage of males in production occupations:
Here: 4.9% city: 1.4%
- Percentage of males in transportation occupations:
Here: 6.9% city: 0.9%
Occupations of females:
- Percentage of females in management occupations (except farmers):
Here: 6.8% city: 19.0%
- Percentage of females in business and financial operations occupations:
Here: 2.5% city: 8.3%
- Percentage of females in computer and mathematical occupations:
Here: 5.1% city: 8.6%
- Percentage of females in architecture and engineering occupations:
Here: 3.5% city: 4.0%
- Percentage of females in life, physical, and social science occupations:
Here: 15.3% city: 6.8%
- Percentage of females in community and social services occupations:
Here: 8.1% city: 1.3%
- Percentage of females in legal occupations:
Here: 16.2% city: 4.8%
- Percentage of females in education, training, and library occupations:
Here: 13.6% city: 12.9%
- Percentage of females in arts, design, entertainment, sports, and media occupations:
Here: 6.2% city: 4.3%
- Percentage of females in healthcare practitioners and technical occupations:
Here: 1.7% city: 8.7%
- Percentage of females in service occupations:
Here: 11.7% city: 8.4%
- Percentage of females in sales and office occupations:
Here: 6.4% city: 11.7%
- Percentage of females in production occupations:
Here: 2.9% city: 0.8%
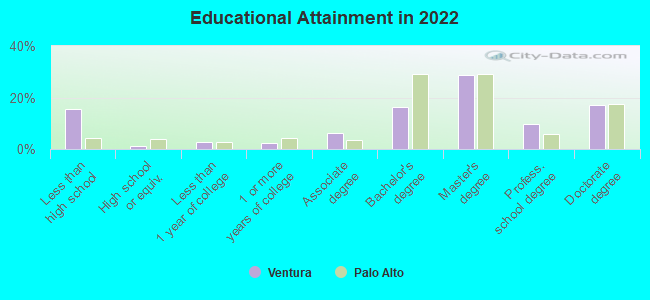
Education in this neighborhood (subdivision or community):
- Percentage of people 3 years and older in K-12 schools:
Ventura: 25.1% Palo Alto: 14.2%
- Percentage of people 3 years and older in undergraduate colleges:
Ventura: 4.3% Palo Alto: 2.4%
- Percentage of people 3 years and older in grad. or professional schools:
Ventura: 5.7% Palo Alto: 2.8%
- Percentage of students K-12 enrolled in private schools:
Ventura: 29.2% Palo Alto: 22.1%
Percentage of population below poverty level:
| Ventura: | 2.8% |
| Palo Alto: | 4.5% |
Median year owner moved in (as recorded in 2022):
Median year renter moved in (as recorded in 2022):
| Ventura: | 2001 |
| Palo Alto: | 2001 |
Median year renter moved in (as recorded in 2022):
| Ventura: | 2018 |
| Palo Alto: | 2019 |
Percentage of married-couple families with both working:
| Ventura: | 87.2% |
| Palo Alto: | 68.5% |
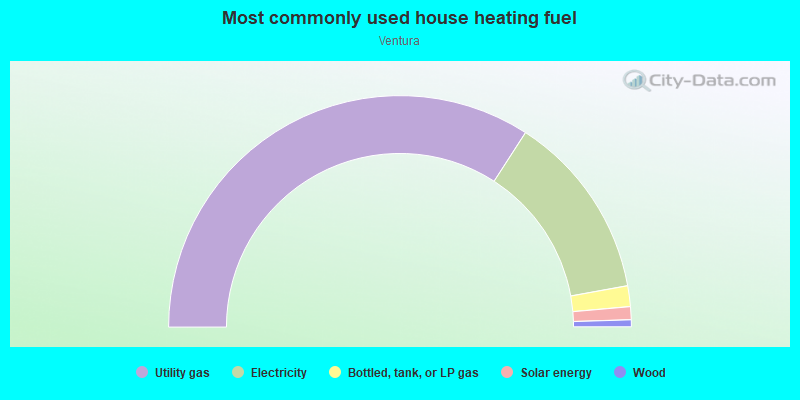
- 68.2%Utility gas
- 26.0%Electricity
- 2.9%Bottled, tank, or LP gas
- 1.8%Solar energy
- 1.0%Wood
Roads and streets:
Park Blvd
Length: 1.14 miles
Direction: SE-NW
Address range: 2990 to 4099
Direction: SE-NW
Address range: 2990 to 4099
Alma St
Length: 0.68 miles
Direction: SE-NW
Address range: 3100 to 3599
Direction: SE-NW
Address range: 3100 to 3599
Ash St
Length: 0.29 miles
Direction: SE-NW
Address range: 2900 to 3399
Direction: SE-NW
Address range: 2900 to 3399
Lambert Ave
Length: 0.29 miles
Directions: N-S, SW-NE
Address range: 200 to 499
Directions: N-S, SW-NE
Address range: 200 to 499
W Meadow Dr
Length: 0.28 miles
Direction: SW-NE
Address range: 100 to 499
Direction: SW-NE
Address range: 100 to 499
Matadero Ave
Length: 0.27 miles
Direction: SW-NE
Address range: 200 to 499
Direction: SW-NE
Address range: 200 to 499
Curtner Ave
Length: 0.26 miles
Direction: SW-NE
Address range: 200 to 499
Direction: SW-NE
Address range: 200 to 499
Ventura Ave
Length: 0.24 miles
Direction: SW-NE
Address range: 200 to 499
Direction: SW-NE
Address range: 200 to 499
Orinda St
Length: 0.21 miles
Direction: SE-NW
Address range: 3400 to 3699
Direction: SE-NW
Address range: 3400 to 3699
2nd St
Length: 0.19 miles
Direction: SE-NW
Address range: 3900 to 4099
Direction: SE-NW
Address range: 3900 to 4099
Chestnut Ave
Length: 0.17 miles
Directions: E-W, SE-NW, SW-NE
Address range: 200 to 399
Directions: E-W, SE-NW, SW-NE
Address range: 200 to 399
Olive Ave
Length: 0.17 miles
Direction: SW-NE
Address range: 200 to 399
Direction: SW-NE
Address range: 200 to 399
el Camino Way
Length: 0.16 miles
Directions: N-S, SE-NW
Address range: 4026 to 4099
Directions: N-S, SE-NW
Address range: 4026 to 4099
Maclane St
Length: 0.15 miles
Direction: SW-NE
Address range: 200 to 499
Direction: SW-NE
Address range: 200 to 499
Wilkie Way
Length: 0.14 miles
Directions: E-W, SE-NW
Address range: 4000 to 4099
Directions: E-W, SE-NW
Address range: 4000 to 4099
Portage Ave
Length: 0.13 miles
Direction: SW-NE
Address range: 200 to 499
Direction: SW-NE
Address range: 200 to 499
Pepper Ave
Length: 0.13 miles
Direction: SW-NE
Address range: 400 to 499
Direction: SW-NE
Address range: 400 to 499
Birch St
Length: 0.12 miles
Direction: SE-NW
Address range: 3300 to 3399
Direction: SE-NW
Address range: 3300 to 3399
Fernando Ave
Length: 0.12 miles
Direction: SW-NE
Address range: 200 to 350
Direction: SW-NE
Address range: 200 to 350
Margarita Ave
Length: 0.11 miles
Direction: SW-NE
Address range: 200 to 299
Direction: SW-NE
Address range: 200 to 299
Wilton Ave
Length: 0.10 miles
Direction: SW-NE
Address range: 200 to 299
Direction: SW-NE
Address range: 200 to 299
Ventura Ct
Length: 0.07 miles
Direction: SE-NW
Address range: 3900 to 3999
Direction: SE-NW
Address range: 3900 to 3999
Jacobs Ct
Length: 0.06 miles
Direction: SW-NE
Address range: 400 to 499
Direction: SW-NE
Address range: 400 to 499
Madeline Ct
Length: 0.05 miles
Direction: SE-NW
Address range: 300 to 399
Direction: SE-NW
Address range: 300 to 399
Acacia Ave
Length: 0.04 miles
Direction: SW-NE
Address range: 400 to 499
Direction: SW-NE
Address range: 400 to 499
Vista Ave
Length: 0.03 miles
Direction: SW-NE
Direction: SW-NE
Railroad features:
Union Pacific RR
Length: 1.23 miles
Direction: SE-NW
Direction: SE-NW
Other features:
Matadero Crk
Length: 0.26 miles
Directions: E-W, N-S, SW-NE
Directions: E-W, N-S, SW-NE
Barron Crk
Length: 0.25 miles
Directions: E-W, N-S, SE-NW, SW-NE
Directions: E-W, N-S, SE-NW, SW-NE