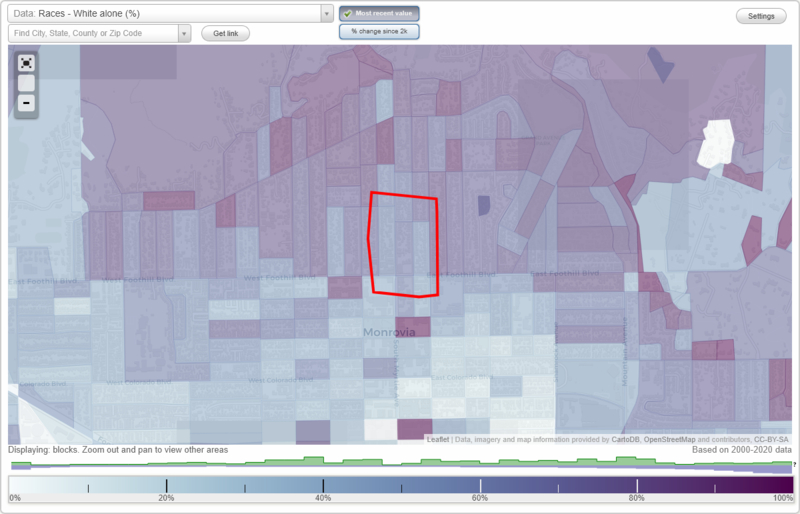
Victoria Place neighborhood in Monrovia, California (CA), 91016 detailed profile
Settings
X

Business Search - 14 Million verified businesses
Area: 0.090 square miles
Population: 508
Population density:
| Victoria Place: | 5,638 people per square mile |
| Monrovia: | 2,739 people per square mile |

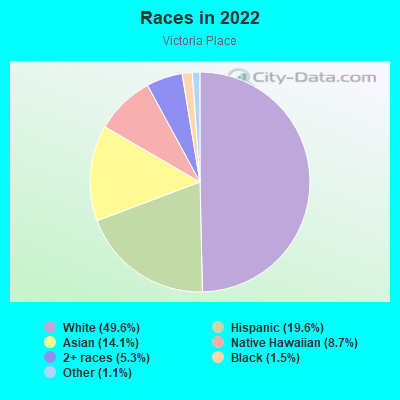
- 26149.6%White
- 10319.6%Hispanic or Latino
- 7414.1%Asian
- 468.7%Native Hawaiian and Other
Pacific Islander - 285.3%Two or more races
- 81.5%Black
- 61.1%Some other race
Median household income in 2022:
| Victoria Place: | $102,872 |
| Monrovia: | $93,827 |
Distribution of median household income
![Distribution of median household income]()
- 9Less than $10,000
- 99$10,000 to $19,999
- 45$20,000 to $29,999
- 23$30,000 to $39,999
- 74$40,000 to $49,999
- 2$50,000 to $59,999
- 16$60,000 to $74,999
- 11$75,000 to $99,999
- 31$100,000 to $124,999
- 18$125,000 to $149,999
- 21$150,000 to $199,999
- 71$200,000 or more

Distribution of owner-occupied house/condo value
![Distribution of owner-occupied house/condo value]()
- 7Less than $50,000
- 7$100,000 to $149,999
- 8$400,000 to $499,999
- 17$500,000 to $749,999
- 71$750,000 to $999,999
- 117$1,000,000 or more

Distribution of rent paid by renters
![Distribution of rent paid by renters]()
- 23$300 to $399
- 13$900 to $999
- 8$1,000 to $1,249
- 96$1,250 to $1,499
- 59$1,500 to $1,999
- 27$2,000 or more

Median rent in 2022:
| Victoria Place: | $1,734 |
| Monrovia: | $1,836 |
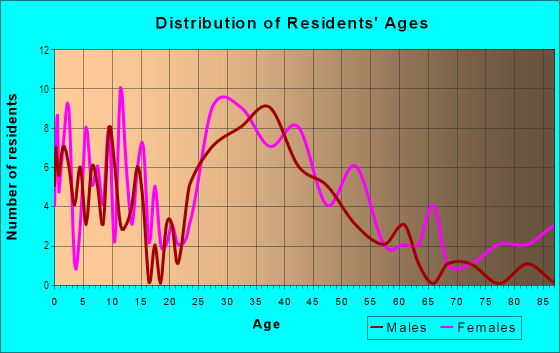
| Males: | 243 |
| Females: | 265 |
Males:
| This neighborhood: | 48.1 years |
| Whole city: | 36.5 years |
| This neighborhood: | 45.5 years |
| Whole city: | 39.9 years |
Average household size:
| Victoria Place: | 10.4 people |
| Monrovia: | 2.8 people |
Percentage of family households:
| Victoria Place: | 35.5% |
| Monrovia: | 50.1% |
| Here: | 31.3% |
| Monrovia: | 44.8% |
Percentage of married-couple families with children (among all households):
| Victoria Place: | 30.5% |
| Monrovia: | 26.4% |
Percentage of single-mother households (among all households):
| Victoria Place: | 14.4% |
| Monrovia: | 6.7% |
Percentage of never married males 15 years old and over:
Percentage of never married females 15 years old and over:
| Victoria Place: | 13.3% |
| Monrovia: | 20.0% |
Percentage of never married females 15 years old and over:
| Victoria Place: | 21.1% |
| city: | 17.2% |
Percentage of people that speak English not well or not at all:
| Victoria Place: | 1.6% |
| Monrovia: | 4.8% |
Percentage of people born in this state:
Percentage of people born in another U.S. state:
Percentage of native residents but born outside the U.S.:
Percentage of foreign born residents:
| Here: | 58.1% |
| Monrovia: | 60.6% |
Percentage of people born in another U.S. state:
| Victoria Place: | 21.3% |
| Monrovia: | 13.3% |
Percentage of native residents but born outside the U.S.:
| Here: | 0.9% |
| city: | 0.8% |
Percentage of foreign born residents:
| Here: | 19.7% |
| Monrovia: | 25.2% |
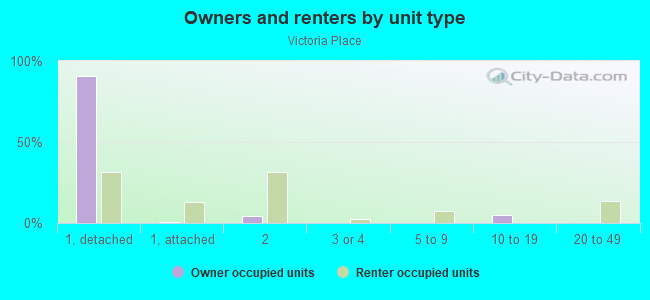
Owner-occupied
Renter-occupied

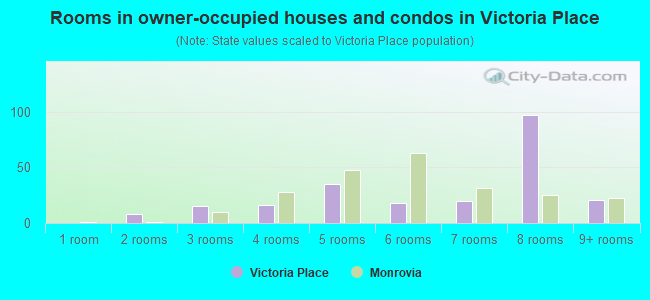
- Rooms in owner-occupied houses and condos in Victoria Place
- 01 room
- 82 rooms
- 153 rooms
- 164 rooms
- 355 rooms
- 186 rooms
- 207 rooms
- 978 rooms
- 219+ rooms
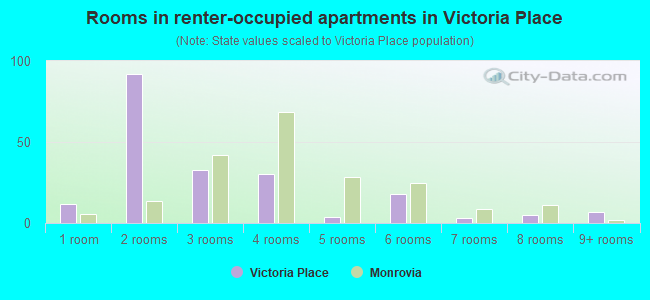
- Rooms in renter-occupied apartments in Victoria Place
- 121 room
- 922 rooms
- 333 rooms
- 304 rooms
- 45 rooms
- 186 rooms
- 37 rooms
- 58 rooms
- 79+ rooms
Owner-occupied
Renter-occupied
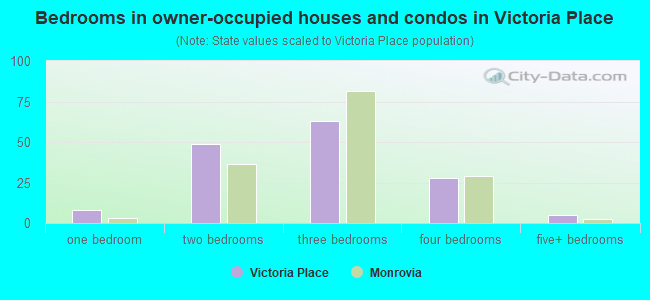
- Bedrooms in owner-occupied houses and condos in Victoria Place
- 0no bedroom
- 81 bedroom
- 492 bedrooms
- 633 bedrooms
- 284 bedrooms
- 55+ bedrooms
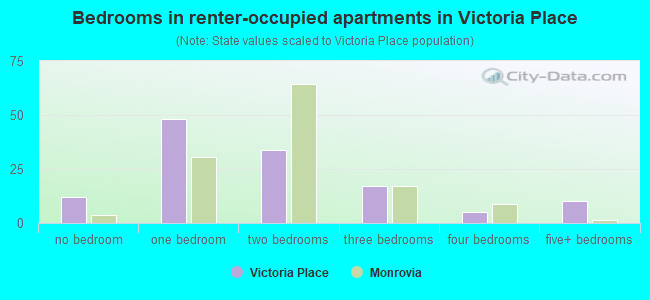
- Bedrooms in renter-occupied apartments in Victoria Place
- 12no bedroom
- 481 bedroom
- 342 bedrooms
- 173 bedrooms
- 54 bedrooms
- 105+ bedrooms
Average number of cars or other vehicles available in houses/condos:
Average number of cars or other vehicles available in apartments:
| This neighborhood: | 1.8 |
| Monrovia: | 2.2 |
Average number of cars or other vehicles available in apartments:
| Here: | 1.2 |
| city: | 1.8 |
Percentage of units with a mortgage:
| Victoria Place: | 86.5% |
| Monrovia: | 65.1% |
Average estimated value of detached houses in 2022 (76.9% of all units):
| Victoria Place: | $1,205,917 |
| Monrovia: | $952,225 |
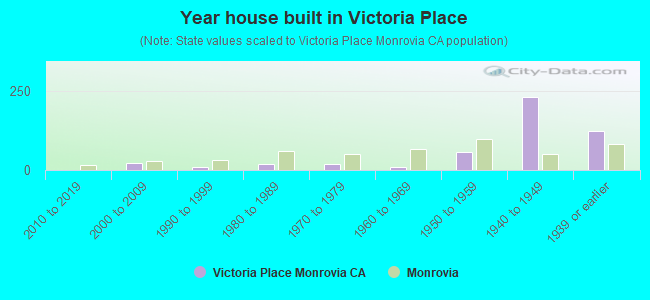
- Year house built in Victoria Place
- 02020 or later
- 12010 to 2019
- 212000 to 2009
- 101990 to 1999
- 181980 to 1989
- 201970 to 1979
- 91960 to 1969
- 561950 to 1959
- 2301940 to 1949
- 1241939 or earlier
City-data.com crime index for city in 2020 (higher means more crime):
| City: | 183.5 |
| U.S. average: | 219.5 |
Travel time to work (commute)
![Travel time to work (commute)]()
- 6Less than 5 minutes
- 185 to 9 minutes
- 2710 to 14 minutes
- 3515 to 19 minutes
- 1320 to 24 minutes
- 1525 to 29 minutes
- 3230 to 34 minutes
- 835 to 39 minutes
- 1240 to 44 minutes
- 6145 to 59 minutes
- 3260 to 89 minutes
- 1490 or more minutes

Means of transportation to work
![Means of transportation to work]()
- 79.1%213Drove a car alone
- 9.7%26Carpooled
- 1.1%3Subway or elevated rail
- 0.7%2Motorcycle
- 1.1%3Walked
- 0.4%1Other means
- 18.9%51Worked at home

Time leaving home to go to work
![Time leaving home to go to work]()
- 412:00 a.m. to 4:59 a.m.
- 55:00 a.m. to 5:29 a.m.
- 185:30 a.m. to 5:59 a.m.
- 86:00 a.m. to 6:29 a.m.
- 236:30 a.m. to 6:59 a.m.
- 297:00 a.m. to 7:29 a.m.
- 257:30 a.m. to 7:59 a.m.
- 558:00 a.m. to 8:29 a.m.
- 278:30 a.m. to 8:59 a.m.
- 359:00 a.m. to 9:59 a.m.
- 910:00 a.m. to 10:59 a.m.
- 311:00 a.m. to 11:59 a.m.
- 1112:00 p.m. to 3:59 p.m.
- 14:00 p.m. to 11:59 p.m.

Occupations of males:
- Percentage of males in management occupations (except farmers):
Here: 11.1% city: 12.7%
- Percentage of males in business and financial operations occupations:
Here: 19.9% city: 3.1%
- Percentage of males in architecture and engineering occupations:
Here: 4.7% city: 4.8%
- Percentage of males in life, physical, and social science occupations:
Here: 3.1% city: 1.4%
- Percentage of males in community and social services occupations:
Here: 5.0% city: 1.4%
- Percentage of males in legal occupations:
Here: 2.6% city: 1.4%
- Percentage of males in education, training, and library occupations:
Here: 7.5% city: 5.1%
- Percentage of males in arts, design, entertainment, sports, and media occupations:
Here: 12.9% city: 4.2%
- Percentage of males in healthcare practitioners and technical occupations:
Here: 13.5% city: 4.5%
- Percentage of males in service occupations:
Here: 7.9% city: 13.0%
- Percentage of males in sales and office occupations:
Here: 8.8% city: 19.9%
- Percentage of males in construction, extraction, and maintenance occupations:
Here: 8.4% city: 10.7%
- Percentage of males in production occupations:
Here: 5.0% city: 4.8%
- Percentage of males in transportation occupations:
Here: 1.5% city: 4.1%
- Percentage of males in material moving occupations:
Here: 3.3% city: 2.7%
Occupations of females:
- Percentage of females in management occupations (except farmers):
Here: 16.2% city: 13.3%
- Percentage of females in business and financial operations occupations:
Here: 1.4% city: 5.5%
- Percentage of females in computer and mathematical occupations:
Here: 3.4% city: 2.4%
- Percentage of females in architecture and engineering occupations:
Here: 1.0% city: 0.4%
- Percentage of females in community and social services occupations:
Here: 2.2% city: 4.3%
- Percentage of females in legal occupations:
Here: 2.7% city: 1.1%
- Percentage of females in education, training, and library occupations:
Here: 12.2% city: 11.6%
- Percentage of females in arts, design, entertainment, sports, and media occupations:
Here: 15.6% city: 4.0%
- Percentage of females in healthcare practitioners and technical occupations:
Here: 15.8% city: 9.7%
- Percentage of females in service occupations:
Here: 21.1% city: 16.1%
- Percentage of females in sales and office occupations:
Here: 6.5% city: 26.0%
- Percentage of females in production occupations:
Here: 2.9% city: 2.5%
- Percentage of females in transportation occupations:
Here: 1.3% city: 0.9%
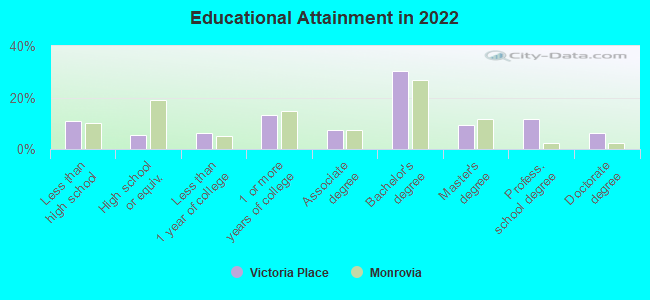
Education in this neighborhood (subdivision or community):
- Percentage of people 3 years and older in K-12 schools:
Victoria Place: 24.7% Monrovia: 16.9%
- Percentage of people 3 years and older in undergraduate colleges:
Victoria Place: 2.8% Monrovia: 5.6%
- Percentage of people 3 years and older in grad. or professional schools:
Victoria Place: 1.2% Monrovia: 2.0%
- Percentage of students K-12 enrolled in private schools:
Victoria Place: 36.6% Monrovia: 10.9%
Percentage of population below poverty level:
| Victoria Place: | 8.3% |
| Monrovia: | 10.1% |
Median year owner moved in (as recorded in 2022):
Median year renter moved in (as recorded in 2022):
| Victoria Place: | 2010 |
| Monrovia: | 2004 |
Median year renter moved in (as recorded in 2022):
| Victoria Place: | 2015 |
| Monrovia: | 2015 |
Percentage of married-couple families with both working:
| Victoria Place: | 109.3% |
| Monrovia: | 64.0% |
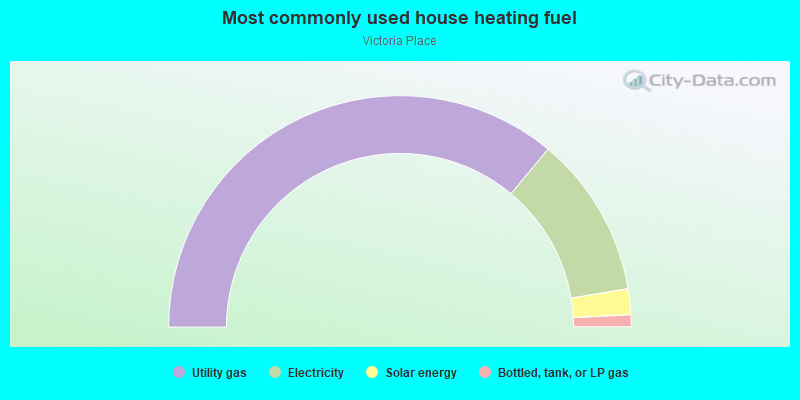
- 72.2%Utility gas
- 22.6%Electricity
- 3.6%Solar energy
- 1.7%Bottled, tank, or LP gas
Roads and streets:
N Myrtle Ave
Length: 0.26 miles
Direction: N-S
Address range: 100 to 223
Direction: N-S
Address range: 100 to 223
Stedman Pl
Length: 0.26 miles
Direction: N-S
Address range: 100 to 219
Direction: N-S
Address range: 100 to 219
N Ivy Ave
Length: 0.20 miles
Direction: N-S
Address range: 100 to 199
Direction: N-S
Address range: 100 to 199
N Encinitas Ave
Length: 0.20 miles
Direction: N-S
Address range: 100 to 199
Direction: N-S
Address range: 100 to 199
E Foothill Blvd
Length: 0.15 miles
Direction: E-W
Address range: 100 to 199
Direction: E-W
Address range: 100 to 199
Cedar Ave
Length: 0.15 miles
Direction: E-W
Address range: 100 to 199
Direction: E-W
Address range: 100 to 199
Oaks Ave
Length: 0.08 miles
Direction: E-W
Address range: 100 to 125
Direction: E-W
Address range: 100 to 125
W Foothill Blvd
Length: 0.08 miles
Direction: E-W
Address range: 100 to 129
Direction: E-W
Address range: 100 to 129
S Myrtle Ave
Length: 0.01 miles
Direction: N-S
Address range: 100 to 113
Direction: N-S
Address range: 100 to 113