Vista del Lago neighborhood in Mission Viejo, California (CA), 92691 detailed profile
Settings
X

Business Search - 14 Million verified businesses
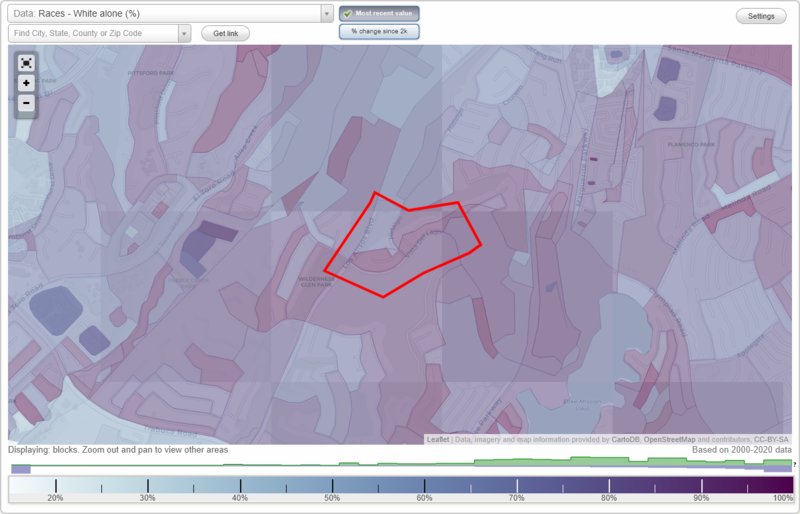
Area: 0.126 square miles
Population: 502
Population density:
| Vista del Lago: | 3,970 people per square mile |
| Mission Viejo: | 4,919 people per square mile |

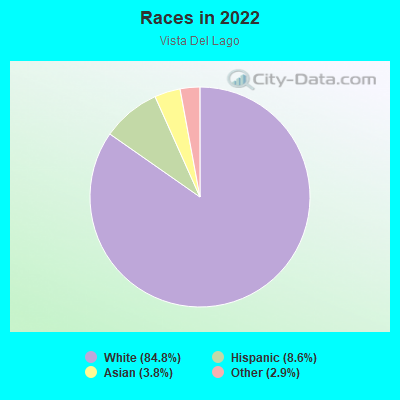
- 35770.8%White
- 5811.5%Hispanic or Latino
- 5711.3%Asian
- 234.6%Two or more races
- 81.6%Black
- 10.2%Some other race
Median household income in 2022:
| Vista del Lago: | $138,473 |
| Mission Viejo: | $126,469 |
Distribution of median household income
![Distribution of median household income]()
- 7Less than $10,000
- 3$10,000 to $19,999
- 7$20,000 to $29,999
- 5$30,000 to $39,999
- 9$40,000 to $49,999
- 2$50,000 to $59,999
- 6$60,000 to $74,999
- 17$75,000 to $99,999
- 28$100,000 to $124,999
- 26$125,000 to $149,999
- 37$150,000 to $199,999
- 42$200,000 or more

Distribution of owner-occupied house/condo value
![Distribution of owner-occupied house/condo value]()
- 7Less than $50,000
- 4$50,000 to $99,999
- 7$100,000 to $149,999
- 4$300,000 to $399,999
- 6$400,000 to $499,999
- 26$500,000 to $749,999
- 67$750,000 to $999,999
- 43$1,000,000 or more

Distribution of rent paid by renters
![Distribution of rent paid by renters]()
- 4$800 to $899
- 2$1,000 to $1,249
- 5$1,500 to $1,999
- 28$2,000 or more

Median rent in 2022:
| Vista del Lago: | $2,963 |
| Mission Viejo: | $2,001 |
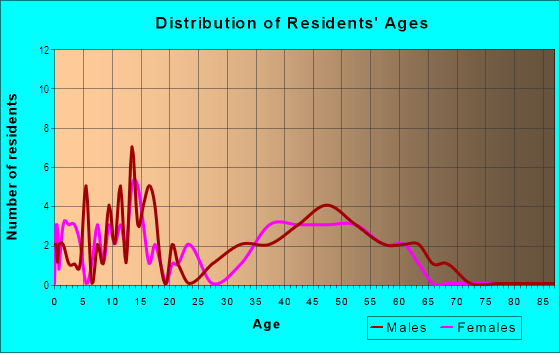
| Males: | 274 |
| Females: | 228 |
Males:
| This neighborhood: | 43.8 years |
| Whole city: | 42.6 years |
| This neighborhood: | 49.7 years |
| Whole city: | 45.6 years |
Average household size:
| Vista del Lago: | 2.9 people |
| Mission Viejo: | 2.8 people |
Percentage of family households:
| Vista del Lago: | 50.9% |
| Mission Viejo: | 50.2% |
| Here: | 74.0% |
| Mission Viejo: | 58.8% |
Percentage of married-couple families with children (among all households):
| Vista del Lago: | 32.6% |
| Mission Viejo: | 29.0% |
Percentage of single-mother households (among all households):
| Vista del Lago: | 2.2% |
| Mission Viejo: | 5.1% |
Percentage of never married males 15 years old and over:
Percentage of never married females 15 years old and over:
| Vista del Lago: | 16.4% |
| Mission Viejo: | 17.0% |
Percentage of never married females 15 years old and over:
| Vista del Lago: | 8.8% |
| city: | 12.1% |
Percentage of people that speak English not well or not at all:
| Vista del Lago: | 1.0% |
| Mission Viejo: | 3.7% |
Percentage of people born in this state:
Percentage of people born in another U.S. state:
Percentage of native residents but born outside the U.S.:
Percentage of foreign born residents:
| Here: | 56.6% |
| Mission Viejo: | 56.8% |
Percentage of people born in another U.S. state:
| Vista del Lago: | 22.3% |
| Mission Viejo: | 21.7% |
Percentage of native residents but born outside the U.S.:
| Here: | 2.3% |
| city: | 2.0% |
Percentage of foreign born residents:
| Here: | 18.9% |
| Mission Viejo: | 19.5% |
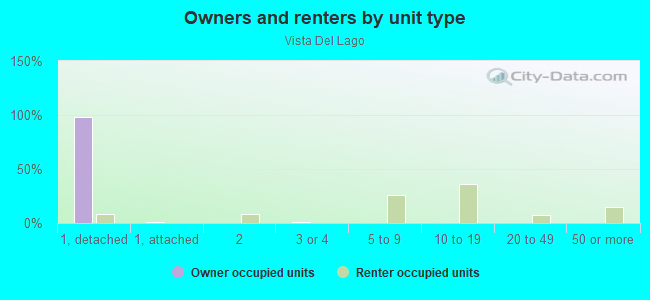
Owner-occupied
Renter-occupied

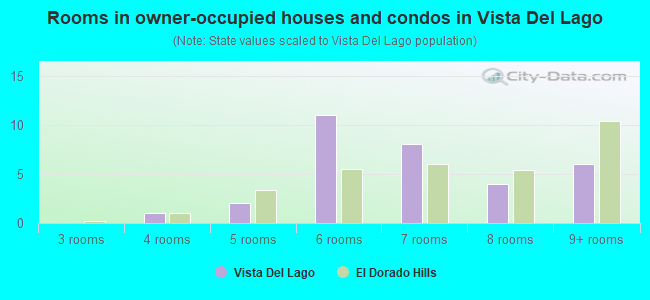
- Rooms in owner-occupied houses and condos in Vista del Lago
- 41 room
- 02 rooms
- 23 rooms
- 54 rooms
- 275 rooms
- 186 rooms
- 377 rooms
- 258 rooms
- 279+ rooms
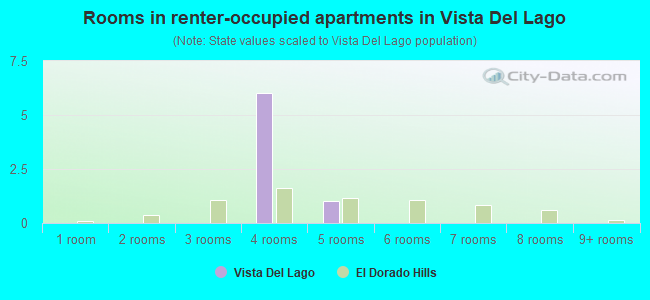
- Rooms in renter-occupied apartments in Vista del Lago
- 01 room
- 02 rooms
- 43 rooms
- 34 rooms
- 175 rooms
- 96 rooms
- 87 rooms
- 38 rooms
- 09+ rooms
Owner-occupied
Renter-occupied
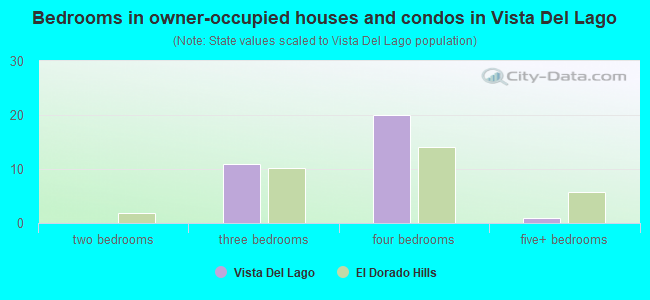
- Bedrooms in owner-occupied houses and condos in Vista del Lago
- 4no bedroom
- 31 bedroom
- 62 bedrooms
- 433 bedrooms
- 764 bedrooms
- 175+ bedrooms
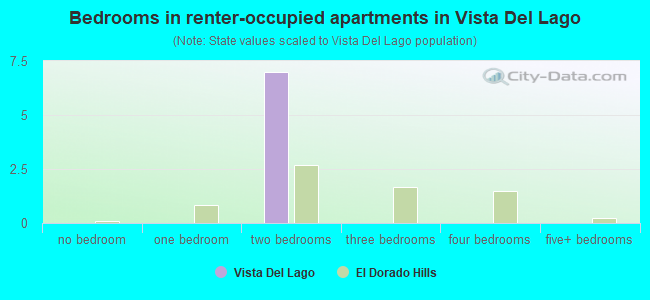
- Bedrooms in renter-occupied apartments in Vista del Lago
- 0no bedroom
- 01 bedroom
- 32 bedrooms
- 183 bedrooms
- 64 bedrooms
- 05+ bedrooms
Average number of cars or other vehicles available in houses/condos:
Average number of cars or other vehicles available in apartments:
| This neighborhood: | 2.3 |
| Mission Viejo: | 2.3 |
Average number of cars or other vehicles available in apartments:
| Here: | 1.8 |
| city: | 1.7 |
Percentage of units with a mortgage:
| Vista del Lago: | 72.2% |
| Mission Viejo: | 76.4% |
Housing prices:
- Average estimated value of detached houses in 2022 (94.2% of all units):
Vista del Lago: $969,384 California: $988,808
- Average estimated value of townhouses or other attached units in 2022 (5.2% of all units):
This neighborhood: $675,139 California: $838,546
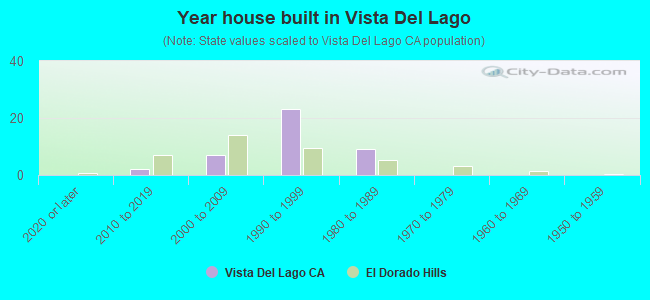
- Year house built in Vista del Lago
- 02020 or later
- 02010 to 2019
- 32000 to 2009
- 31990 to 1999
- 141980 to 1989
- 1461970 to 1979
- 51960 to 1969
- 21950 to 1959
- 31940 to 1949
- 01939 or earlier
City-data.com crime index for city in 2020 (higher means more crime):
| City: | 63.4 |
| U.S. average: | 219.5 |
Travel time to work (commute)
![Travel time to work (commute)]()
- 6Less than 5 minutes
- 115 to 9 minutes
- 3210 to 14 minutes
- 4115 to 19 minutes
- 3920 to 24 minutes
- 1825 to 29 minutes
- 2830 to 34 minutes
- 435 to 39 minutes
- 1640 to 44 minutes
- 2045 to 59 minutes
- 460 to 89 minutes
- 490 or more minutes

Means of transportation to work
![Means of transportation to work]()
- 72.0%200Drove a car alone
- 4.3%12Carpooled
- 0.4%1Bus
- 0.4%1Long-distance train or commuter rail
- 0.7%2Motorcycle
- 3.6%10Bicycle
- 5.4%15Walked
- 1.8%5Other means
- 15.8%44Worked at home

Time leaving home to go to work
![Time leaving home to go to work]()
- 812:00 a.m. to 4:59 a.m.
- 25:00 a.m. to 5:29 a.m.
- 25:30 a.m. to 5:59 a.m.
- 146:00 a.m. to 6:29 a.m.
- 236:30 a.m. to 6:59 a.m.
- 317:00 a.m. to 7:29 a.m.
- 377:30 a.m. to 7:59 a.m.
- 238:00 a.m. to 8:29 a.m.
- 138:30 a.m. to 8:59 a.m.
- 429:00 a.m. to 9:59 a.m.
- 510:00 a.m. to 10:59 a.m.
- 911:00 a.m. to 11:59 a.m.
- 712:00 p.m. to 3:59 p.m.
- 94:00 p.m. to 11:59 p.m.

Occupations of males:
- Percentage of males in management occupations (except farmers):
Here: 17.3% city: 21.8%
- Percentage of males in business and financial operations occupations:
Here: 5.4% city: 7.5%
- Percentage of males in computer and mathematical occupations:
Here: 7.6% city: 6.6%
- Percentage of males in architecture and engineering occupations:
Here: 1.3% city: 5.6%
- Percentage of males in life, physical, and social science occupations:
Here: 2.0% city: 0.8%
- Percentage of males in community and social services occupations:
Here: 1.3% city: 0.5%
- Percentage of males in legal occupations:
Here: 1.5% city: 1.7%
- Percentage of males in education, training, and library occupations:
Here: 3.1% city: 3.1%
- Percentage of males in arts, design, entertainment, sports, and media occupations:
Here: 1.8% city: 2.4%
- Percentage of males in service occupations:
Here: 9.0% city: 12.3%
- Percentage of males in sales and office occupations:
Here: 32.9% city: 19.1%
- Percentage of males in construction, extraction, and maintenance occupations:
Here: 6.9% city: 4.4%
- Percentage of males in production occupations:
Here: 1.8% city: 3.3%
- Percentage of males in transportation occupations:
Here: 2.2% city: 2.5%
- Percentage of males in material moving occupations:
Here: 2.3% city: 2.0%
Occupations of females:
- Percentage of females in management occupations (except farmers):
Here: 15.8% city: 14.1%
- Percentage of females in business and financial operations occupations:
Here: 11.6% city: 9.2%
- Percentage of females in computer and mathematical occupations:
Here: 3.7% city: 2.8%
- Percentage of females in community and social services occupations:
Here: 2.0% city: 2.6%
- Percentage of females in legal occupations:
Here: 3.1% city: 2.0%
- Percentage of females in education, training, and library occupations:
Here: 16.4% city: 9.7%
- Percentage of females in healthcare practitioners and technical occupations:
Here: 8.8% city: 8.1%
- Percentage of females in service occupations:
Here: 9.4% city: 15.1%
- Percentage of females in sales and office occupations:
Here: 26.2% city: 28.1%
- Percentage of females in farming, fishing, and forestry occupations:
Here: 1.3% city: 0.3%
Percentage of people 16-64 in Armed Forces:
| Vista del Lago: | 0.4% |
| Mission Viejo: | 0.2% |
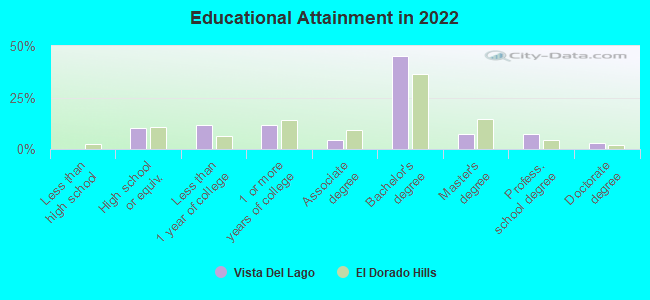
Education in this neighborhood (subdivision or community):
- Percentage of people 3 years and older in K-12 schools:
Vista del Lago: 14.3% Mission Viejo: 15.0%
- Percentage of people 3 years and older in undergraduate colleges:
Vista del Lago: 5.1% Mission Viejo: 5.6%
- Percentage of people 3 years and older in grad. or professional schools:
Vista del Lago: 1.0% Mission Viejo: 1.0%
- Percentage of students K-12 enrolled in private schools:
Vista del Lago: 15.7% Mission Viejo: 22.1%
Percentage of population below poverty level:
| Vista del Lago: | 3.8% |
| Mission Viejo: | 9.3% |
Median year owner moved in (as recorded in 2022):
Median year renter moved in (as recorded in 2022):
| Vista del Lago: | 2004 |
| Mission Viejo: | 2008 |
Median year renter moved in (as recorded in 2022):
| Vista del Lago: | 2013 |
| Mission Viejo: | 2019 |
Percentage of married-couple families with both working:
| Vista del Lago: | 87.4% |
| Mission Viejo: | 78.0% |
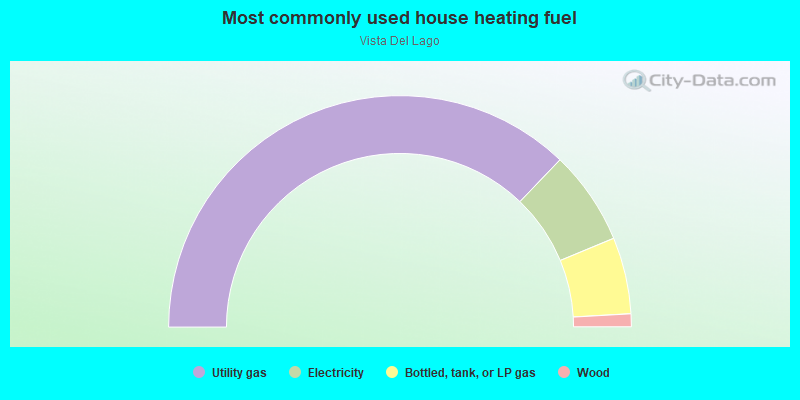
- 81.0%Utility gas
- 9.5%Electricity
- 3.8%Other fuel
- 3.4%No fuel used
- 1.6%Solar energy
- 0.7%Bottled, tank, or LP gas
Roads and streets:
Vis del Lago
Length: 0.53 miles
Directions: E-W, SE-NW, SW-NE
Address range: 27058 to 27449
Directions: E-W, SE-NW, SW-NE
Address range: 27058 to 27449
Los Alisos Blvd
Length: 0.26 miles
Directions: N-S, SW-NE
Address range: 22218 to 22351
Directions: N-S, SW-NE
Address range: 22218 to 22351
Hidalgo
Length: 0.22 miles
Directions: N-S, SE-NW, SW-NE
Address range: 22096 to 22299
Directions: N-S, SE-NW, SW-NE
Address range: 22096 to 22299
Soledad
Length: 0.13 miles
Directions: E-W, SE-NW, SW-NE
Address range: 27100 to 27299
Directions: E-W, SE-NW, SW-NE
Address range: 27100 to 27299
Abrazo
Length: 0.05 miles
Direction: SE-NW
Address range: 22100 to 22299
Direction: SE-NW
Address range: 22100 to 22299
Bosque (Basque)
Length: 0.05 miles
Direction: SE-NW
Address range: 22200 to 22299
Direction: SE-NW
Address range: 22200 to 22299
Bande
Length: 0.01 miles
Directions: N-S, SE-NW
Address range: 22100 to 22199
Directions: N-S, SE-NW
Address range: 22100 to 22199