Westhampton neighborhood in Falls Church, Virginia (VA), 22043, 22046 detailed profile
Settings
X

Business Search - 14 Million verified businesses
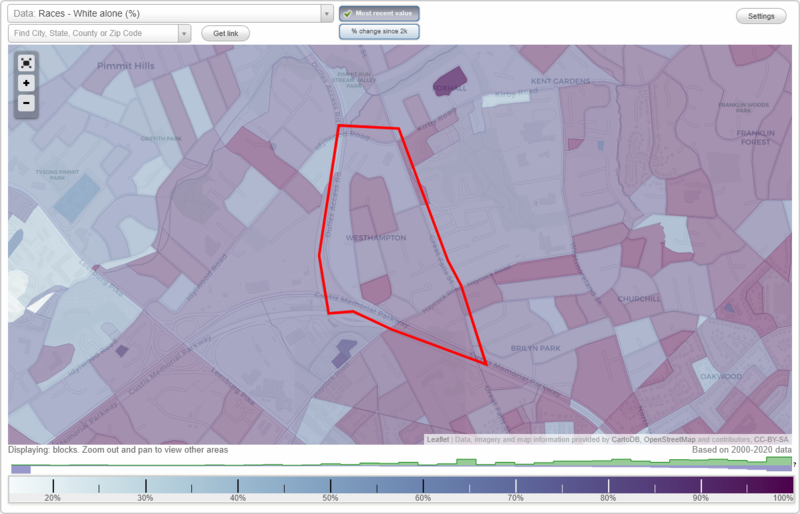
Area: 0.274 square miles
Population: 829
Population density:
| Westhampton: | 3,030 people per square mile |
| Falls Church: | 7,340 people per square mile |

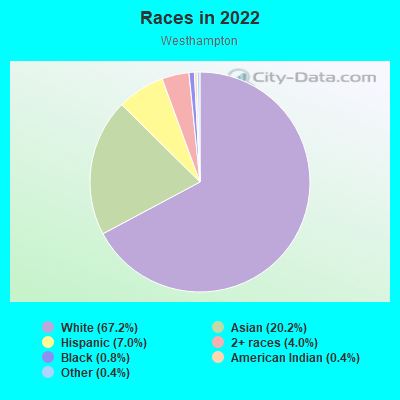
- 55867.2%White
- 16820.2%Asian
- 587.0%Hispanic or Latino
- 334.0%Two or more races
- 70.8%Black
- 30.4%American Indian
- 30.4%Some other race
Median household income in 2022:
| Westhampton: | $205,121 |
| Falls Church: | $164,536 |
Distribution of median household income
![Distribution of median household income]()
- 6Less than $10,000
- 39$10,000 to $19,999
- 69$20,000 to $29,999
- 13$30,000 to $39,999
- 13$40,000 to $49,999
- 6$50,000 to $59,999
- 7$60,000 to $74,999
- 46$75,000 to $99,999
- 31$100,000 to $124,999
- 28$125,000 to $149,999
- 30$150,000 to $199,999
- 159$200,000 or more

Distribution of owner-occupied house/condo value
![Distribution of owner-occupied house/condo value]()
- 4Less than $50,000
- 5$50,000 to $99,999
- 2$100,000 to $149,999
- 4$200,000 to $249,999
- 2$250,000 to $299,999
- 12$300,000 to $399,999
- 23$400,000 to $499,999
- 63$500,000 to $749,999
- 52$750,000 to $999,999
- 109$1,000,000 or more

Distribution of rent paid by renters
![Distribution of rent paid by renters]()
- 38$200 to $299
- 7$500 to $599
- 11$600 to $699
- 2$1,000 to $1,249
- 4$1,250 to $1,499
- 10$1,500 to $1,999
- 56$2,000 or more

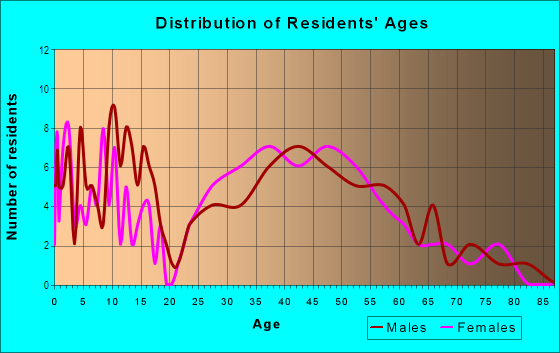
| Males: | 407 |
| Females: | 421 |
Males:
| This neighborhood: | 39.8 years |
| Whole city: | 36.7 years |
| This neighborhood: | 46.6 years |
| Whole city: | 41.5 years |
Average household size:
| Westhampton: | 2.8 people |
| Falls Church: | 2.5 people |
Percentage of family households:
| Westhampton: | 54.0% |
| Falls Church: | 46.0% |
| Here: | 57.0% |
| Falls Church: | 51.5% |
Percentage of married-couple families with children (among all households):
| Westhampton: | 33.6% |
| Falls Church: | 33.1% |
Percentage of single-mother households (among all households):
| Westhampton: | 4.5% |
| Falls Church: | 4.7% |
Percentage of never married males 15 years old and over:
Percentage of never married females 15 years old and over:
| Westhampton: | 17.9% |
| Falls Church: | 17.9% |
Percentage of never married females 15 years old and over:
| Westhampton: | 13.3% |
| city: | 16.2% |
Percentage of people that speak English not well or not at all:
| Westhampton: | 1.2% |
| Falls Church: | 2.2% |
Percentage of people born in this state:
Percentage of people born in another U.S. state:
Percentage of native residents but born outside the U.S.:
Percentage of foreign born residents:
| Here: | 23.7% |
| Falls Church: | 26.5% |
Percentage of people born in another U.S. state:
| Westhampton: | 50.5% |
| Falls Church: | 54.2% |
Percentage of native residents but born outside the U.S.:
| Here: | 1.9% |
| city: | 3.7% |
Percentage of foreign born residents:
| Here: | 23.9% |
| Falls Church: | 15.5% |
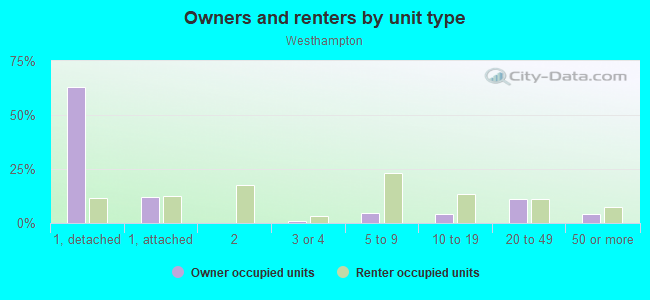
Owner-occupied
Renter-occupied

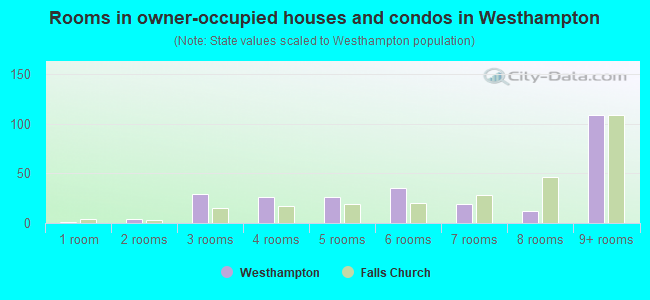
- Rooms in owner-occupied houses and condos in Westhampton
- 11 room
- 42 rooms
- 293 rooms
- 264 rooms
- 265 rooms
- 356 rooms
- 197 rooms
- 128 rooms
- 1099+ rooms
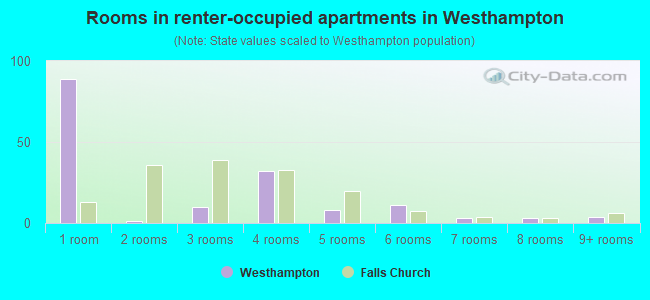
- Rooms in renter-occupied apartments in Westhampton
- 891 room
- 12 rooms
- 103 rooms
- 324 rooms
- 85 rooms
- 116 rooms
- 37 rooms
- 38 rooms
- 49+ rooms
Owner-occupied
Renter-occupied
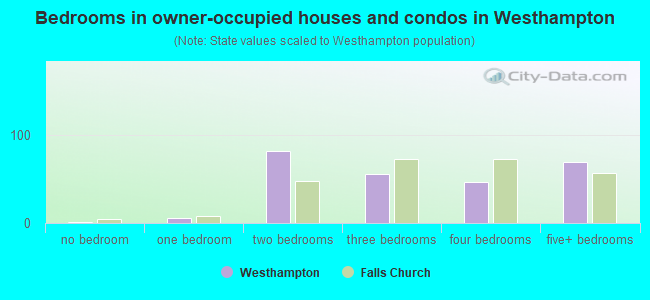
- Bedrooms in owner-occupied houses and condos in Westhampton
- 1no bedroom
- 61 bedroom
- 822 bedrooms
- 563 bedrooms
- 474 bedrooms
- 705+ bedrooms
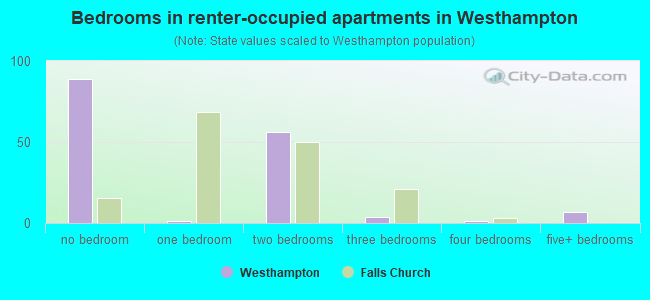
- Bedrooms in renter-occupied apartments in Westhampton
- 89no bedroom
- 11 bedroom
- 562 bedrooms
- 43 bedrooms
- 14 bedrooms
- 75+ bedrooms
Average number of cars or other vehicles available in houses/condos:
Average number of cars or other vehicles available in apartments:
| This neighborhood: | 1.9 |
| Falls Church: | 1.9 |
Average number of cars or other vehicles available in apartments:
| Here: | 1.1 |
| city: | 1.4 |
Percentage of units with a mortgage:
| Westhampton: | 75.4% |
| Falls Church: | 70.0% |
Housing prices:
- Average estimated value of detached houses in 2022 (52.8% of all units):
Westhampton: $1,243,433 Virginia: $472,865
- Average estimated value of townhouses or other attached units in 2022 (13.6% of all units):
This neighborhood: $569,951 Virginia: $457,437
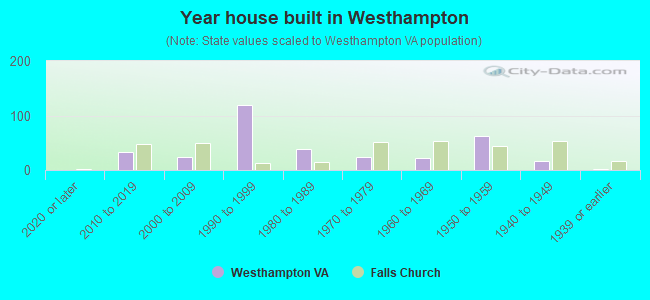
- Year house built in Westhampton
- 02020 or later
- 332010 to 2019
- 242000 to 2009
- 1201990 to 1999
- 391980 to 1989
- 241970 to 1979
- 221960 to 1969
- 631950 to 1959
- 171940 to 1949
- 21939 or earlier
City-data.com crime index for city in 2020 (higher means more crime):
| City: | 120.0 |
| U.S. average: | 219.5 |
Travel time to work (commute)
![Travel time to work (commute)]()
- 1Less than 5 minutes
- 155 to 9 minutes
- 2310 to 14 minutes
- 3115 to 19 minutes
- 5720 to 24 minutes
- 1525 to 29 minutes
- 7630 to 34 minutes
- 1535 to 39 minutes
- 1740 to 44 minutes
- 7745 to 59 minutes
- 960 to 89 minutes
- 390 or more minutes

Means of transportation to work
![Means of transportation to work]()
- 52.7%245Drove a car alone
- 7.5%35Carpooled
- 0.6%3Bus
- 13.1%61Subway or elevated rail
- 0.6%3Light rail, streetcar or trolley
- 2.2%10Motorcycle
- 3.4%16Bicycle
- 3.0%14Walked
- 0.2%1Other means
- 25.0%116Worked at home

Time leaving home to go to work
![Time leaving home to go to work]()
- 612:00 a.m. to 4:59 a.m.
- 85:00 a.m. to 5:29 a.m.
- 55:30 a.m. to 5:59 a.m.
- 146:00 a.m. to 6:29 a.m.
- 456:30 a.m. to 6:59 a.m.
- 277:00 a.m. to 7:29 a.m.
- 457:30 a.m. to 7:59 a.m.
- 658:00 a.m. to 8:29 a.m.
- 308:30 a.m. to 8:59 a.m.
- 479:00 a.m. to 9:59 a.m.
- 1510:00 a.m. to 10:59 a.m.
- 211:00 a.m. to 11:59 a.m.
- 2412:00 p.m. to 3:59 p.m.
- 104:00 p.m. to 11:59 p.m.

Occupations of males:
- Percentage of males in management occupations (except farmers):
Here: 23.1% city: 24.7%
- Percentage of males in business and financial operations occupations:
Here: 12.2% city: 9.3%
- Percentage of males in computer and mathematical occupations:
Here: 9.3% city: 15.0%
- Percentage of males in architecture and engineering occupations:
Here: 9.7% city: 3.6%
- Percentage of males in life, physical, and social science occupations:
Here: 7.1% city: 3.7%
- Percentage of males in legal occupations:
Here: 7.3% city: 6.6%
- Percentage of males in education, training, and library occupations:
Here: 2.2% city: 4.4%
- Percentage of males in arts, design, entertainment, sports, and media occupations:
Here: 3.3% city: 2.1%
- Percentage of males in healthcare practitioners and technical occupations:
Here: 3.3% city: 1.7%
- Percentage of males in service occupations:
Here: 6.9% city: 7.4%
- Percentage of males in sales and office occupations:
Here: 7.9% city: 12.4%
- Percentage of males in transportation occupations:
Here: 3.9% city: 0.5%
- Percentage of males in material moving occupations:
Here: 2.5% city: 2.9%
Occupations of females:
- Percentage of females in management occupations (except farmers):
Here: 21.9% city: 15.1%
- Percentage of females in business and financial operations occupations:
Here: 20.6% city: 14.3%
- Percentage of females in computer and mathematical occupations:
Here: 6.9% city: 8.7%
- Percentage of females in life, physical, and social science occupations:
Here: 5.3% city: 2.7%
- Percentage of females in legal occupations:
Here: 6.8% city: 4.6%
- Percentage of females in education, training, and library occupations:
Here: 9.3% city: 10.6%
- Percentage of females in arts, design, entertainment, sports, and media occupations:
Here: 2.6% city: 3.0%
- Percentage of females in healthcare practitioners and technical occupations:
Here: 7.6% city: 9.4%
- Percentage of females in service occupations:
Here: 4.0% city: 12.6%
- Percentage of females in sales and office occupations:
Here: 11.0% city: 15.9%
- Percentage of females in material moving occupations:
Here: 2.9% city: 0.5%
Percentage of people 16-64 in Armed Forces:
| Westhampton: | 0.0% |
| Falls Church: | 1.3% |
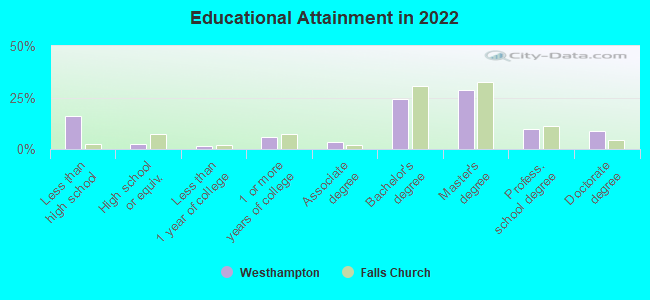
Education in this neighborhood (subdivision or community):
- Percentage of people 3 years and older in K-12 schools:
Westhampton: 22.1% Falls Church: 21.3%
- Percentage of people 3 years and older in undergraduate colleges:
Westhampton: 7.3% Falls Church: 4.5%
- Percentage of people 3 years and older in grad. or professional schools:
Westhampton: 0.4% Falls Church: 2.0%
- Percentage of students K-12 enrolled in private schools:
Westhampton: 49.7% Falls Church: 11.0%
Percentage of population below poverty level:
| Westhampton: | 2.0% |
| Falls Church: | 2.3% |
Median year owner moved in (as recorded in 2022):
| Westhampton: | 2009 |
| Falls Church: | 2010 |
Percentage of married-couple families with both working:
| Westhampton: | 77.2% |
| Falls Church: | 77.3% |
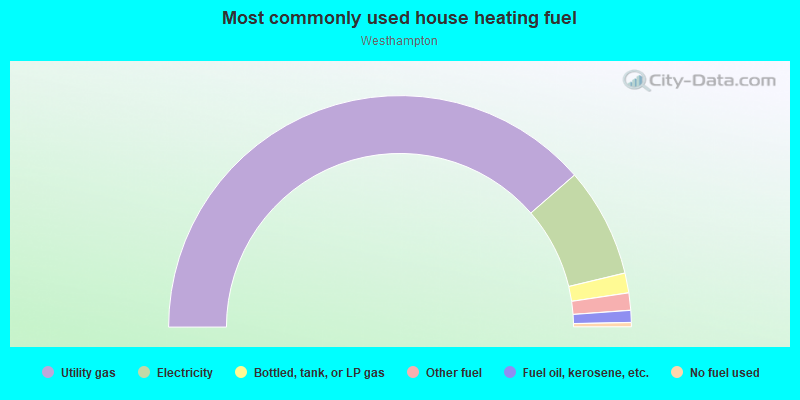
- 77.3%Utility gas
- 15.3%Electricity
- 2.8%Bottled, tank, or LP gas
- 2.4%Other fuel
- 1.7%Fuel oil, kerosene, etc.
- 0.6%No fuel used
Limited-access highways (interstate or state) in this neighborhood:
I- 66 (Custis Memorial Pkwy)
Length: 0.55 miles
Direction: E-W
Direction: E-W
Highways in this neighborhood:
Great Falls St (State Rte 694)
Length: 0.84 miles
Directions: N-S, SE-NW
Address range: 2014 to 2299
Directions: N-S, SE-NW
Address range: 2014 to 2299
State Rte 267 (Washington Dulles Access & Toll Rd)
Length: 0.66 miles
Directions: N-S, SE-NW
Directions: N-S, SE-NW
State Rte 695 (Idylwood Rd)
Length: 0.24 miles
Direction: E-W
Direction: E-W
Roads and streets:
Greenwich St
Length: 0.58 miles
Directions: N-S, SE-NW, SW-NE
Address range: 2000 to 2299
Directions: N-S, SE-NW, SW-NE
Address range: 2000 to 2299
Grayson Pl
Length: 0.49 miles
Directions: E-W, N-S, SE-NW, SW-NE
Address range: 2100 to 2299
Directions: E-W, N-S, SE-NW, SW-NE
Address range: 2100 to 2299
Co Rd 703 (Haycock Rd)
Length: 0.33 miles
Directions: E-W, SW-NE
Address range: 6800 to 6913
Directions: E-W, SW-NE
Address range: 6800 to 6913
Reynolds St
Length: 0.32 miles
Directions: N-S, SE-NW
Address range: 2000 to 2199
Directions: N-S, SE-NW
Address range: 2000 to 2199
Jenkins Ln
Length: 0.23 miles
Directions: E-W, N-S, SE-NW, SW-NE
Address range: 6900 to 6999
Directions: E-W, N-S, SE-NW, SW-NE
Address range: 6900 to 6999
Romney St
Length: 0.20 miles
Direction: E-W
Address range: 6900 to 6999
Direction: E-W
Address range: 6900 to 6999
Berkley St
Length: 0.19 miles
Direction: E-W
Address range: 6900 to 6926
Direction: E-W
Address range: 6900 to 6926
Turner Ave
Length: 0.14 miles
Directions: E-W, SE-NW
Directions: E-W, SE-NW
Grande Ln
Length: 0.14 miles
Direction: E-W
Address range: 6834 to 6871
Direction: E-W
Address range: 6834 to 6871
Hutchison St
Length: 0.12 miles
Direction: E-W
Address range: 6900 to 6999
Direction: E-W
Address range: 6900 to 6999
Galway Pl
Length: 0.08 miles
Direction: E-W
Address range: 2045 to 2051
Direction: E-W
Address range: 2045 to 2051
Williamsburg Pond Ct
Length: 0.08 miles
Directions: E-W, N-S, SW-NE
Address range: 6842 to 6875
Directions: E-W, N-S, SW-NE
Address range: 6842 to 6875
Westwood Pl
Length: 0.04 miles
Directions: E-W, SE-NW
Address range: 2200 to 2299
Directions: E-W, SE-NW
Address range: 2200 to 2299
Veranda Ct
Length: 0.03 miles
Direction: SE-NW
Address range: 2100 to 2131
Direction: SE-NW
Address range: 2100 to 2131