Westmoreland neighborhood in Toledo, Ohio (OH), 43607 detailed profile
Settings
X

Business Search - 14 Million verified businesses
Area: 0.357 square miles
Population: 2,158
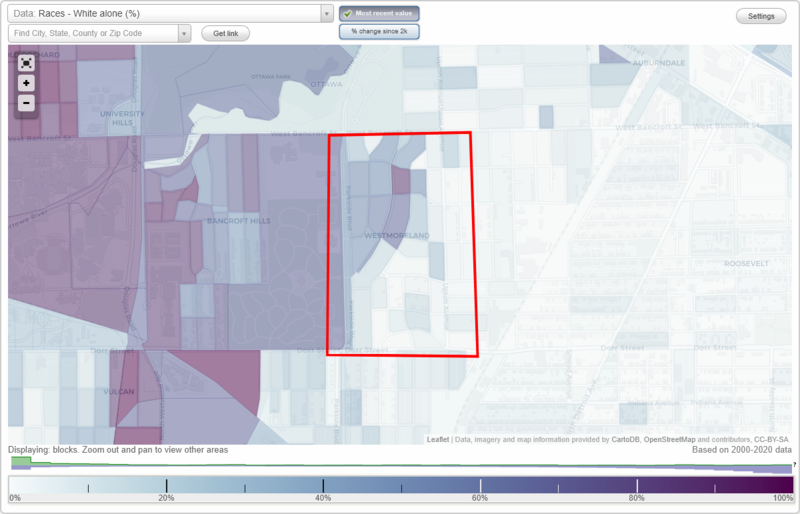
Population density:
| Westmoreland: | 6,042 people per square mile |
| Toledo: | 3,303 people per square mile |

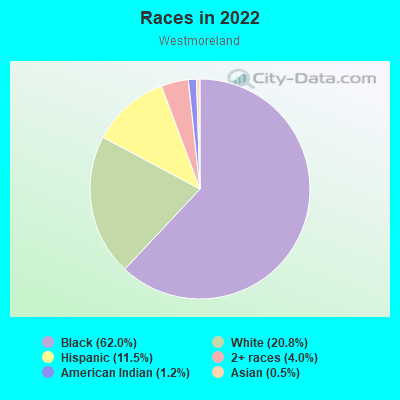
- 1,44562.0%Black
- 48520.8%White
- 26911.5%Hispanic or Latino
- 944.0%Two or more races
- 271.2%American Indian
- 110.5%Asian
Distribution of median household income
![Distribution of median household income]()
- 171Less than $10,000
- 117$10,000 to $19,999
- 199$20,000 to $29,999
- 136$30,000 to $39,999
- 78$40,000 to $49,999
- 79$50,000 to $59,999
- 64$60,000 to $74,999
- 115$75,000 to $99,999
- 66$100,000 to $124,999
- 47$125,000 to $149,999
- 140$150,000 to $199,999
- 112$200,000 or more

Distribution of owner-occupied house/condo value
![Distribution of owner-occupied house/condo value]()
- 508Less than $50,000
- 396$50,000 to $99,999
- 81$100,000 to $149,999
- 106$150,000 to $199,999
- 56$200,000 to $249,999
- 140$250,000 to $299,999
- 31$300,000 to $399,999
- 91$400,000 to $499,999

Distribution of rent paid by renters
![Distribution of rent paid by renters]()
- 31Less than $100
- 143$200 to $299
- 12$300 to $399
- 92$400 to $499
- 201$500 to $599
- 180$600 to $699
- 322$700 to $799
- 50$800 to $899
- 88$900 to $999
- 36$1,000 to $1,249
- 87$1,250 to $1,499
- 16$1,500 to $1,999

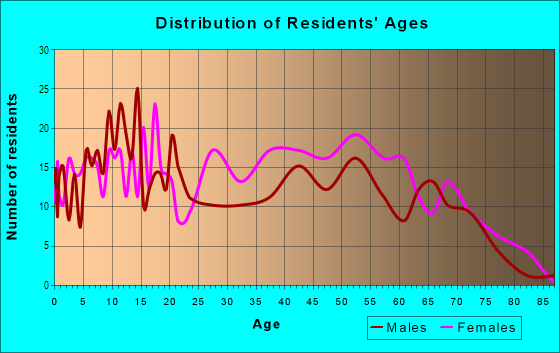
| Males: | 1,179 |
| Females: | 979 |
Males:
| This neighborhood: | 36.9 years |
| Whole city: | 35.4 years |
| This neighborhood: | 43.6 years |
| Whole city: | 38.2 years |
Average household size:
| Westmoreland: | 4.6 people |
| Toledo: | 2.1 people |
Percentage of family households:
| Westmoreland: | 36.2% |
| Toledo: | 37.8% |
| Here: | 34.2% |
| Toledo: | 29.6% |
Percentage of married-couple families with children (among all households):
| Westmoreland: | 22.8% |
| Toledo: | 19.6% |
Percentage of single-mother households (among all households):
| Westmoreland: | 28.2% |
| Toledo: | 21.5% |
Percentage of never married males 15 years old and over:
Percentage of never married females 15 years old and over:
| Westmoreland: | 26.9% |
| Toledo: | 22.1% |
Percentage of never married females 15 years old and over:
| Westmoreland: | 21.6% |
| city: | 21.2% |
Percentage of people that speak English not well or not at all:
| Westmoreland: | 0.1% |
| Toledo: | 0.7% |
Percentage of people born in this state:
Percentage of people born in another U.S. state:
Percentage of native residents but born outside the U.S.:
Percentage of foreign born residents:
| Here: | 71.2% |
| Toledo: | 76.6% |
Percentage of people born in another U.S. state:
| Westmoreland: | 26.7% |
| Toledo: | 19.3% |
Percentage of native residents but born outside the U.S.:
| Here: | 0.0% |
| city: | 0.6% |
Percentage of foreign born residents:
| Here: | 2.1% |
| Toledo: | 3.6% |
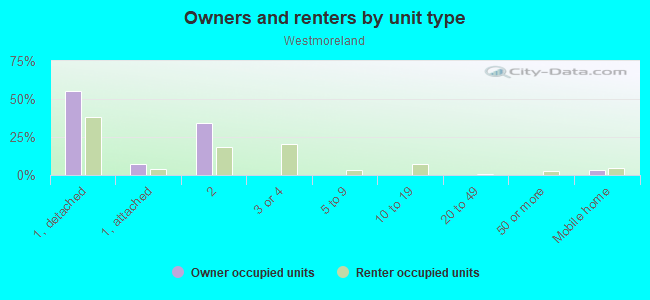
Owner-occupied
Renter-occupied

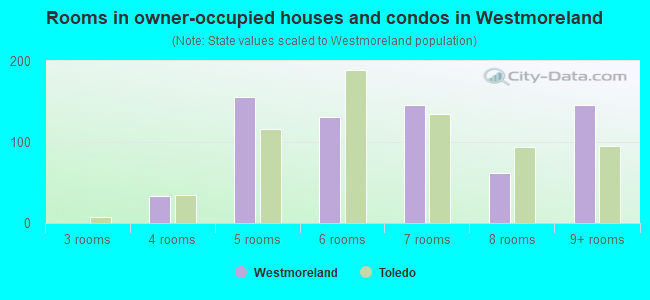
- Rooms in owner-occupied houses and condos in Westmoreland
- 01 room
- 02 rooms
- 03 rooms
- 334 rooms
- 1565 rooms
- 1316 rooms
- 1467 rooms
- 628 rooms
- 1469+ rooms
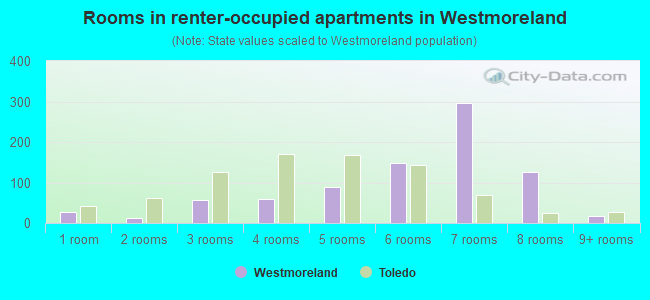
- Rooms in renter-occupied apartments in Westmoreland
- 271 room
- 122 rooms
- 583 rooms
- 594 rooms
- 895 rooms
- 1476 rooms
- 2967 rooms
- 1258 rooms
- 179+ rooms
Owner-occupied
Renter-occupied
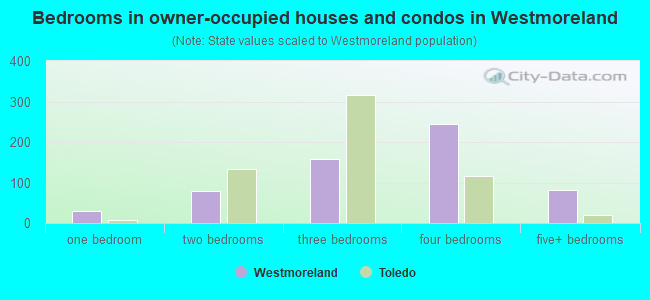
- Bedrooms in owner-occupied houses and condos in Westmoreland
- 0no bedroom
- 301 bedroom
- 782 bedrooms
- 1593 bedrooms
- 2454 bedrooms
- 825+ bedrooms
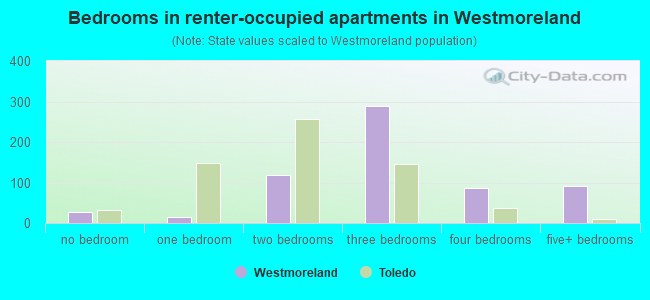
- Bedrooms in renter-occupied apartments in Westmoreland
- 27no bedroom
- 141 bedroom
- 1192 bedrooms
- 2903 bedrooms
- 874 bedrooms
- 915+ bedrooms
Average number of cars or other vehicles available in houses/condos:
Average number of cars or other vehicles available in apartments:
| This neighborhood: | 2.1 |
| Toledo: | 1.8 |
Average number of cars or other vehicles available in apartments:
| Here: | |
| city: |
Percentage of units with a mortgage:
| Westmoreland: | 50.6% |
| Toledo: | 54.5% |
Average estimated value of detached houses in 2022 (79.3% of all units):
| Westmoreland: | $70,847 |
| Toledo: | $131,824 |
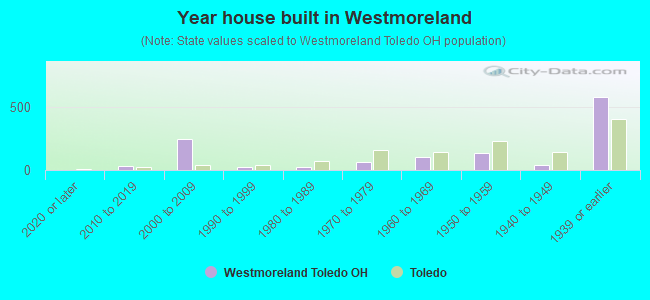
- Year house built in Westmoreland
- 02020 or later
- 322010 to 2019
- 2502000 to 2009
- 231990 to 1999
- 251980 to 1989
- 651970 to 1979
- 1021960 to 1969
- 1391950 to 1959
- 381940 to 1949
- 5791939 or earlier
City-data.com crime index for city in 2020 (higher means more crime):
| City: | 452.0 |
| U.S. average: | 219.5 |
Travel time to work (commute)
![Travel time to work (commute)]()
- 7Less than 5 minutes
- 735 to 9 minutes
- 26410 to 14 minutes
- 14415 to 19 minutes
- 28120 to 24 minutes
- 6525 to 29 minutes
- 3730 to 34 minutes
- 1935 to 39 minutes
- 2740 to 44 minutes
- 145 to 59 minutes
- 8760 to 89 minutes
- 1690 or more minutes

Means of transportation to work
![Means of transportation to work]()
- 79.8%726Drove a car alone
- 5.9%54Carpooled
- 22.5%205Bus
- 2.1%19Bicycle
- 8.2%75Walked
- 8.4%76Worked at home

Time leaving home to go to work
![Time leaving home to go to work]()
- 8112:00 a.m. to 4:59 a.m.
- 735:00 a.m. to 5:29 a.m.
- 195:30 a.m. to 5:59 a.m.
- 186:00 a.m. to 6:29 a.m.
- 706:30 a.m. to 6:59 a.m.
- 297:00 a.m. to 7:29 a.m.
- 1837:30 a.m. to 7:59 a.m.
- 718:00 a.m. to 8:29 a.m.
- 268:30 a.m. to 8:59 a.m.
- 1309:00 a.m. to 9:59 a.m.
- 910:00 a.m. to 10:59 a.m.
- 2511:00 a.m. to 11:59 a.m.
- 10512:00 p.m. to 3:59 p.m.
- 2044:00 p.m. to 11:59 p.m.

Occupations of males:
- Percentage of males in management occupations (except farmers):
Here: 1.2% city: 6.4%
- Percentage of males in business and financial operations occupations:
Here: 3.5% city: 3.0%
- Percentage of males in life, physical, and social science occupations:
Here: 7.8% city: 0.5%
- Percentage of males in arts, design, entertainment, sports, and media occupations:
Here: 1.7% city: 1.6%
- Percentage of males in healthcare practitioners and technical occupations:
Here: 5.2% city: 2.0%
- Percentage of males in service occupations:
Here: 20.1% city: 16.4%
- Percentage of males in sales and office occupations:
Here: 5.6% city: 14.8%
- Percentage of males in construction, extraction, and maintenance occupations:
Here: 4.6% city: 7.8%
- Percentage of males in production occupations:
Here: 28.7% city: 14.7%
- Percentage of males in transportation occupations:
Here: 2.9% city: 7.7%
- Percentage of males in material moving occupations:
Here: 9.2% city: 10.7%
Occupations of females:
- Percentage of females in business and financial operations occupations:
Here: 9.1% city: 4.1%
- Percentage of females in architecture and engineering occupations:
Here: 4.8% city: 0.4%
- Percentage of females in community and social services occupations:
Here: 2.8% city: 2.8%
- Percentage of females in education, training, and library occupations:
Here: 3.8% city: 7.0%
- Percentage of females in healthcare practitioners and technical occupations:
Here: 15.8% city: 9.7%
- Percentage of females in service occupations:
Here: 25.3% city: 24.8%
- Percentage of females in sales and office occupations:
Here: 28.5% city: 27.5%
- Percentage of females in production occupations:
Here: 14.2% city: 7.0%
- Percentage of females in material moving occupations:
Here: 1.2% city: 3.9%
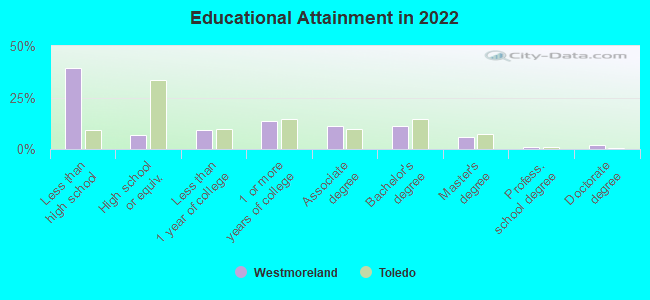
Education in this neighborhood (subdivision or community):
- Percentage of people 3 years and older in K-12 schools:
Westmoreland: 37.1% Toledo: 16.7%
- Percentage of people 3 years and older in undergraduate colleges:
Westmoreland: 20.7% Toledo: 6.1%
- Percentage of people 3 years and older in grad. or professional schools:
Westmoreland: 8.9% Toledo: 1.7%
- Percentage of students K-12 enrolled in private schools:
Westmoreland: 75.6% Toledo: 21.4%
Percentage of population below poverty level:
| Westmoreland: | 38.0% |
| Toledo: | 23.3% |
Median year owner moved in (as recorded in 2022):
| Westmoreland: | 1998 |
| Toledo: | 2008 |
Percentage of married-couple families with both working:
| Westmoreland: | 82.8% |
| Toledo: | 69.3% |
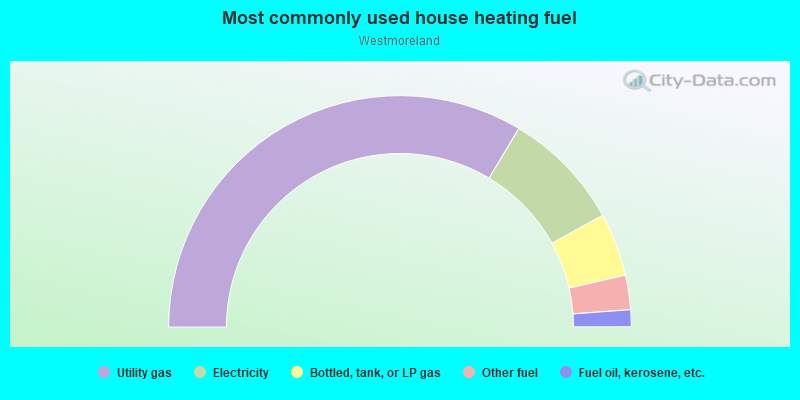
- 67.1%Utility gas
- 16.8%Electricity
- 8.8%Bottled, tank, or LP gas
- 4.8%Other fuel
- 2.4%Fuel oil, kerosene, etc.
Highways in this neighborhood:
State Rte 246 (Dorr St)
Length: 0.55 miles
Direction: E-W
Address range: 1841 to 2159
Direction: E-W
Address range: 1841 to 2159
Roads and streets:
Potomac Dr
Length: 0.76 miles
Directions: N-S, SW-NE
Address range: 1300 to 2199
Directions: N-S, SW-NE
Address range: 1300 to 2199
Shenandoah Rd
Length: 0.70 miles
Directions: N-S, SE-NW
Address range: 1300 to 2130
Directions: N-S, SE-NW
Address range: 1300 to 2130
Mount Vernon Ave
Length: 0.66 miles
Directions: E-W, N-S, SE-NW, SW-NE
Address range: 1600 to 2162
Directions: E-W, N-S, SE-NW, SW-NE
Address range: 1600 to 2162
Parkside Blvd
Length: 0.62 miles
Direction: N-S
Direction: N-S
Upton Ave
Length: 0.60 miles
Direction: N-S
Address range: 1300 to 2099
Direction: N-S
Address range: 1300 to 2099
W Woodruff Ave
Length: 0.56 miles
Directions: E-W, SE-NW, SW-NE
Address range: 1825 to 2199
Directions: E-W, SE-NW, SW-NE
Address range: 1825 to 2199
Grand Ave
Length: 0.50 miles
Directions: E-W, SE-NW
Address range: 1825 to 2199
Directions: E-W, SE-NW
Address range: 1825 to 2199
Parkdale Ave
Length: 0.38 miles
Direction: N-S
Address range: 1700 to 2099
Direction: N-S
Address range: 1700 to 2099
Oakwood Ave
Length: 0.37 miles
Directions: E-W, N-S, SW-NE
Address range: 1822 to 2099
Directions: E-W, N-S, SW-NE
Address range: 1822 to 2099
Richmond Rd
Length: 0.33 miles
Directions: E-W, N-S, SW-NE
Address range: 1800 to 2111
Directions: E-W, N-S, SW-NE
Address range: 1800 to 2111
Fernwood Ave
Length: 0.33 miles
Direction: E-W
Address range: 1900 to 2099
Direction: E-W
Address range: 1900 to 2099
Clarendon Dr
Length: 0.30 miles
Directions: E-W, SE-NW
Address range: 1900 to 2199
Directions: E-W, SE-NW
Address range: 1900 to 2199
Foster Ave
Length: 0.26 miles
Direction: E-W
Address range: 1827 to 1999
Direction: E-W
Address range: 1827 to 1999
Waverly Ave
Length: 0.25 miles
Directions: N-S, SE-NW
Address range: 1300 to 1699
Directions: N-S, SE-NW
Address range: 1300 to 1699
Addington Rd
Length: 0.25 miles
Directions: N-S, SW-NE
Address range: 1300 to 1699
Directions: N-S, SW-NE
Address range: 1300 to 1699
Crosswell Pl
Length: 0.19 miles
Directions: E-W, SE-NW
Address range: 1900 to 2099
Directions: E-W, SE-NW
Address range: 1900 to 2099
Sussex Pl
Length: 0.11 miles
Direction: E-W
Address range: 1900 to 1999
Direction: E-W
Address range: 1900 to 1999
Allenby Rd
Length: 0.09 miles
Direction: E-W
Address range: 2100 to 2199
Direction: E-W
Address range: 2100 to 2199