Westwood Heights neighborhood in Springdale, Arkansas (AR), 72762 detailed profile
Settings
X

Business Search - 14 Million verified businesses
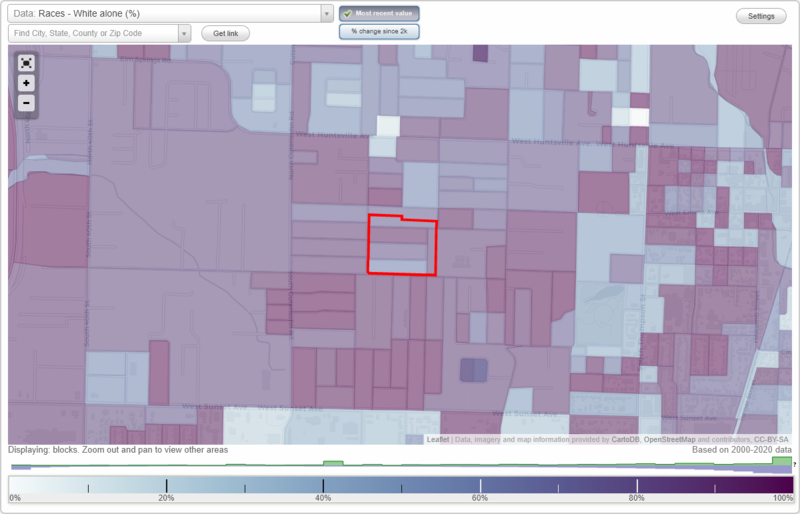
Area: 0.049 square miles
Population: 844
Population density:
| Westwood Heights: | 17,219 people per square mile |
| Springdale: | 2,742 people per square mile |

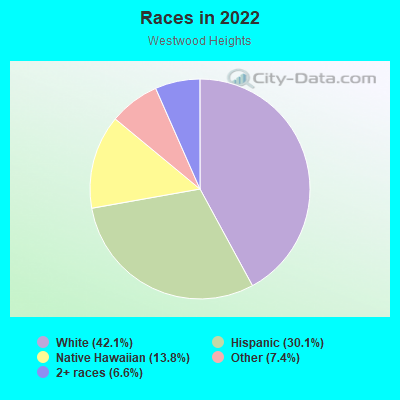
- 35942.1%White
- 25730.1%Hispanic or Latino
- 11813.8%Native Hawaiian and Other
Pacific Islander - 637.4%Some other race
- 566.6%Two or more races
Median household income in 2022:
| Westwood Heights: | $63,188 |
| Springdale: | $59,027 |
Distribution of median household income
![Distribution of median household income]()
- 9Less than $10,000
- 16$10,000 to $19,999
- 7$20,000 to $29,999
- 26$30,000 to $39,999
- 35$40,000 to $49,999
- 11$50,000 to $59,999
- 52$60,000 to $74,999
- 36$75,000 to $99,999
- 18$100,000 to $124,999
- 11$125,000 to $149,999
- 9$150,000 to $199,999
- 21$200,000 or more

Distribution of owner-occupied house/condo value
![Distribution of owner-occupied house/condo value]()
- 3Less than $50,000
- 20$50,000 to $99,999
- 43$100,000 to $149,999
- 50$150,000 to $199,999
- 15$200,000 to $249,999
- 24$250,000 to $299,999
- 5$300,000 to $399,999
- 2$400,000 to $499,999

Distribution of rent paid by renters
![Distribution of rent paid by renters]()
- 4$400 to $499
- 26$500 to $599
- 12$600 to $699
- 10$700 to $799
- 27$800 to $899
- 19$900 to $999
- 9$1,000 to $1,249
- 6$1,500 to $1,999

Median rent in 2022:
| Westwood Heights: | $851 |
| Springdale: | $739 |
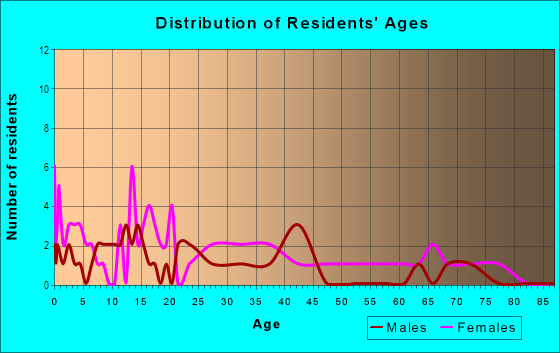
| Males: | 436 |
| Females: | 408 |
Males:
| This neighborhood: | 28.1 years |
| Whole city: | 33.3 years |
| This neighborhood: | 28.8 years |
| Whole city: | 31.9 years |
Average household size:
| Westwood Heights: | 3.4 people |
| Springdale: | 2.8 people |
Percentage of family households:
| Westwood Heights: | 58.8% |
| Springdale: | 57.1% |
| Here: | 63.1% |
| Springdale: | 53.0% |
Percentage of married-couple families with children (among all households):
| Westwood Heights: | 22.3% |
| Springdale: | 27.1% |
Percentage of single-mother households (among all households):
| Westwood Heights: | 2.1% |
| Springdale: | 6.6% |
Percentage of never married males 15 years old and over:
Percentage of never married females 15 years old and over:
| Westwood Heights: | 25.6% |
| Springdale: | 16.4% |
Percentage of never married females 15 years old and over:
| Westwood Heights: | 13.1% |
| city: | 13.1% |
Percentage of people that speak English not well or not at all:
| Westwood Heights: | 4.6% |
| Springdale: | 11.7% |
Percentage of people born in this state:
Percentage of people born in another U.S. state:
Percentage of native residents but born outside the U.S.:
Percentage of foreign born residents:
| Here: | 49.9% |
| Springdale: | 42.2% |
Percentage of people born in another U.S. state:
| Westwood Heights: | 30.1% |
| Springdale: | 29.1% |
Percentage of native residents but born outside the U.S.:
| Here: | 0.6% |
| city: | 1.9% |
Percentage of foreign born residents:
| Here: | 19.5% |
| Springdale: | 26.9% |
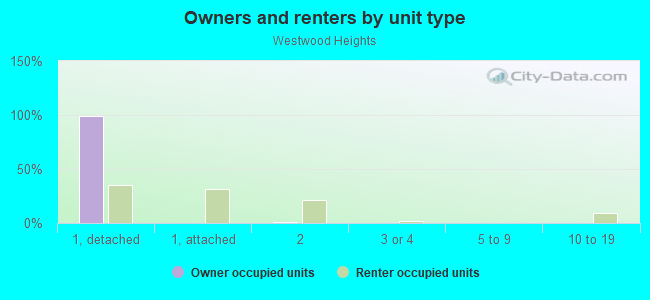
Owner-occupied
Renter-occupied

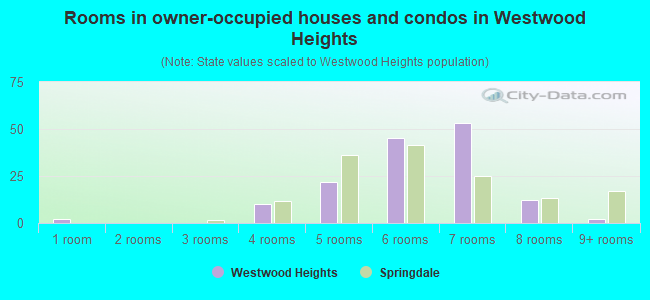
- Rooms in owner-occupied houses and condos in Westwood Heights
- 21 room
- 02 rooms
- 03 rooms
- 104 rooms
- 225 rooms
- 456 rooms
- 537 rooms
- 128 rooms
- 29+ rooms
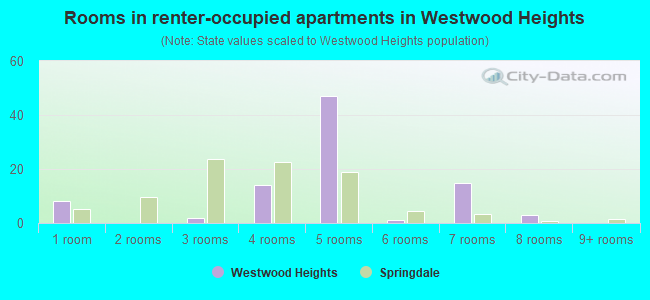
- Rooms in renter-occupied apartments in Westwood Heights
- 81 room
- 02 rooms
- 23 rooms
- 144 rooms
- 475 rooms
- 16 rooms
- 157 rooms
- 38 rooms
- 09+ rooms
Owner-occupied
Renter-occupied
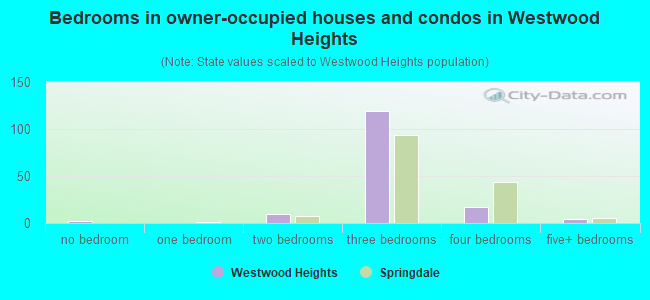
- Bedrooms in owner-occupied houses and condos in Westwood Heights
- 2no bedroom
- 01 bedroom
- 102 bedrooms
- 1193 bedrooms
- 174 bedrooms
- 45+ bedrooms
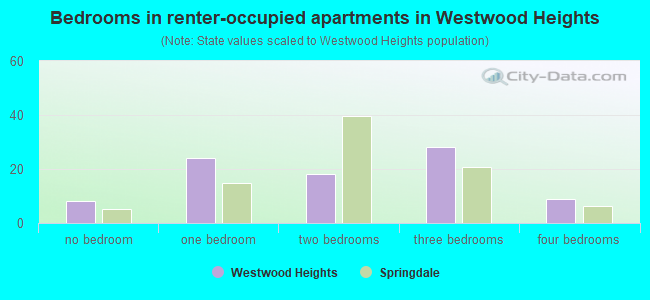
- Bedrooms in renter-occupied apartments in Westwood Heights
- 8no bedroom
- 241 bedroom
- 182 bedrooms
- 283 bedrooms
- 94 bedrooms
- 05+ bedrooms
Average number of cars or other vehicles available in houses/condos:
Average number of cars or other vehicles available in apartments:
| This neighborhood: | 2.5 |
| Springdale: | 2.3 |
Average number of cars or other vehicles available in apartments:
| Here: | 1.9 |
| city: | 1.6 |
Percentage of units with a mortgage:
| Westwood Heights: | 55.7% |
| Springdale: | 63.0% |
Average estimated value of detached houses in 2022 (77.2% of all units):
| Westwood Heights: | $178,166 |
| Arkansas: | $243,881 |
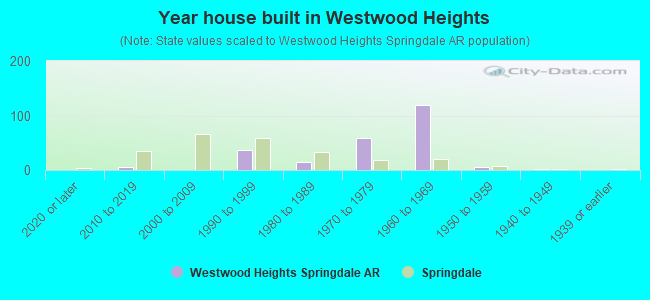
- Year house built in Westwood Heights
- 02020 or later
- 52010 to 2019
- 02000 to 2009
- 371990 to 1999
- 151980 to 1989
- 591970 to 1979
- 1201960 to 1969
- 61950 to 1959
- 21940 to 1949
- 01939 or earlier
City-data.com crime index for city in 2019 (higher means more crime):
| City: | 290.6 |
| U.S. average: | 223.9 |
Travel time to work (commute)
![Travel time to work (commute)]()
- 16Less than 5 minutes
- 465 to 9 minutes
- 11910 to 14 minutes
- 8015 to 19 minutes
- 3120 to 24 minutes
- 3425 to 29 minutes
- 2030 to 34 minutes
- 635 to 39 minutes
- 945 to 59 minutes
- 260 to 89 minutes
- 490 or more minutes

Means of transportation to work
![Means of transportation to work]()
- 73.8%271Drove a car alone
- 12.5%46Carpooled
- 1.9%7Walked
- 2.5%9Other means
- 9.0%33Worked at home

Time leaving home to go to work
![Time leaving home to go to work]()
- 4212:00 a.m. to 4:59 a.m.
- 125:00 a.m. to 5:29 a.m.
- 45:30 a.m. to 5:59 a.m.
- 266:00 a.m. to 6:29 a.m.
- 346:30 a.m. to 6:59 a.m.
- 447:00 a.m. to 7:29 a.m.
- 537:30 a.m. to 7:59 a.m.
- 318:00 a.m. to 8:29 a.m.
- 208:30 a.m. to 8:59 a.m.
- 209:00 a.m. to 9:59 a.m.
- 1110:00 a.m. to 10:59 a.m.
- 2011:00 a.m. to 11:59 a.m.
- 1912:00 p.m. to 3:59 p.m.
- 364:00 p.m. to 11:59 p.m.

Occupations of males:
- Percentage of males in management occupations (except farmers):
Here: 5.8% city: 8.4%
- Percentage of males in business and financial operations occupations:
Here: 1.2% city: 4.2%
- Percentage of males in computer and mathematical occupations:
Here: 3.2% city: 2.9%
- Percentage of males in service occupations:
Here: 7.7% city: 15.3%
- Percentage of males in sales and office occupations:
Here: 23.1% city: 12.1%
- Percentage of males in construction, extraction, and maintenance occupations:
Here: 23.2% city: 13.4%
- Percentage of males in production occupations:
Here: 13.2% city: 15.3%
- Percentage of males in transportation occupations:
Here: 6.7% city: 5.9%
- Percentage of males in material moving occupations:
Here: 6.1% city: 6.8%
Occupations of females:
- Percentage of females in management occupations (except farmers):
Here: 17.8% city: 8.9%
- Percentage of females in business and financial operations occupations:
Here: 1.2% city: 5.0%
- Percentage of females in life, physical, and social science occupations:
Here: 2.8% city: 0.4%
- Percentage of females in education, training, and library occupations:
Here: 5.3% city: 9.4%
- Percentage of females in arts, design, entertainment, sports, and media occupations:
Here: 1.0% city: 0.5%
- Percentage of females in healthcare practitioners and technical occupations:
Here: 6.5% city: 7.9%
- Percentage of females in service occupations:
Here: 20.7% city: 20.5%
- Percentage of females in sales and office occupations:
Here: 24.8% city: 24.2%
- Percentage of females in production occupations:
Here: 3.3% city: 11.2%
- Percentage of females in material moving occupations:
Here: 17.5% city: 4.1%
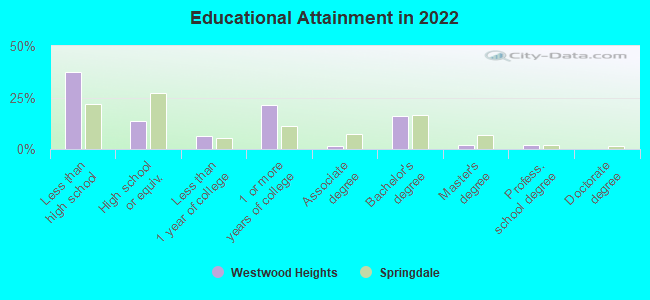
Education in this neighborhood (subdivision or community):
- Percentage of people 3 years and older in K-12 schools:
Westwood Heights: 20.4% Springdale: 23.4%
- Percentage of people 3 years and older in undergraduate colleges:
Westwood Heights: 8.1% Springdale: 3.7%
- Percentage of people 3 years and older in grad. or professional schools:
Westwood Heights: 0.0% Springdale: 0.6%
- Percentage of students K-12 enrolled in private schools:
Westwood Heights: 15.3% Springdale: 6.1%
Percentage of population below poverty level:
| Westwood Heights: | 14.8% |
| Springdale: | 14.9% |
Median year owner moved in (as recorded in 2022):
Median year renter moved in (as recorded in 2022):
| Westwood Heights: | 2006 |
| Springdale: | 2013 |
Median year renter moved in (as recorded in 2022):
| Westwood Heights: | 2018 |
| Springdale: | 2020 |
Percentage of married-couple families with both working:
| Westwood Heights: | 39.9% |
| Springdale: | 65.4% |
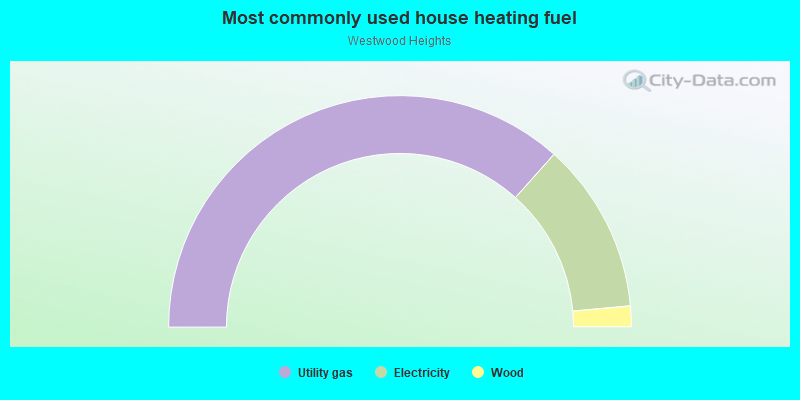
- 73.2%Utility gas
- 23.9%Electricity
- 2.9%Wood
Roads and streets:
Carlton St
Length: 0.12 miles
Direction: N-S
Address range: 200 to 399
Direction: N-S
Address range: 200 to 399
Westwood Ave
Length: 0.05 miles
Direction: E-W
Direction: E-W