Woodland Corporate Center neighborhood in Tampa, Florida (FL), 33614, 33634 detailed profile
Settings
X

Business Search - 14 Million verified businesses
Area: 0.223 square miles
Population: 595
Population density:
| Woodland Corporate Center: | 2,662 people per square mile |
| Tampa: | 3,553 people per square mile |

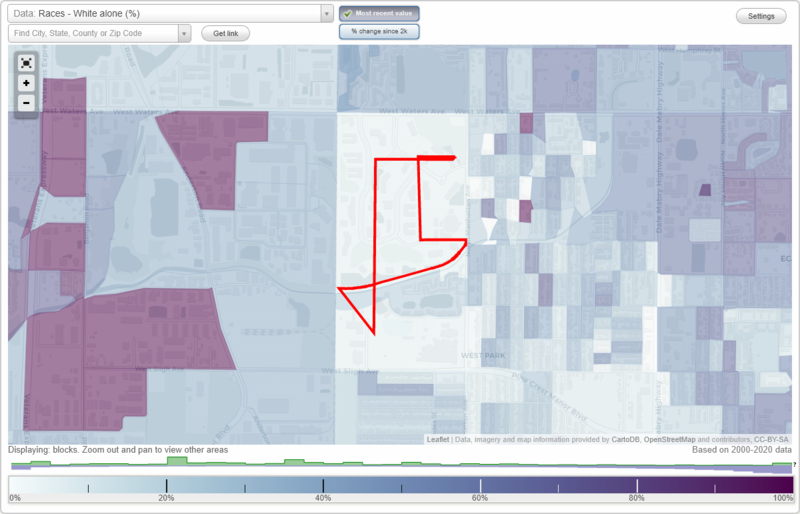
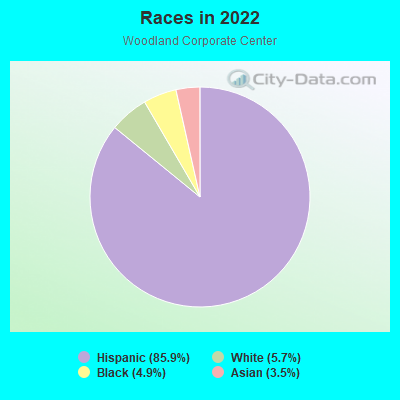
- 56285.9%Hispanic or Latino
- 375.7%White
- 324.9%Black
- 233.5%Asian
Median household income in 2022:
| Woodland Corporate Center: | $44,808 |
| Tampa: | $71,089 |
Distribution of median household income
![Distribution of median household income]()
- 1Less than $10,000
- 14$10,000 to $19,999
- 23$20,000 to $29,999
- 30$30,000 to $39,999
- 38$40,000 to $49,999
- 26$50,000 to $59,999
- 23$60,000 to $74,999
- 15$75,000 to $99,999
- 14$100,000 to $124,999
- 9$125,000 to $149,999
- 5$150,000 to $199,999
- 2$200,000 or more

Distribution of owner-occupied house/condo value
![Distribution of owner-occupied house/condo value]()
- 7Less than $50,000
- 13$50,000 to $99,999
- 10$100,000 to $149,999
- 7$150,000 to $199,999
- 8$200,000 to $249,999
- 5$250,000 to $299,999
- 17$300,000 to $399,999
- 4$400,000 to $499,999
- 3$500,000 to $749,999

Distribution of rent paid by renters
![Distribution of rent paid by renters]()
- 4$400 to $499
- 8$600 to $699
- 34$700 to $799
- 3$800 to $899
- 12$900 to $999
- 62$1,000 to $1,249
- 30$1,250 to $1,499
- 4$1,500 to $1,999

Median rent in 2022:
| Woodland Corporate Center: | $1,081 |
| Tampa: | $1,444 |
| Males: | 272 |
| Females: | 323 |
Males:
| This neighborhood: | 24.4 years |
| Whole city: | 35.5 years |
| This neighborhood: | 40.1 years |
| Whole city: | 35.1 years |
Average household size:
| Woodland Corporate Center: | 3.6 people |
| Tampa: | 2.3 people |
Percentage of family households:
| Woodland Corporate Center: | 77.6% |
| Tampa: | 39.9% |
| Here: | 35.9% |
| Tampa: | 35.4% |
Percentage of married-couple families with children (among all households):
| Woodland Corporate Center: | 10.0% |
| Tampa: | 25.1% |
Percentage of single-mother households (among all households):
| Woodland Corporate Center: | 17.6% |
| Tampa: | 12.2% |
Percentage of never married males 15 years old and over:
Percentage of never married females 15 years old and over:
| Woodland Corporate Center: | 20.9% |
| Tampa: | 23.6% |
Percentage of never married females 15 years old and over:
| Woodland Corporate Center: | 30.9% |
| city: | 20.9% |
Percentage of people that speak English not well or not at all:
| Woodland Corporate Center: | 37.9% |
| Tampa: | 6.4% |
Percentage of people born in this state:
Percentage of people born in another U.S. state:
Percentage of native residents but born outside the U.S.:
Percentage of foreign born residents:
| Here: | 23.1% |
| Tampa: | 39.7% |
Percentage of people born in another U.S. state:
| Woodland Corporate Center: | 15.0% |
| Tampa: | 35.7% |
Percentage of native residents but born outside the U.S.:
| Here: | 3.4% |
| city: | 4.6% |
Percentage of foreign born residents:
| Here: | 58.5% |
| Tampa: | 20.0% |
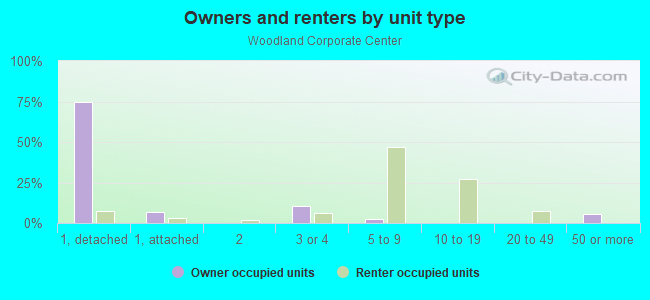
Owner-occupied
Renter-occupied

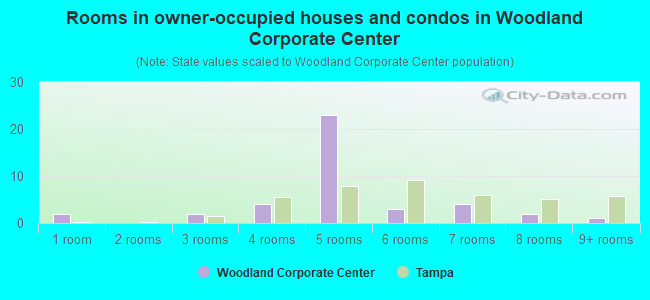
- Rooms in owner-occupied houses and condos in Woodland Corporate Center
- 21 room
- 02 rooms
- 23 rooms
- 44 rooms
- 235 rooms
- 36 rooms
- 47 rooms
- 28 rooms
- 19+ rooms
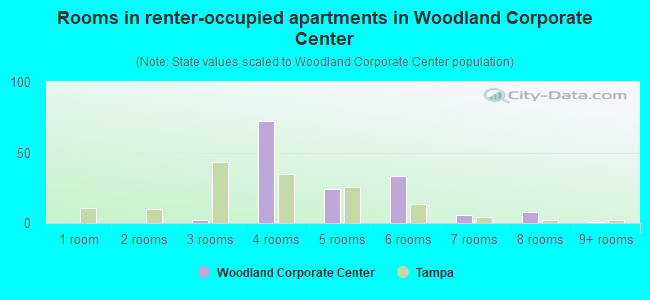
- Rooms in renter-occupied apartments in Woodland Corporate Center
- 01 room
- 02 rooms
- 23 rooms
- 724 rooms
- 245 rooms
- 336 rooms
- 67 rooms
- 88 rooms
- 19+ rooms
Owner-occupied
Renter-occupied
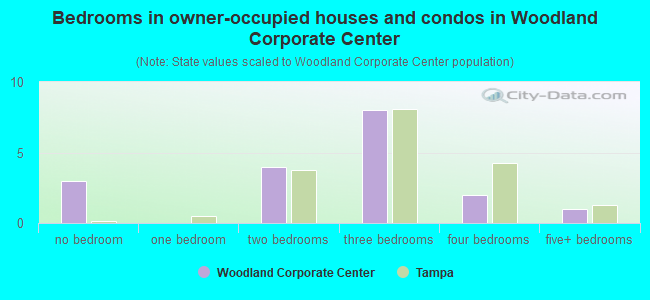
- Bedrooms in owner-occupied houses and condos in Woodland Corporate Center
- 3no bedroom
- 01 bedroom
- 42 bedrooms
- 83 bedrooms
- 24 bedrooms
- 15+ bedrooms
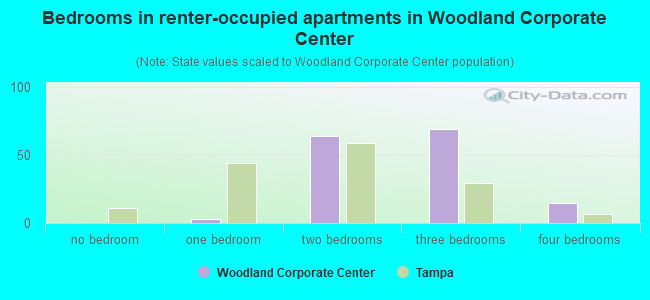
- Bedrooms in renter-occupied apartments in Woodland Corporate Center
- 0no bedroom
- 31 bedroom
- 642 bedrooms
- 693 bedrooms
- 154 bedrooms
- 05+ bedrooms
Average number of cars or other vehicles available in houses/condos:
Average number of cars or other vehicles available in apartments:
| This neighborhood: | 1.3 |
| Tampa: | 1.9 |
Average number of cars or other vehicles available in apartments:
| Here: | 1.8 |
| city: | 1.3 |
Percentage of units with a mortgage:
| Woodland Corporate Center: | 40.0% |
| Tampa: | 65.8% |
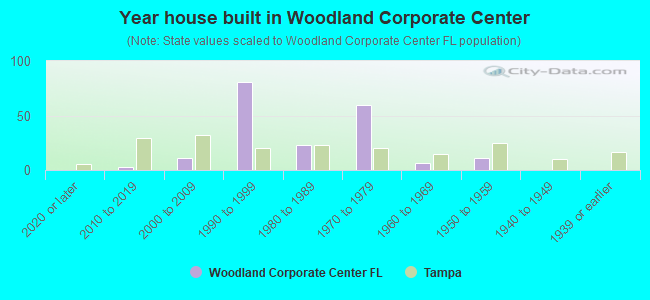
- Year house built in Woodland Corporate Center
- 02020 or later
- 32010 to 2019
- 112000 to 2009
- 811990 to 1999
- 231980 to 1989
- 601970 to 1979
- 61960 to 1969
- 111950 to 1959
- 01940 to 1949
- 01939 or earlier
City-data.com crime index for city in 2020 (higher means more crime):
| City: | 212.7 |
| U.S. average: | 219.5 |
Travel time to work (commute)
![Travel time to work (commute)]()
- 6Less than 5 minutes
- 145 to 9 minutes
- 3810 to 14 minutes
- 3515 to 19 minutes
- 2720 to 24 minutes
- 1325 to 29 minutes
- 2530 to 34 minutes
- 135 to 39 minutes
- 1240 to 44 minutes
- 2345 to 59 minutes
- 360 to 89 minutes
- 190 or more minutes

Means of transportation to work
![Means of transportation to work]()
- 84.0%259Drove a car alone
- 5.5%17Carpooled
- 4.5%14Bicycle
- 0.6%2Walked
- 1.3%4Other means
- 5.2%16Worked at home

Time leaving home to go to work
![Time leaving home to go to work]()
- 2412:00 a.m. to 4:59 a.m.
- 95:00 a.m. to 5:29 a.m.
- 195:30 a.m. to 5:59 a.m.
- 146:00 a.m. to 6:29 a.m.
- 226:30 a.m. to 6:59 a.m.
- 267:00 a.m. to 7:29 a.m.
- 147:30 a.m. to 7:59 a.m.
- 198:00 a.m. to 8:29 a.m.
- 168:30 a.m. to 8:59 a.m.
- 159:00 a.m. to 9:59 a.m.
- 410:00 a.m. to 10:59 a.m.
- 712:00 p.m. to 3:59 p.m.
- 64:00 p.m. to 11:59 p.m.

Occupations of males:
- Percentage of males in management occupations (except farmers):
Here: 4.6% city: 14.3%
- Percentage of males in business and financial operations occupations:
Here: 2.7% city: 7.8%
- Percentage of males in legal occupations:
Here: 3.9% city: 2.8%
- Percentage of males in education, training, and library occupations:
Here: 1.7% city: 2.2%
- Percentage of males in healthcare practitioners and technical occupations:
Here: 1.1% city: 4.9%
- Percentage of males in service occupations:
Here: 45.4% city: 13.7%
- Percentage of males in sales and office occupations:
Here: 4.7% city: 16.3%
- Percentage of males in farming, fishing, and forestry occupations:
Here: 1.4% city: 0.6%
- Percentage of males in construction, extraction, and maintenance occupations:
Here: 17.0% city: 8.2%
- Percentage of males in production occupations:
Here: 14.9% city: 3.7%
- Percentage of males in transportation occupations:
Here: 3.5% city: 5.8%
- Percentage of males in material moving occupations:
Here: 15.2% city: 3.8%
Occupations of females:
- Percentage of females in management occupations (except farmers):
Here: 2.1% city: 10.9%
- Percentage of females in business and financial operations occupations:
Here: 2.3% city: 8.5%
- Percentage of females in education, training, and library occupations:
Here: 5.5% city: 7.2%
- Percentage of females in healthcare practitioners and technical occupations:
Here: 2.4% city: 10.3%
- Percentage of females in service occupations:
Here: 48.1% city: 19.1%
- Percentage of females in sales and office occupations:
Here: 34.4% city: 27.1%
- Percentage of females in production occupations:
Here: 4.3% city: 2.0%
- Percentage of females in transportation occupations:
Here: 1.5% city: 1.3%
- Percentage of females in material moving occupations:
Here: 5.7% city: 1.4%
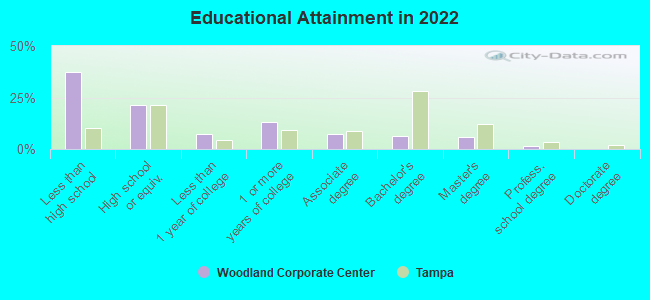
Education in this neighborhood (subdivision or community):
- Percentage of people 3 years and older in K-12 schools:
Woodland Corporate Center: 23.9% Tampa: 14.3%
- Percentage of people 3 years and older in undergraduate colleges:
Woodland Corporate Center: 11.0% Tampa: 7.8%
- Percentage of people 3 years and older in grad. or professional schools:
Woodland Corporate Center: 2.6% Tampa: 2.0%
- Percentage of students K-12 enrolled in private schools:
Woodland Corporate Center: 0.0% Tampa: 12.5%
Percentage of population below poverty level:
| Woodland Corporate Center: | 12.6% |
| Tampa: | 16.3% |
Median year owner moved in (as recorded in 2022):
Median year renter moved in (as recorded in 2022):
| Woodland Corporate Center: | 2007 |
| Tampa: | 2013 |
Median year renter moved in (as recorded in 2022):
| Woodland Corporate Center: | 2016 |
| Tampa: | 2020 |
Percentage of married-couple families with both working:
| Woodland Corporate Center: | 40.0% |
| Tampa: | 70.4% |
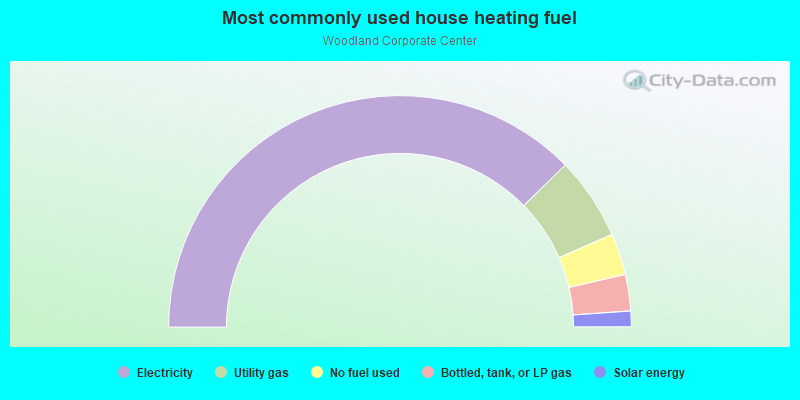
- 75.4%Electricity
- 11.6%Utility gas
- 5.8%No fuel used
- 5.1%Bottled, tank, or LP gas
- 2.2%Solar energy
Roads and streets:
Woodland Center Blvd
Length: 0.76 miles
Directions: E-W, N-S, SE-NW, SW-NE
Address range: 7700 to 7999
Directions: E-W, N-S, SE-NW, SW-NE
Address range: 7700 to 7999
Seedling Cir
Length: 0.20 miles
Directions: E-W, SE-NW, SW-NE
Address range: 4500 to 4599
Directions: E-W, SE-NW, SW-NE
Address range: 4500 to 4599
Cluster Oaks Ct
Length: 0.14 miles
Directions: E-W, SW-NE
Directions: E-W, SW-NE
Woodland Corporate Blvd
Length: 0.11 miles
Direction: SE-NW
Direction: SE-NW
Bald Cypress Pl
Length: 0.07 miles
Direction: N-S
Address range: 7600 to 7699
Direction: N-S
Address range: 7600 to 7699