Woodland Park neighborhood in Seattle, Washington (WA), 98103 detailed profile
Settings
X

Business Search - 14 Million verified businesses
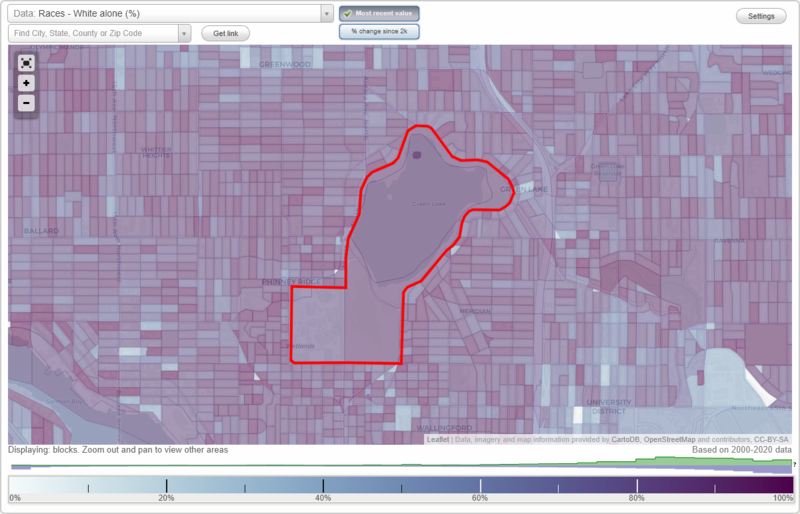
Area: 0.862 square miles
Population: 1,953
Population density:
| Woodland Park: | 2,266 people per square mile |
| Seattle: | 8,933 people per square mile |

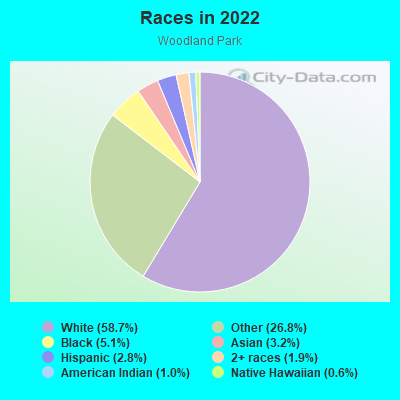
- 1,69358.7%White
- 77426.8%Some other race
- 1475.1%Black
- 913.2%Asian
- 802.8%Hispanic or Latino
- 541.9%Two or more races
- 291.0%American Indian
- 170.6%Native Hawaiian and Other
Pacific Islander
Median household income in 2022:
| Woodland Park: | $169,372 |
| Seattle: | $115,409 |
Distribution of median household income
![Distribution of median household income]()
- 147Less than $10,000
- 326$10,000 to $19,999
- 334$20,000 to $29,999
- 188$30,000 to $39,999
- 36$40,000 to $49,999
- 15$50,000 to $59,999
- 67$60,000 to $74,999
- 49$75,000 to $99,999
- 81$100,000 to $124,999
- 123$125,000 to $149,999
- 90$150,000 to $199,999
- 255$200,000 or more

Distribution of owner-occupied house/condo value
![Distribution of owner-occupied house/condo value]()
- 301Less than $50,000
- 12$50,000 to $99,999
- 11$100,000 to $149,999
- 6$150,000 to $199,999
- 4$200,000 to $249,999
- 35$300,000 to $399,999
- 152$400,000 to $499,999
- 35$500,000 to $749,999
- 127$750,000 to $999,999
- 279$1,000,000 or more

Distribution of rent paid by renters
![Distribution of rent paid by renters]()
- 720$200 to $299
- 16$300 to $399
- 4$400 to $499
- 8$500 to $599
- 242$600 to $699
- 16$700 to $799
- 194$800 to $899
- 97$900 to $999
- 179$1,000 to $1,249
- 27$1,250 to $1,499
- 193$1,500 to $1,999
- 151$2,000 or more

Median rent in 2022:
| Woodland Park: | $1,820 |
| Seattle: | $1,762 |
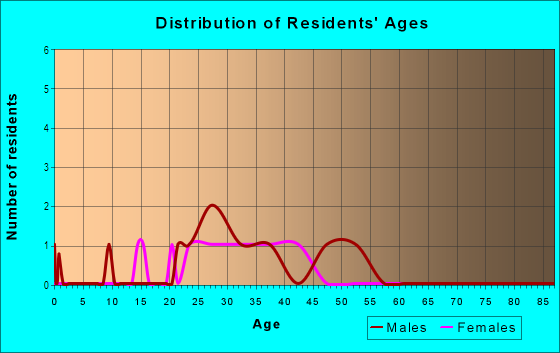
| Males: | 1,012 |
| Females: | 941 |
Males:
| This neighborhood: | 41.0 years |
| Whole city: | 35.7 years |
| This neighborhood: | 41.3 years |
| Whole city: | 36.2 years |
Average household size:
| Woodland Park: | 2.3 people |
| Seattle: | 2.0 people |
Percentage of family households:
| Woodland Park: | 34.6% |
| Seattle: | 30.9% |
| Here: | 39.5% |
| Seattle: | 33.2% |
Percentage of married-couple families with children (among all households):
| Woodland Park: | 35.6% |
| Seattle: | 36.5% |
Percentage of single-mother households (among all households):
| Woodland Park: | 6.0% |
| Seattle: | 9.3% |
Percentage of never married males 15 years old and over:
Percentage of never married females 15 years old and over:
| Woodland Park: | 21.4% |
| Seattle: | 24.9% |
Percentage of never married females 15 years old and over:
| Woodland Park: | 11.5% |
| city: | 22.3% |
Percentage of people that speak English not well or not at all:
| Woodland Park: | 0.9% |
| Seattle: | 3.2% |
Percentage of people born in this state:
Percentage of people born in another U.S. state:
Percentage of native residents but born outside the U.S.:
Percentage of foreign born residents:
| Here: | 38.9% |
| Seattle: | 34.6% |
Percentage of people born in another U.S. state:
| Woodland Park: | 50.4% |
| Seattle: | 42.9% |
Percentage of native residents but born outside the U.S.:
| Here: | 1.5% |
| city: | 2.2% |
Percentage of foreign born residents:
| Here: | 9.1% |
| Seattle: | 20.3% |
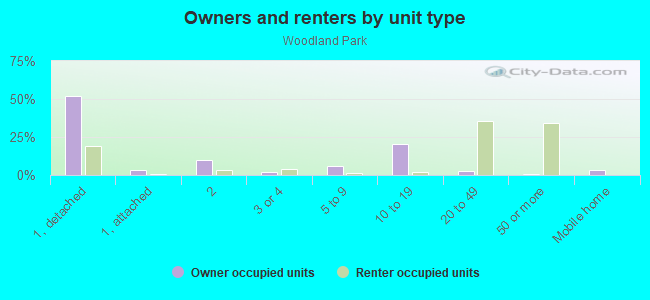
Owner-occupied
Renter-occupied

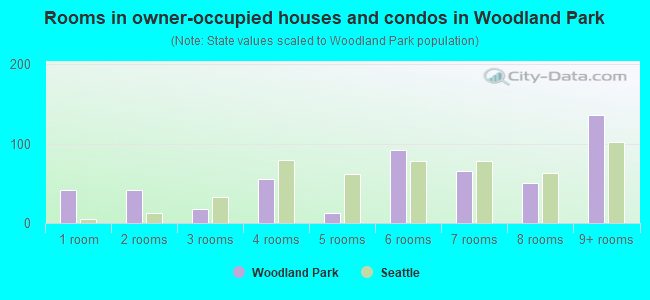
- Rooms in owner-occupied houses and condos in Woodland Park
- 411 room
- 422 rooms
- 183 rooms
- 564 rooms
- 125 rooms
- 926 rooms
- 657 rooms
- 508 rooms
- 1369+ rooms
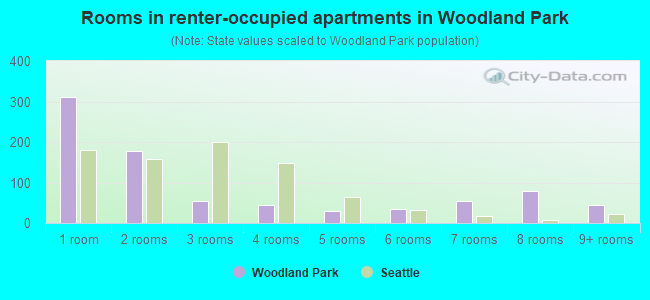
- Rooms in renter-occupied apartments in Woodland Park
- 3121 room
- 1782 rooms
- 553 rooms
- 444 rooms
- 305 rooms
- 356 rooms
- 557 rooms
- 788 rooms
- 459+ rooms
Owner-occupied
Renter-occupied
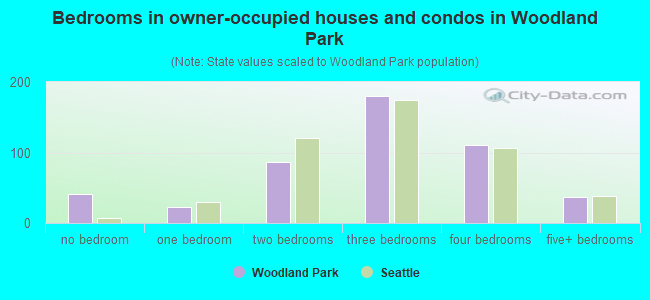
- Bedrooms in owner-occupied houses and condos in Woodland Park
- 41no bedroom
- 221 bedroom
- 862 bedrooms
- 1803 bedrooms
- 1104 bedrooms
- 375+ bedrooms
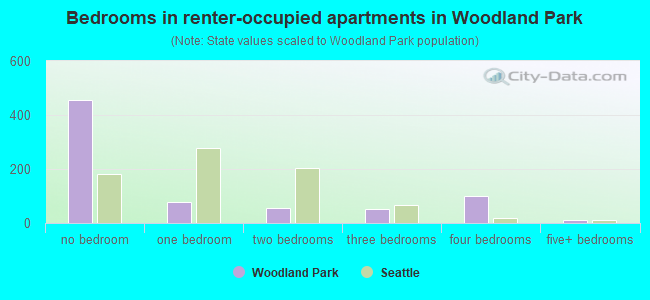
- Bedrooms in renter-occupied apartments in Woodland Park
- 457no bedroom
- 781 bedroom
- 562 bedrooms
- 523 bedrooms
- 1014 bedrooms
- 125+ bedrooms
Average number of cars or other vehicles available in houses/condos:
Average number of cars or other vehicles available in apartments:
| This neighborhood: | 1.8 |
| Seattle: | 1.7 |
Average number of cars or other vehicles available in apartments:
| Here: | 1.6 |
| city: | 0.9 |
Percentage of units with a mortgage:
| Woodland Park: | 62.8% |
| Seattle: | 70.4% |
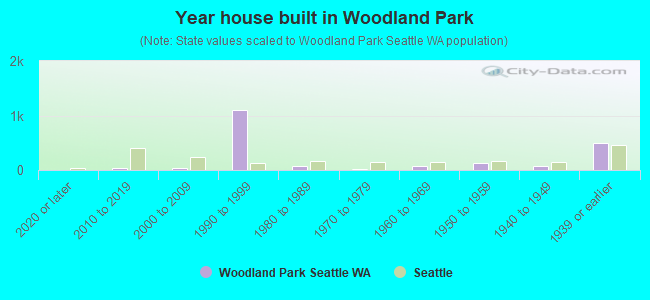
- Year house built in Woodland Park
- 02020 or later
- 302010 to 2019
- 412000 to 2009
- 1,1001990 to 1999
- 701980 to 1989
- 101970 to 1979
- 771960 to 1969
- 1331950 to 1959
- 781940 to 1949
- 4881939 or earlier
City-data.com crime index for city in 2020 (higher means more crime):
| City: | 440.8 |
| U.S. average: | 219.5 |
Travel time to work (commute)
![Travel time to work (commute)]()
- 26Less than 5 minutes
- 625 to 9 minutes
- 5110 to 14 minutes
- 15315 to 19 minutes
- 12520 to 24 minutes
- 5225 to 29 minutes
- 13030 to 34 minutes
- 4835 to 39 minutes
- 5940 to 44 minutes
- 5945 to 59 minutes
- 2060 to 89 minutes
- 1290 or more minutes

Means of transportation to work
![Means of transportation to work]()
- 46.6%467Drove a car alone
- 4.9%49Carpooled
- 17.4%174Bus
- 2.9%29Subway or elevated rail
- 0.3%3Light rail, streetcar or trolley
- 0.3%3Ferryboat
- 4.2%42Taxi
- 9.9%99Motorcycle
- 5.2%52Bicycle
- 4.3%43Walked
- 23.2%233Other means
- 20.6%207Worked at home

Time leaving home to go to work
![Time leaving home to go to work]()
- 712:00 a.m. to 4:59 a.m.
- 135:00 a.m. to 5:29 a.m.
- 85:30 a.m. to 5:59 a.m.
- 376:00 a.m. to 6:29 a.m.
- 406:30 a.m. to 6:59 a.m.
- 1397:00 a.m. to 7:29 a.m.
- 1227:30 a.m. to 7:59 a.m.
- 1498:00 a.m. to 8:29 a.m.
- 1208:30 a.m. to 8:59 a.m.
- 839:00 a.m. to 9:59 a.m.
- 5610:00 a.m. to 10:59 a.m.
- 411:00 a.m. to 11:59 a.m.
- 2012:00 p.m. to 3:59 p.m.
- 244:00 p.m. to 11:59 p.m.

Occupations of males:
- Percentage of males in management occupations (except farmers):
Here: 16.3% city: 16.0%
- Percentage of males in business and financial operations occupations:
Here: 4.1% city: 7.6%
- Percentage of males in computer and mathematical occupations:
Here: 15.0% city: 18.5%
- Percentage of males in architecture and engineering occupations:
Here: 5.4% city: 5.6%
- Percentage of males in life, physical, and social science occupations:
Here: 3.2% city: 2.5%
- Percentage of males in community and social services occupations:
Here: 1.2% city: 1.1%
- Percentage of males in legal occupations:
Here: 5.4% city: 2.0%
- Percentage of males in education, training, and library occupations:
Here: 14.0% city: 4.1%
- Percentage of males in arts, design, entertainment, sports, and media occupations:
Here: 3.9% city: 3.8%
- Percentage of males in healthcare practitioners and technical occupations:
Here: 1.3% city: 3.6%
- Percentage of males in service occupations:
Here: 9.5% city: 10.5%
- Percentage of males in sales and office occupations:
Here: 13.0% city: 12.0%
- Percentage of males in construction, extraction, and maintenance occupations:
Here: 3.2% city: 3.2%
- Percentage of males in production occupations:
Here: 2.1% city: 2.6%
- Percentage of males in transportation occupations:
Here: 1.2% city: 3.0%
Occupations of females:
- Percentage of females in management occupations (except farmers):
Here: 14.0% city: 14.2%
- Percentage of females in business and financial operations occupations:
Here: 11.5% city: 9.8%
- Percentage of females in computer and mathematical occupations:
Here: 11.6% city: 6.6%
- Percentage of females in architecture and engineering occupations:
Here: 7.1% city: 2.1%
- Percentage of females in life, physical, and social science occupations:
Here: 4.5% city: 3.0%
- Percentage of females in legal occupations:
Here: 1.0% city: 2.5%
- Percentage of females in education, training, and library occupations:
Here: 9.5% city: 8.7%
- Percentage of females in arts, design, entertainment, sports, and media occupations:
Here: 5.5% city: 5.0%
- Percentage of females in healthcare practitioners and technical occupations:
Here: 4.9% city: 9.6%
- Percentage of females in service occupations:
Here: 13.5% city: 13.7%
- Percentage of females in sales and office occupations:
Here: 15.8% city: 17.7%
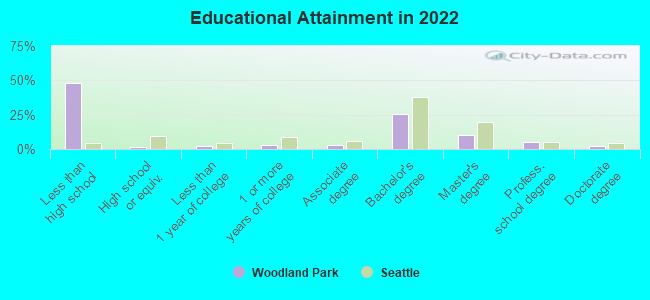
Education in this neighborhood (subdivision or community):
- Percentage of people 3 years and older in K-12 schools:
Woodland Park: 30.8% Seattle: 9.8%
- Percentage of people 3 years and older in undergraduate colleges:
Woodland Park: 1.6% Seattle: 6.3%
- Percentage of people 3 years and older in grad. or professional schools:
Woodland Park: 6.7% Seattle: 3.0%
- Percentage of students K-12 enrolled in private schools:
Woodland Park: 41.0% Seattle: 17.3%
Percentage of population below poverty level:
| Woodland Park: | 7.0% |
| Seattle: | 10.1% |
Median year owner moved in (as recorded in 2022):
Median year renter moved in (as recorded in 2022):
| Woodland Park: | 2006 |
| Seattle: | 2013 |
Median year renter moved in (as recorded in 2022):
| Woodland Park: | 2016 |
| Seattle: | 2021 |
Percentage of married-couple families with both working:
| Woodland Park: | 67.9% |
| Seattle: | 74.4% |
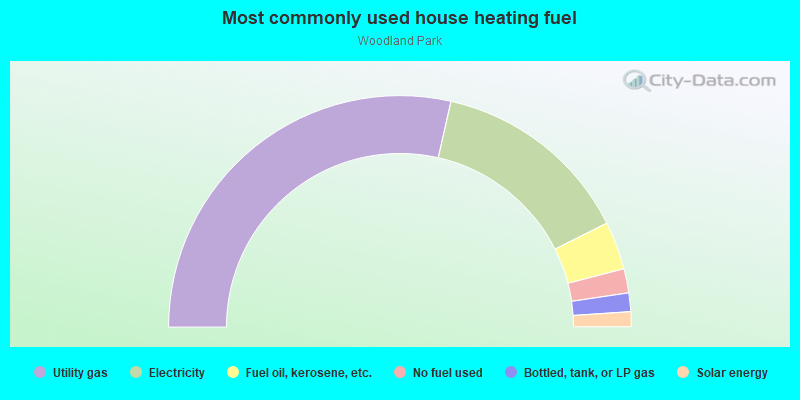
- 57.1%Utility gas
- 28.1%Electricity
- 6.7%Fuel oil, kerosene, etc.
- 3.4%No fuel used
- 2.6%Bottled, tank, or LP gas
- 2.1%Solar energy
Roads and streets:
E Green Lake Way N
Length: 1.19 miles
Directions: E-W, N-S, SW-NE
Address range: 5500 to 6999
Directions: E-W, N-S, SW-NE
Address range: 5500 to 6999
W Green Lake Way N
Length: 0.59 miles
Directions: E-W, N-S, SE-NW
Address range: 1302 to 6253
Directions: E-W, N-S, SE-NW
Address range: 1302 to 6253
E Green Lake Dr N
Length: 0.53 miles
Directions: N-S, SE-NW, SW-NE
Address range: 7000 to 7399
Directions: N-S, SE-NW, SW-NE
Address range: 7000 to 7399
Green Lake Way N
Length: 0.26 miles
Directions: N-S, SW-NE
Address range: 5000 to 5499
Directions: N-S, SW-NE
Address range: 5000 to 5499
N 50th St
Length: 0.13 miles
Direction: E-W
Address range: 1300 to 1399
Direction: E-W
Address range: 1300 to 1399
N 63rd St
Length: 0.08 miles
Direction: E-W
Direction: E-W